Wall Street bounced on US debt ceiling optimism: Nasdaq 100, Nikkei 225, Gold

Entry posted by MongiIG in Market News
284 views
Signs of progress on the US debt ceiling had provided some much-needed relief overnight, which translated to a mid-day bounce in the major US indices.
 Source: Bloomberg
Market Recap
Signs of progress on the US debt ceiling had provided some much-needed relief overnight, which translated to a mid-day bounce in the major US indices to deliver its best performance in two weeks (DJIA +1.24%; S&P 500 +1.19%; Nasdaq +1.28%). To be clear, a deal is still in the making but US President Joe Biden reassured that policymakers are all aligned in avoiding a default, which lifted hopes of a deal by the 1 June deadline.
The improved risk sentiments were broad-based across most sectors, with 9 out of 11 S&P 500 sectors in the green, while defensives were the underperformers. US regional banks were sharply higher as well, with the SPDR S&P Regional Banking ETF up 7.4% to its two-week high. News of strong customer deposit growth at Western Alliance Bancorp were the catalyst, which pushed back against previous concerns of deposit outflows.
A series of Federal Reserve (Fed) comments is lined up ahead today, with their tendency to stay hawkish likely to challenge rate cut expectations once more, although that could be overshadowed by US debt ceiling optimism if the deadlock can be broken over the coming days. Jobless claim numbers and the reading for Philadelphia Fed Manufacturing Index will be on the radar as well. ‘Bad news (on the economy) is bad news (for markets)’ seems to be the current underlying theme, so any signs of resilience will be preferred by equity bulls.
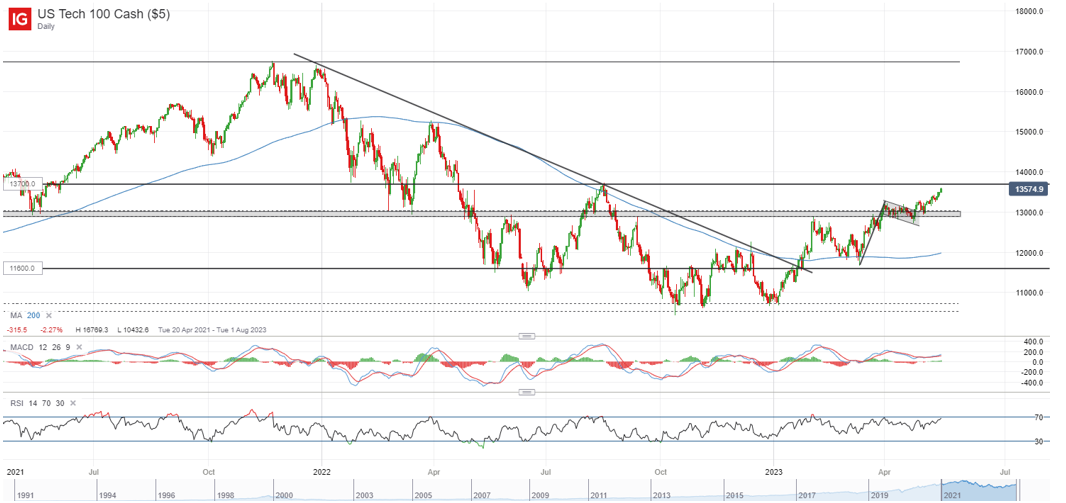
For now, the breakout from a bullish flag formation for the Nasdaq 100 index has been playing out well, as the index is heading to retest the August 2022 high at the 13,700 level. The flagpole projection could leave an eventual target at the 14,500 level. That said, one to watch on the potential lower highs on moving average convergence/divergence (MACD), which could raise the odds of a near-term retracement before a resumption of a broader move higher.
 Source: IG charts
Asia Open
Asian stocks look set for a positive open, with Nikkei +1.15%, ASX +0.59% and KOSPI +0.27% at the time of writing. Chinese equities have been under some pressure however, with the Nasdaq Golden Dragon China Index down 0.3% in the overnight session. Recent underperformance in China’s economic data continues to put a dampener over reopening optimism, with its economic surprise index falling sharply just over the past month. Australia’s employment numbers will be in focus today, with expectations for further cooling in job gains but unemployment rate at 3.5% could still leave room for further tightening on the table.
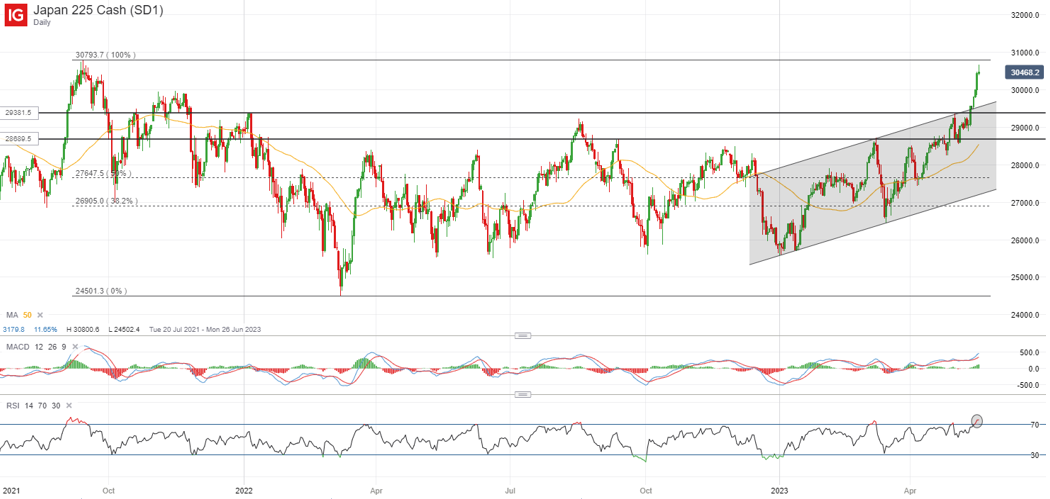
On the other hand, the Nikkei 225 index has been an outperformer, surging as much as 13.8% over the past month. That said, a shooting star formation seems to be in the making this morning and if it confirms by the close today, along with technical conditions in oversold territory (RSI, MACD), that may raise the odds of a near-term retracement. Any retracement may leave the 29,900 level on watch as potential support.
 Source: IG charts
On the watchlist: Gold prices back below US$2,000 level
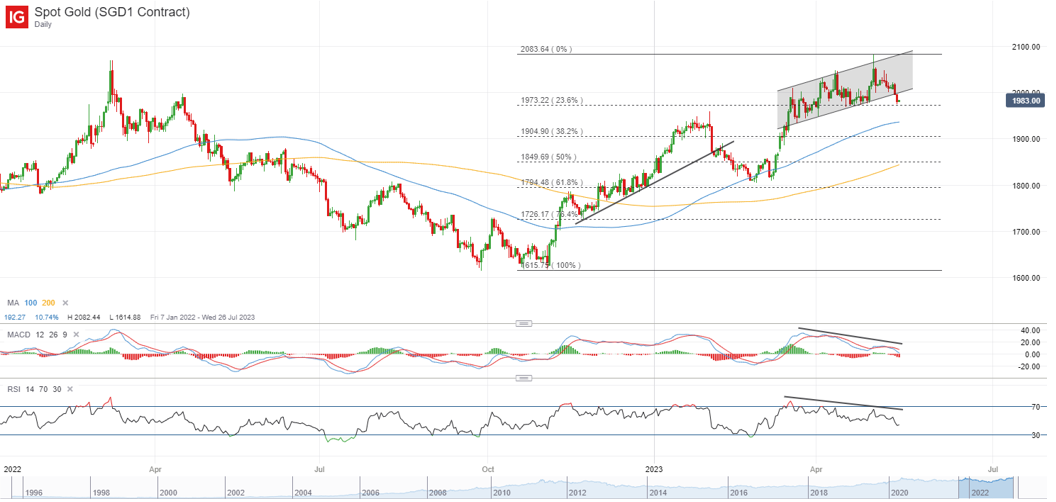
Rising Treasury yields alongside a stronger US Dollar have translated to a struggle for gold prices in defending its key psychological US$2,000 level, with recent downside marking a break of a rising channel pattern in place since March this year. This follows after lower highs are displayed on both the Relative Strength Index (RSI) and MACD, which suggests moderating upward momentum.
With prices back to retest its 23.6% Fibonacci retracement at the US$1,970 level, a further breakdown could leave the US$1,900 in sight next. The medium-term trend may remain up overall, which could suggest the rejection from its all-time high as a retracement rather than a clear reversal and still leave any formation of a higher low on watch ahead.
 Source: IG charts
Wednesday: DJIA +1.24%; S&P 500 +1.19%; Nasdaq +1.28%, DAX +0.34%, FTSE -0.36%


.jpeg.98f0cfe51803b4af23bc6b06b29ba6ff.jpeg)

0 Comments
Recommended Comments
There are no comments to display.
Create an account or sign in to comment
You need to be a member in order to leave a comment
Create an account
Sign up for a new account in our community. It's easy!
Register a new accountSign in
Already have an account? Sign in here.
Sign In Now