US jobs report preview: can payrolls build momentum as recovery takes shape?

Entry posted by MongiIG in Market News
1,342 views
Friday’s US jobs report is expected to bring an improved payrolls figure, although recent ADP and jobless claims data does raise questions.

Last month saw a somewhat underwhelming rise in payrolls, with a reading of 559,000 falling short of market expectations. While we did see an improvement over the prior month, we are yet to see a sustained recovery in jobs. With the Fed shifting in anticipation of higher prices and jobs, the ability to maintain an upward economic trajectory will be key for monetary policy expectations.
What do other employment readings tell us?
Markets are optimistic for Friday’s jobs report, with predictions of a figure around 700,000 for the headline payrolls figure highlighting the feeling that this recovery will continue to gain momentum. One method to gauge where Friday's jobs figure could come in is to look at some of the alternate employment surveys released in the lead-up to this report.
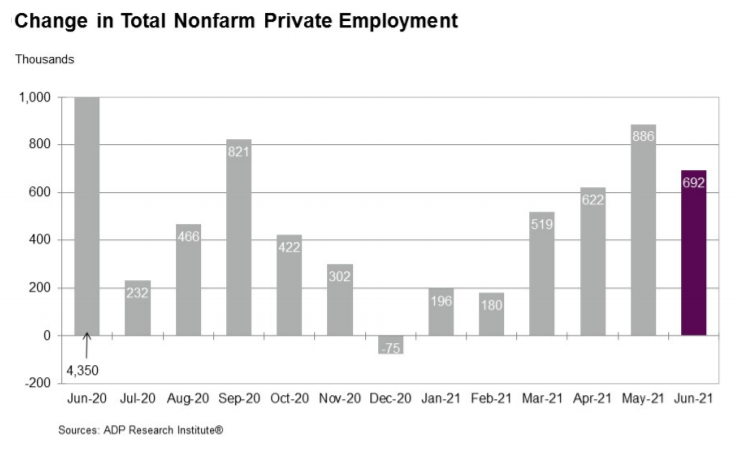
The ADP private payrolls survey provided a somewhat mixed picture, with the reading of 692,000 representing a better-than-expected figure but lost ground against the prior month’s 886,000. Meanwhile, that prior figure was also heavily revised down from the initial estimate of 978,000. The image below highlights how the June figure represents the first decline for the ADP payrolls survey since February. Hardly the kind of release that inspires confidence.
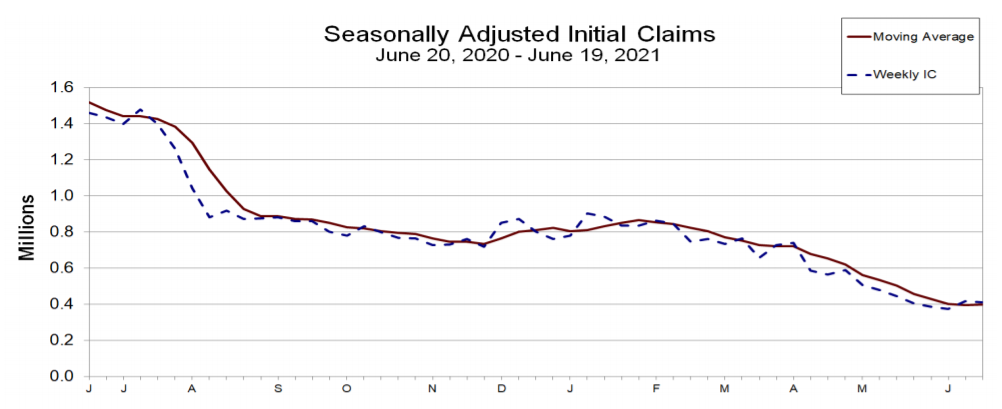
The unemployment claims data has also taken a turn for the worst of late, with the steady decline seen over the course of May running into trouble in early June. The inability to continue driving lower highlights a bump in the road which could be reflected in Friday's jobs report. That tick higher is reflected in the four-week average claims. Nonetheless, the chart below highlights the positive trajectory seen over recent months.
What is expected?
The first thing financial markets will be looking at will be the non-farm payrolls figure, with expectations of a rise into 700,000 providing a marker for traders to gauge the latest release against. Weakness across some of the secondary employment surveys highlights the potential for this to underperform.
After the payrolls figure, traders will typically look towards the unemployment rate as a key gauge of whether the economic advancement remains on track or has started to stall. Forecasts point towards an improved figure of 5.6%, following a 14-month low of 5.8% last month. One element that could hold back the decline in unemployment would be a rise in the participation rate, which remains stubbornly low after the collapse in early 2020. With the participation rate expected to climb as the recovery gathers pace, it is likely that this proves a hinderance for the unemployment rate. It could just make more sense to look at the U-6 unemployment rate given that this also includes those removed from the common U-3 rate.
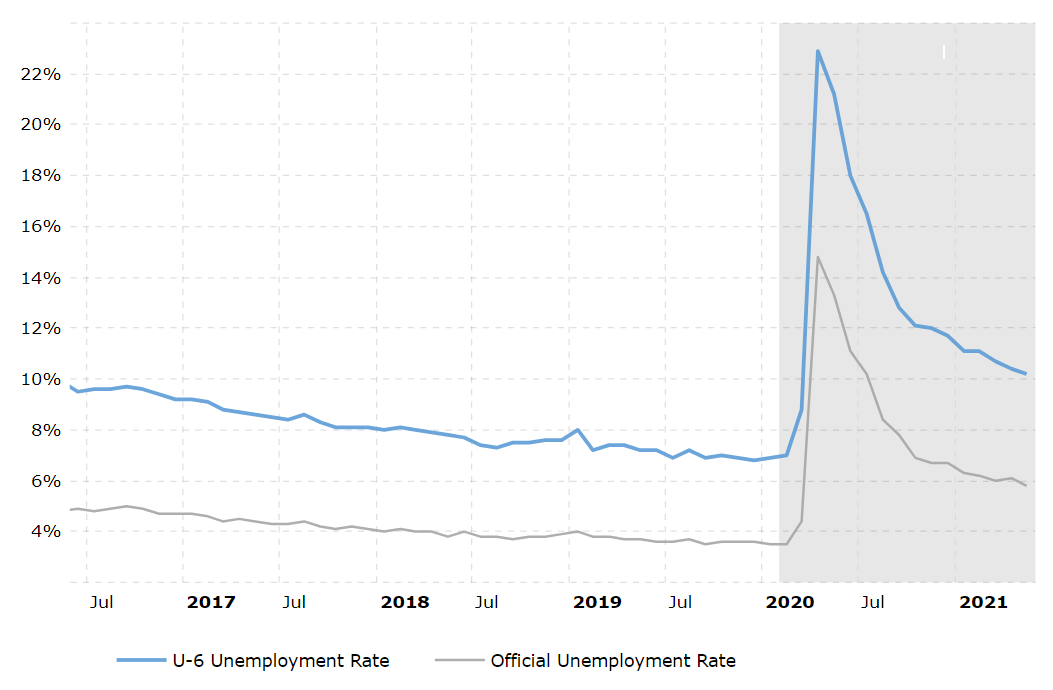 Source: macrotrends.net
On the average earnings front, markets are looking for growth to remain elevated after two months of sharp gains. Predictions of 0.4% may be down on the previous two month’s readings of 0.7% and 0.5%, yet such consecutive monthly growth rates are very rare.
IG Joshua Mahony | Senior Market Analyst, London | Publication date: Thursday 01 July 2021


.jpeg.98f0cfe51803b4af23bc6b06b29ba6ff.jpeg)

0 Comments
Recommended Comments
There are no comments to display.
Create an account or sign in to comment
You need to be a member in order to leave a comment
Create an account
Sign up for a new account in our community. It's easy!
Register a new accountSign in
Already have an account? Sign in here.
Sign In Now