Trading Earnings Season: 3 Steps for Using Earnings Reports

Entry posted by ArvinIG in Analyst Article
596 views
Earnings season can be a great time for a trader to get insight on their equity investments, as well as benefit from short-term volatility. But in order to maximize this trading opportunity, there are some key considerations to make before diving in. Read on for our three steps to follow when using earnings reports for trading.
3 STEPS FOR USING EARNINGS REPORTS IN YOUR TRADING
Preparing for earnings season involves choosing the companies to focus on and undertaking thorough research on the market before executing the trade.
1) Choose Companies to Focus On
The first step is to select the stocks to trade during the period. It is advisable for traders to go for a small number of companies, perhaps stocks with which they are familiar or trade already and find out the dates on which their earnings will be released. Large bellwether stocks are worth investigating, whether one is trading them or not, as their results can impact wider industries.
When deciding on the stocks to go for, traders should understand that the relationship between an earnings result and subsequent price reaction is not always straightforward. Although better-than-expected earnings are generally bullish, they do not always translate to immediate price gains and the opposite holds true as well. An example of this can be seen below, with Walmart’s strong earnings in Q3 2018 failing to excite market participants.
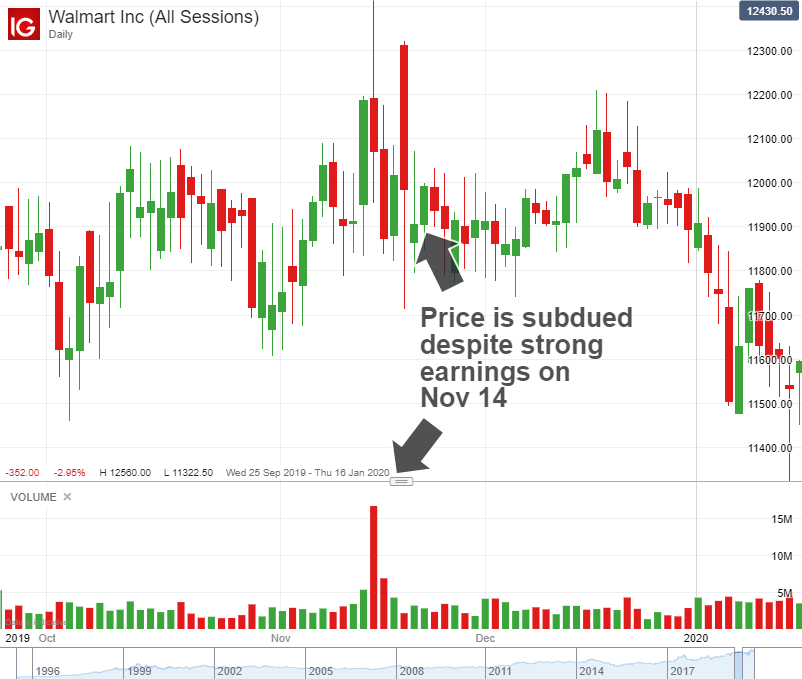
While encouraging, a quarterly report is more than last quarter’s results compared to expectations. Indeed, analysts are often much more concerned with the future expectations of the firm as price is a forward-looking metric, with future earnings being calculated in current prices.
With that in mind, it becomes more reasonable when investors shy away from a stock with strong results for the past quarter, but an abysmal outlook for the future. A weaker outlook can seriously undercut a stock’s current valuation, regardless of past performance, a fact that is realized all too often during earnings season.
Read our guide on How to Pick Stocks to choose the right companies for your stocks portfolio.
2) Do Your Research
Doing your stock research properly will involve looking at estimated earnings for your chosen stock and how they compare with analysts’ expectations. Also, traders should make sure they look at historical figures to get a feel for how the market has responded to releases in the past.
While earnings season is typically thought of in terms what the results mean for a single stock, the season as a whole can also offer important takeaways.
Information is offered on a company-specific basis, but common themes can ring true throughout. Headwinds like coronavirus, geopolitical tension, regulatory uncertainty or cyclicality can combine to form a wave of worries across a sector if cited often enough.
Traders should investigate how such headwinds impact one sector or stock compared to others. For example, while a great many industries suffered during the coronavirus outbreak, March 2020 saw Greece-based tanker vessel operator Top Ships Inc (TOPS) experience a surge in product demand in areas such as cleaning supplies and paper products leading to increased shipping requirements. This in turn created higher trading volume and volatility.
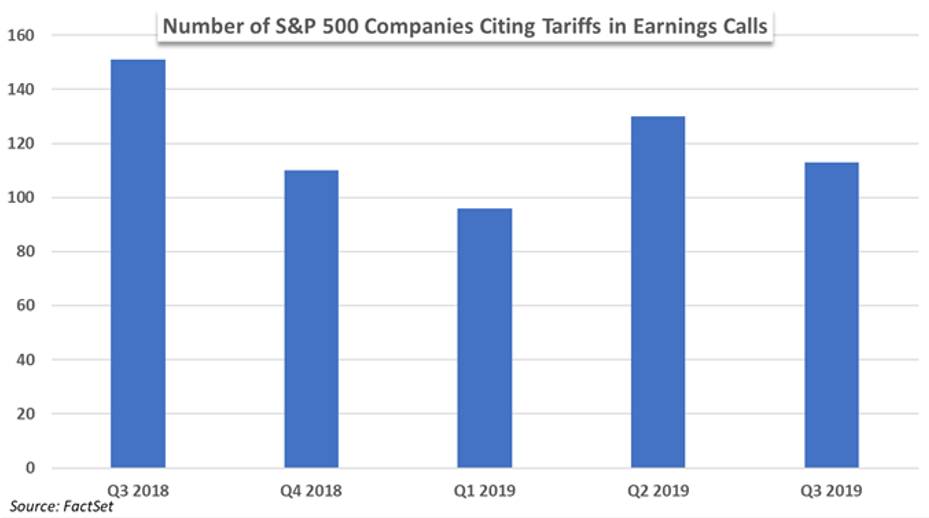
The effect of headwinds has also been witnessed, for example, with Brexit as companies delay capital expenditures until a post-Brexit order is established and the business environment is stable. Similarly, frequent mentions of trade-related headwinds have worked to undermine a variety of sectors from semiconductors to consumer staples in the US amid the US-China trade war, evidenced in the chart above by the surging mentions of ‘tariff’ in earnings reports for companies in the S&P 500.
While these issues may not doom a stock to negative returns singlehandedly (as the TOPS example demonstrates), their appearance across an entire market can hint at their pervasiveness and the broader downward pressure they can exert on outlooks and valuations. Consequently, traders should monitor common complaints among corporations as it may help inform their broader macroeconomic strategy as anecdotal evidence builds to form a tangible threat to the broader index.
3) Formulate a Trading Strategy – and Follow It
Formulating a trading strategy for earnings season should include methodology for entry and exits, profit goals, time spent trading and a risk management plan. Trading earnings reports is difficult and risky. For some, trading around the event may not suit their risk profile. As such, any position taken should be adequately hedged and include a stop. That said, volatility can create unique circumstances, ripe with opportunity for a few specific strategies.
When formulating a strategy for earnings season, traders should be aware that quarterly earnings are capable of seriously uprooting an ongoing price trend due to their relative infrequency and importance. This causes traders to position for severe price swings – evidenced by heightened implied volatility.
Since it is exceedingly difficult for the average investor to correctly forecast how the company will perform – never mind the eventual impact on its share price - the risk-reward of entering a position immediately prior to a report can be skewed. If an investment vehicle of choice is impacted by implied volatility, the effect on the position can be particularly acute because implied volatility remains high until the results are released but typically collapses quickly afterward resulting in what is known as ‘IV Crush’.
IV Crush is, as the name would suggest, when the implied volatility of a stock drops significantly, usually because the uncertainty has passed. The abrupt reversal in implied volatility is often accompanied by realized volatility, but not always.
The discrepancy between implied and realized volatility allows for some unique trading strategies like straddles and strangles which seek to capitalize on absolute volatility of option contracts or short straddles and strangles which aim to capitalize on IV crush.
Straddles
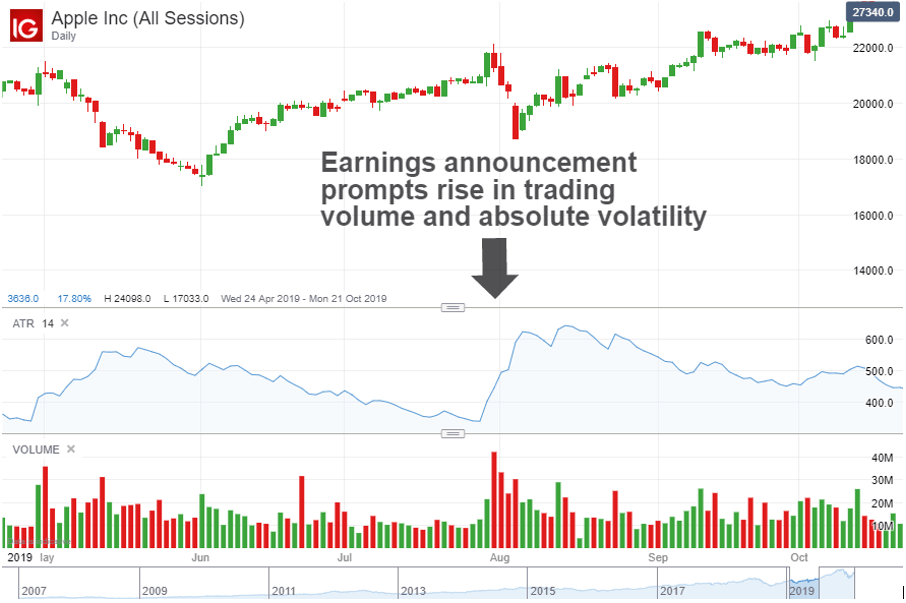
Straddles involve buying both the call (buy) and the put (sell) option simultaneously with the same strike price (the fixed price at which the holder of an option can buy or sell), and the same expiration date. When applied to earnings, traders might straddle before the release and can profit from either a rise or fall in the stock’s price, as long as the stock’s price deviates from the strike price by an amount more than the total cost of the premium. This could potentially make a straddle a viable choice if traders think absolute volatility will be high but aren’t sure of the direction the move will take.
The chart below shows Apple’s August 2019 earnings release prompt more trading and higher absolute volatility, as shown by the Volume and Average True Range indicators respectively, representing an example of a potentially favorable outcome for a straddle.
A short straddle involves selling both the call and put options with the same strike price and expiration date. This move is often suited to ‘IV crush’ instances when the trader believes the price will not move too much over the course of the options contract.
Strangles
Strangles are similar to straddles, and can likewise have a long and short route. But while straddles have the same strike price for the call and put options, strangles have different strike prices. Strangles may potentially be a viable choice if the trader believes a stock has more chance of moving in one direction than the other following an earnings report, but still seeks protection if the position takes a contrary swing.
TRADING EARNINGS SEASON: KEY TAKEAWAYS
When trading earning season, there may well be a period of uncertainty and extreme volatility ahead. This makes picking the right stock, thorough background research and intelligent risk management key to navigating the period as planned – as well as implementing the right trading strategy. With these things in place, traders can maximize their chance of success and hopefully carry some key knowledge over to the next earning season.
MORE ON EQUITIES AND STOCK TRADING
Hungry for more information about equities? Make sure you check out our stock market section for comprehensive guidance on how to navigate this asset class, including:
DailyFX provides forex news and technical analysis on the trends that influence the global currency markets.
Peter Hanks & Ben Lobel
19 July 2021
-
 1
1


.jpeg.98f0cfe51803b4af23bc6b06b29ba6ff.jpeg)


0 Comments
Recommended Comments
There are no comments to display.
Create an account or sign in to comment
You need to be a member in order to leave a comment
Create an account
Sign up for a new account in our community. It's easy!
Register a new accountSign in
Already have an account? Sign in here.
Sign In Now