UK Pound Forecast: Sterling Setups for the Week Ahead, GBP/USD, EUR/GBP

Entry posted by MongiIG in Market News
1,668 views
POUND STERLING (GBP)TALKING POINTS:
- UK bank holiday likely to result in lower trading volumes on Monday
- GBP Tech setups ahead of major risk events: GBP/USD, EUR/GBP
- Major risk events: EU Core inflation then US consumer confidence, PMIs and NFP

SLUGGISH STERLING START’S THE WEEK ON A QUIET NOTE
Bank holiday (UK) Monday saw a relatively muted start to the week for the Pound, as expected.
On the travel front, the UK has added 7 more countries to the ‘green list’ meaning that travellers coming from these countries back to the UK will not need to quarantine regardless of vaccination status. However, travel to and from other ‘amber’ or ‘red lists’ continue to elevate travel costs as Covid tests are required and in some cases expensive quarantine stays at government-approved hotels are mandatory.
GBP KEY TECHNICAL LEVELS FOR THE WEEK AHEAD
A slower start to the week is not always a bad thing as it allows time to consider potential setups that could play out once London traders return to their desks.
The GBP/USD daily chart shows prices hovering at similar levels to Friday’s closing candle. The pair experienced short-lived volatility during Jerome Powell’s speech at the Jackson Hole Economic Symposium where he mentioned that bond and asset purchases could be reduced before the end of the year.
The pair looks set to continue trading sideways, at least in the early stages of the week, as GBP drivers remain subdued. As the week progresses, significant risk events will become clearer with the US data heavy week coming to a close on Friday with the NFP print.
Any continued bullish momentum off the back of Friday would need to clear the 1.3780 level of resistance before the 1.3920 zone of resistance comes into play. However, a pullback from Friday’s impulsive move would focus on the 1.3670 level with the 23.6% Fib level around 1.3580 the next potential level of support.
GBP/USD Daily Chart
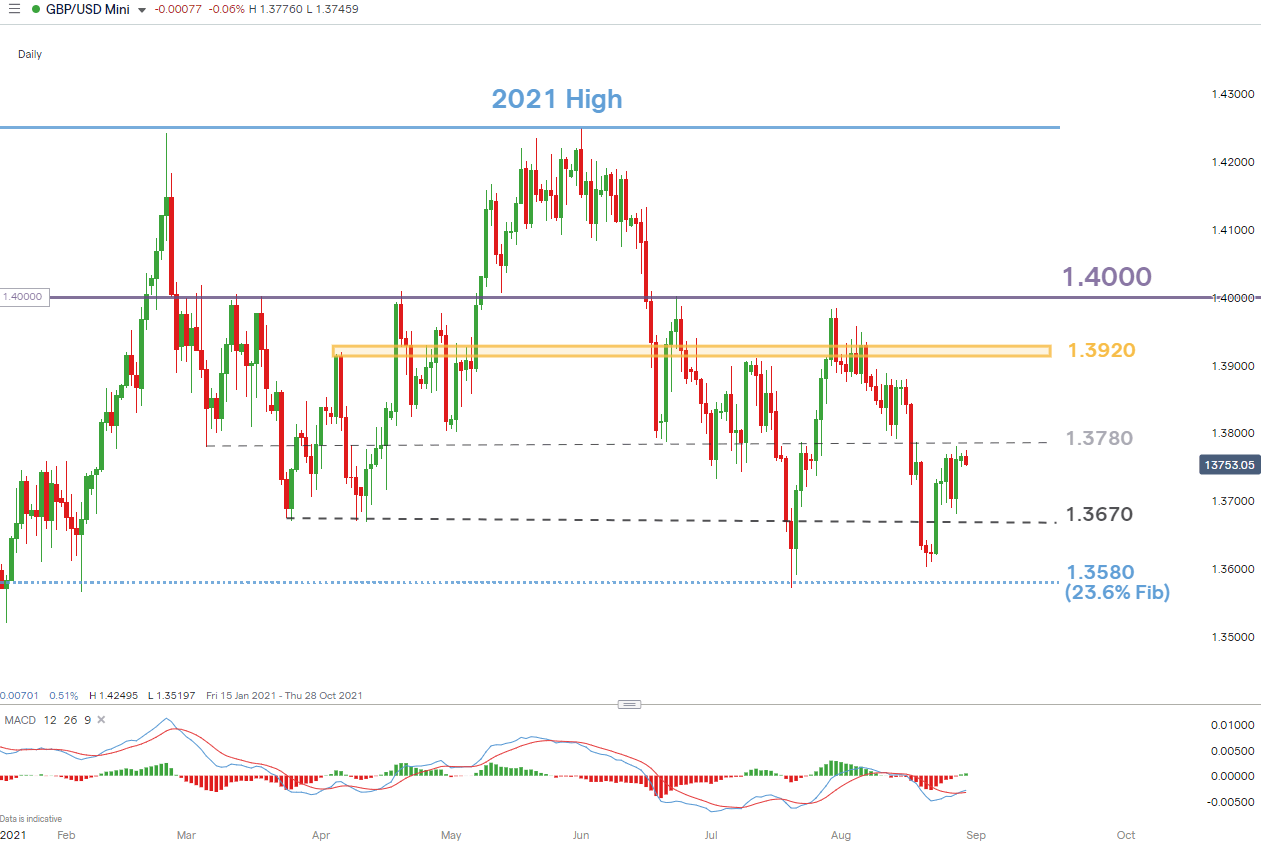
Chart prepared by Richard Snow, IG
Looking at the Euro vs the Pound we have witnessed higher price action after the bullish engulfing marked the recent lows in the pair. Since then, there appears to be a bullish pennant–like shape suggestive of a bullish continuation. In that case, be on the lookout for a break above the diverging trendlines towards the upside resistance of 0.8640 followed by 0.8720.
Read through our comprehensive Educational library for more information on the bullish engulfing candle pattern and others like it.
A failed break may lead to a continued period of sideways trading or possibly even another test of the low. Before that however, levels of support can be identified at 0.8540 before the resistance zone around the 0.8470 – 0.8500
EUR/GBP Daily Chart
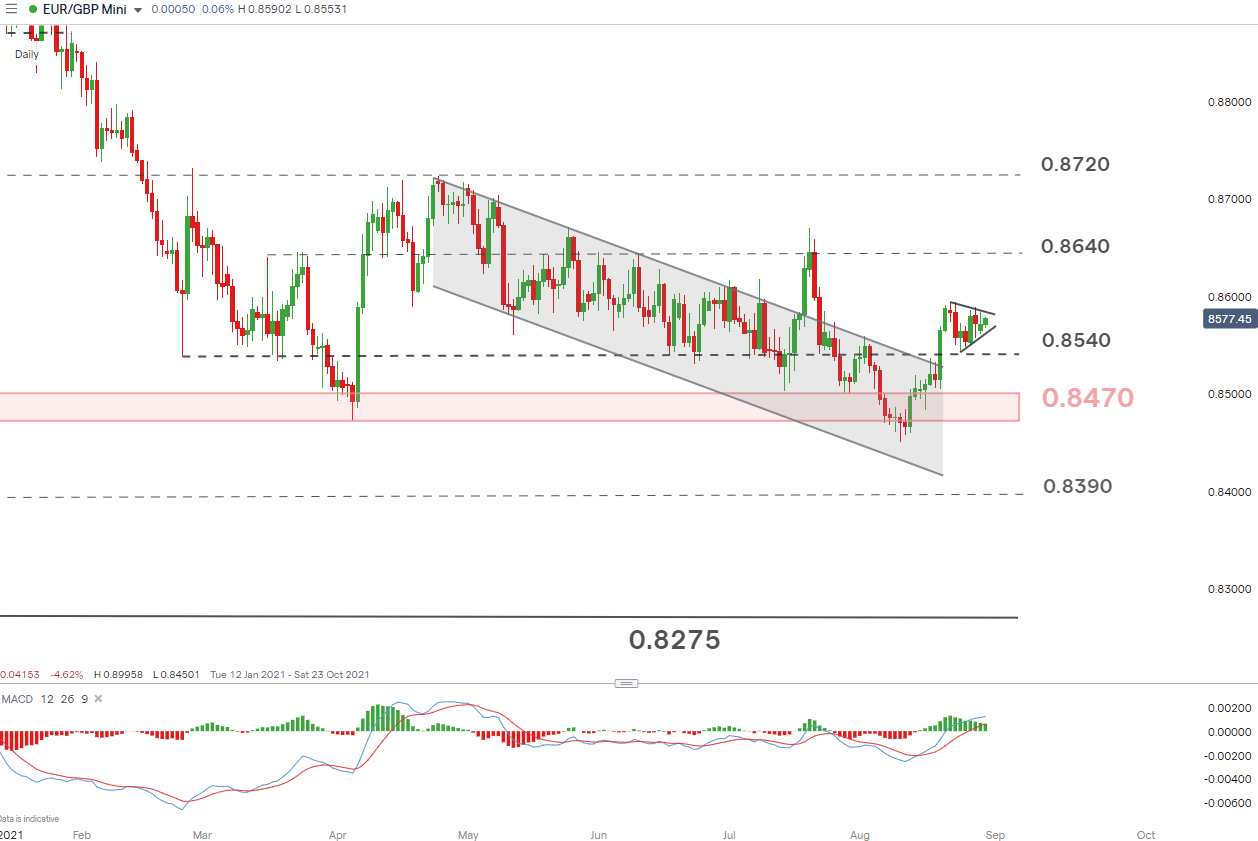
Chart prepared by Richard Snow, IG
US DOMINATES RISK EVENTS THIS WEEK
Non-US data: Eurozone sentiment (Monday), Eurozone CPI (Tuesday), Eurozone Unemployment (Wednesday)
US (High Impact) Risk Events:
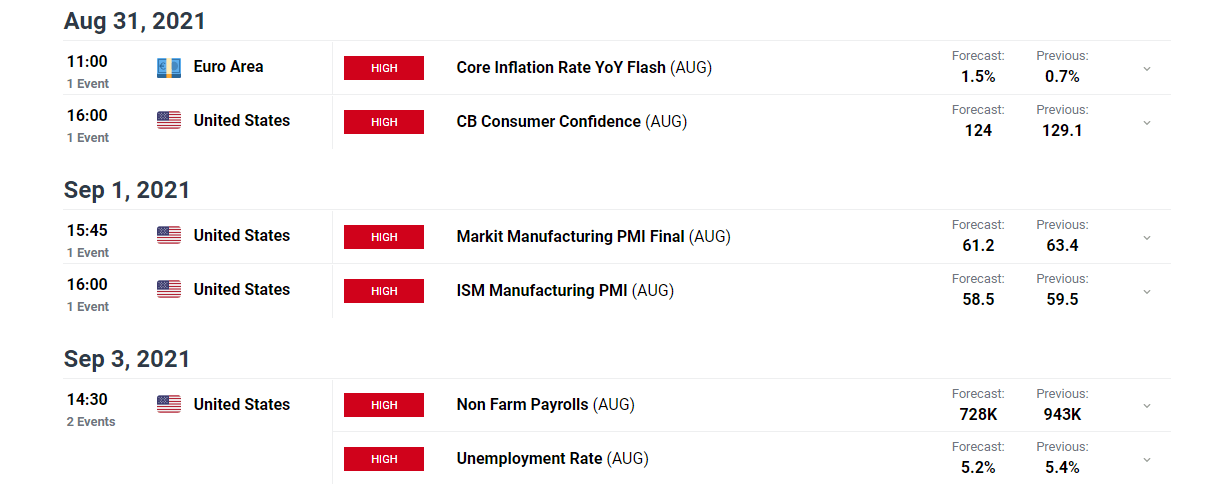
For all market-moving data releases and events see the DailyFX Economic Calendar
Written by Richard Snow for DailyFX.com. 30 August 2021.


0 Comments
Recommended Comments
There are no comments to display.
Create an account or sign in to comment
You need to be a member in order to leave a comment
Create an account
Sign up for a new account in our community. It's easy!
Register a new accountSign in
Already have an account? Sign in here.
Sign In Now