Fed and ECB Accommodative as Euro Opens Flat

Entry posted by MongiIG in Market News
518 views
EUR/USD PRICE ANALYSIS
- EUR/USD unchanged post-Jackson Hole.
- Euro tests key technical levels.
- IGCS undecided as traders are equally split.

EUR/USD FUNDAMENTAL BACKDROP
This week's open did not have the dramatic effect of prior Jackson Hole re-opens as markets remained relatively subdued after Fridays close. In conjunction with a bank holiday in the UK, which may be adding to the slump in volatility during early trading, the weekends highlight was Fed Chair Powell taking a dovish stance on tapering which will now be highly data dependent – this proving more dovish than other Fed officials. Inflation concerns was yet again pushed aside by Mr. Powell who reiterated that they likely transitory, while Friday’s core PCE figures coming in as expected did not little in support of hawks. The COVID-19 delta variant has been of great concern which endures at elevated levels thus supporting the Fed’s decision to hold-off on immediate tapering.
WORLD COVID-19 NEW CASES:
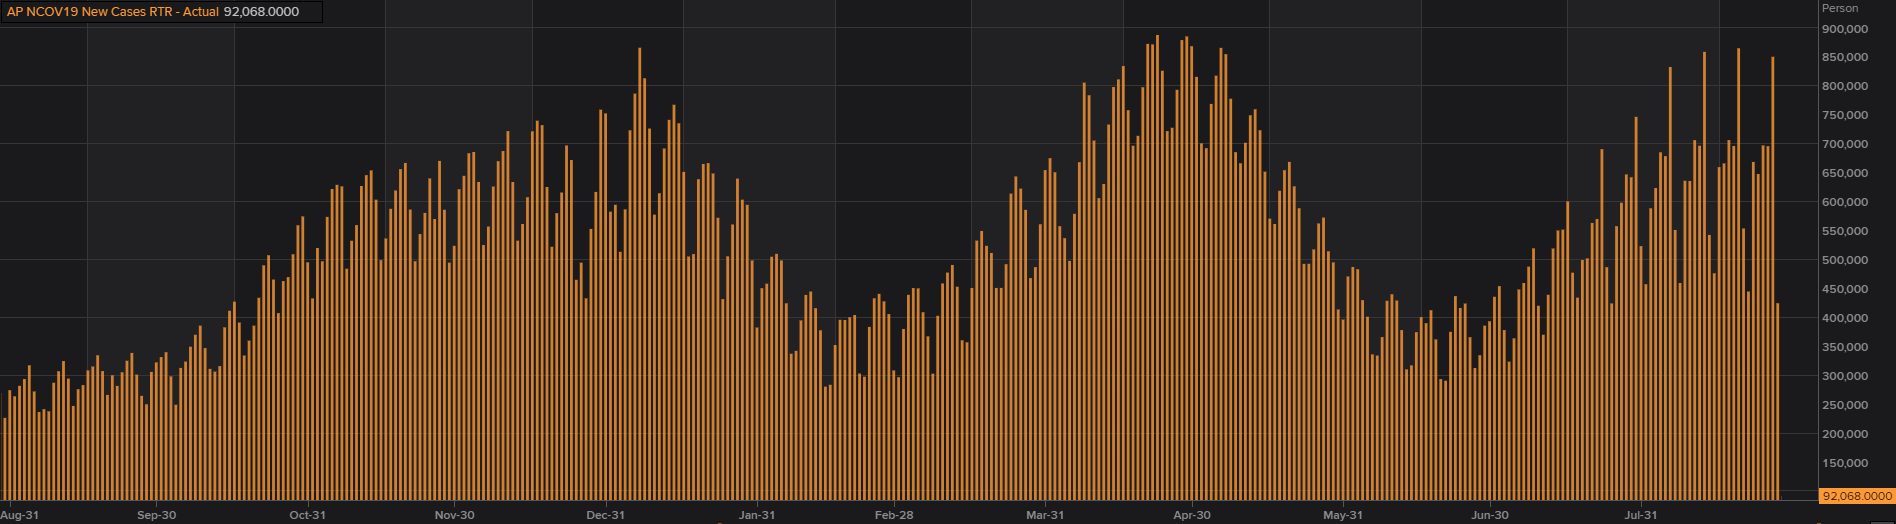
Source: Refinitiv
European consumer confidence for August was largely in line with estimates however, industrial sentiment did come in better than expected which relates to manufacturers confidence levels and makes up roughly 40% of the economic sentiment indicator.
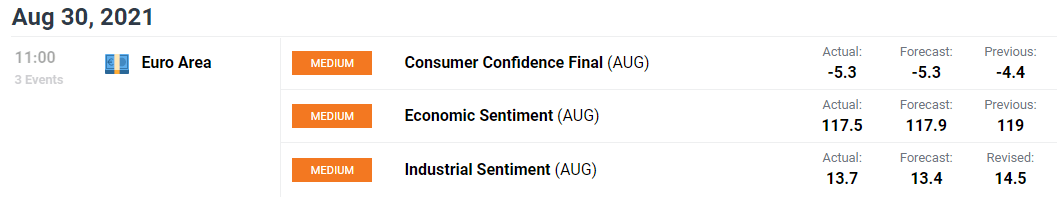
Source: DailyFX Economic Calendar
This week’s Non-Farm Payroll (NFP) data will be crucial to QE taper talk and could have a significant impact on the EUR/USD pair should actual data vary from estimates. Later today German inflation (see calendar below) will be in the spotlight as a precursor to broader Euro core inflation figures expected tomorrow.
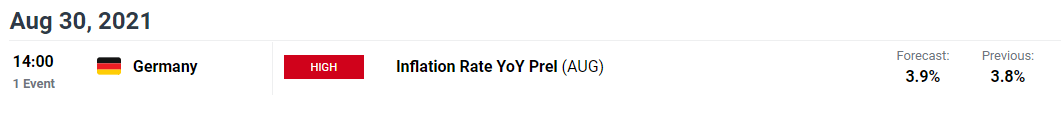
Source: DailyFX Economic Calendar
From the ECB perspective, Bank of France Head Francois Villeroy de Galhau stated that low interest rates will persist and that no signs of PEPP taper talk in the upcoming September meeting. Analysts were keeping a close eye on the divergence between the Federal Reserve and ECB in terms of taper talk but with Powell taking the aforementioned dovish stance, this is yet to martialize. It is apparent that the Fed will begin QE tapering before the ECB but timing and structure is key. Once additional detailed guidelines are revealed only then will markets have a clearer directional bias going forward.
Visit the DailyFX Educational Center to discover why news events are Key to Forex Fundamental Analysis
EUR/USD TECHNICAL ANALYSIS
EUR/USD Daily Chart:
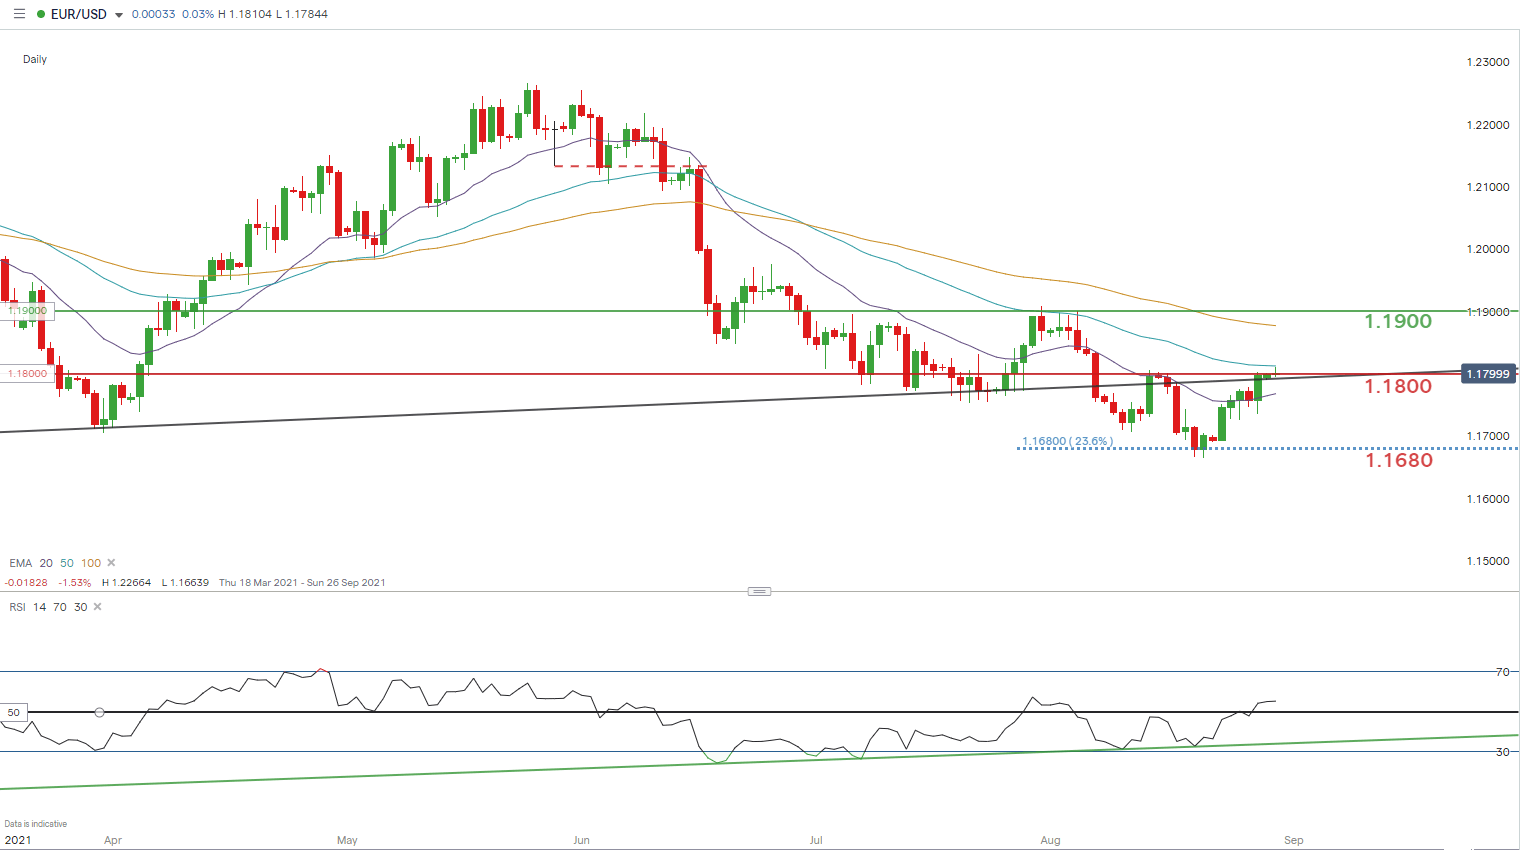
Chart prepared by Warren Venketas, IG
While the macroeconomic factors take a back seat ahead of Friday’s unemployment data, technical’s are expected to take the helm. The psychological level at 1.1800 is being tested and could prove significant should prices close above this area of confluence. The recovery off August lows around the 23.6% Fibonacci level (1.1680) has been strong as the dollar faded. There could be a consolidation (sideways move) this week as traders await key economic data. Short-term trading may be favored during this period as levels are likely to fluctuate between the 20-day (purple) and 50-day (blue) EMA’s – barring no surprise macroeconomic announcements. A break above or below these short-term support and resistance zones could open up room for price action to retest August lows (1.1680) and highs (1.1900) respectively.
The medium-term support trendline (black) has also been breached above for the first time since mid-August and should the pair keep its head above this support trendline, 1.1900 looks highly likely.
The bullish divergence (green) exhibited by the , the Relative Strength Index (RSI) has unfolded expectedly as the oscillator moves its way above the midpoint 50 level suggestive of bullish momentum.
IG CLIENT SENTIMENT DATA FAVORS NEITHER BULLS NOR BEARS
IGCS shows retail traders are currently distinctly short on EUR/USD, with 51% of traders currently holding short positions (as of this writing). At DailyFX we typically take a contrarian view to crowd sentiment however, because the difference is marginal the short-term signal remains mixed.

Written by Warren Venketas for DailyFX.com. 30 August 2021.


.jpeg.98f0cfe51803b4af23bc6b06b29ba6ff.jpeg)

0 Comments
Recommended Comments
There are no comments to display.
Create an account or sign in to comment
You need to be a member in order to leave a comment
Create an account
Sign up for a new account in our community. It's easy!
Register a new accountSign in
Already have an account? Sign in here.
Sign In Now