Jump to content

​​​​​​​​​​​​AUD/NZD likely to resume selloff as RBA slows tapering timeline​​​​​​​​​​​​


MongiIG

1,456 views

AUD/NZD looking set for further downside, with RBA stretching out tapering timelines as vaccination rates lag behind New Zealand.

BG_aus_australian_dollar_781781871.pngSource: Bloomberg
 
 Joshua Mahony | Senior Market Analyst, London | Publication date: Tuesday 07 September 2021. IG

New Zealand to ramp up vaccination efforts

Australia and New Zealand have taken a somewhat questionable approach to this pandemic, with the positives of keeping cases down counteracted by the lack of any notable vaccination programme.

That decision to hold off on a widespread vaccination programme from the start raises the risk of continued lockdowns in response to relatively low numbers. The ability to raise protection is going to be crucial in a bid to stave off lockdowns and thus push onto a path of higher rates and strong economic growth.

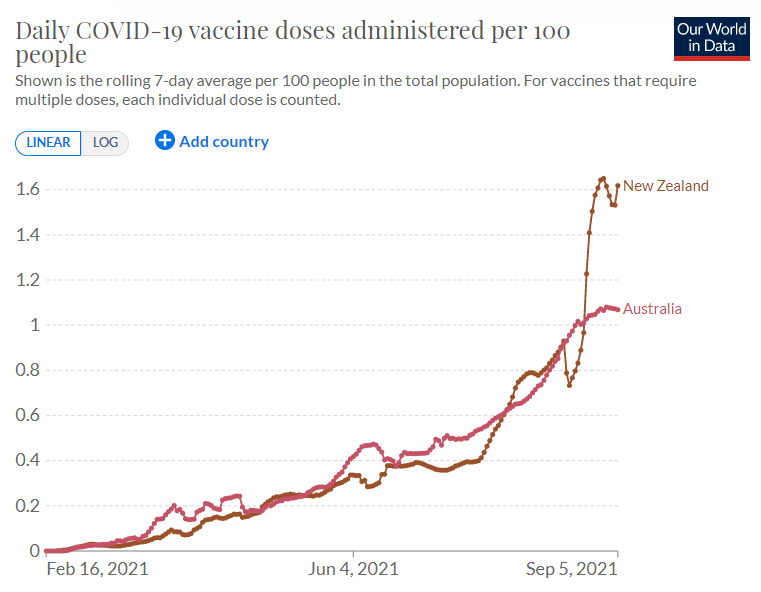
With that in mind, the efforts in New Zealand are impressive, with daily vaccinations surging over the past month.

AUD_NZD_Vaccine_daily_rates.pngSource: Our World in Data


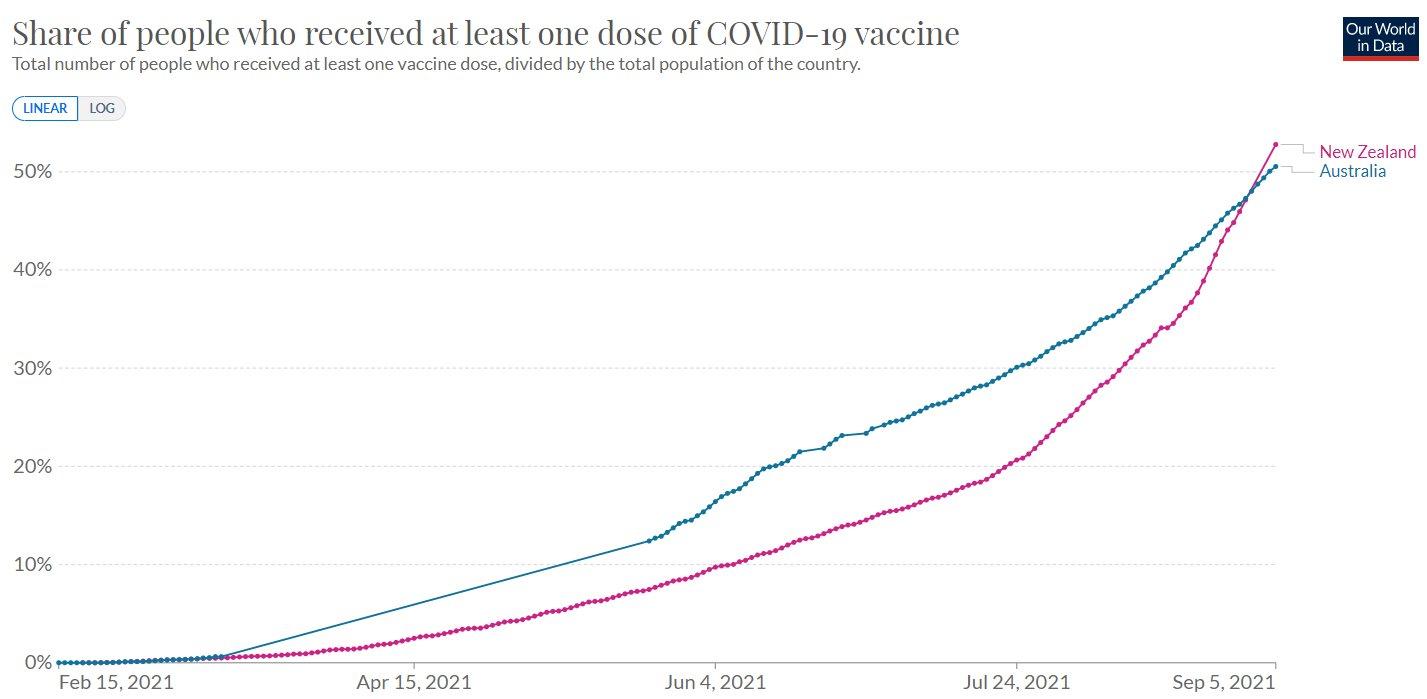
That recent vaccination drive has seen New Zealand overtake Australia in total vaccine protection, with the gap likely to grow given the daily rate of jabs seen above.

AUD_NZD_Vax_rates.jpegSource: Our World in Data


The Reserve Bank of Australia's (RBA) meeting overnight provided a somewhat mixed tone from the bank, with their plan to go ahead and taper from $5 billion to $4 billion also counteracted by a delay to any further steps. That shift sees the bank project that their next move could come in February rather than November as previously stated.

The AUD/NZD pair has understandably moved lower following that dovish shift, with the downtrend looking likely to kick back in. That plays into expectations that New Zealand will continue to vaccinate at a faster rate, which should also see a relatively more hawkish Reserve Bank of New Zealand (RBNZ).

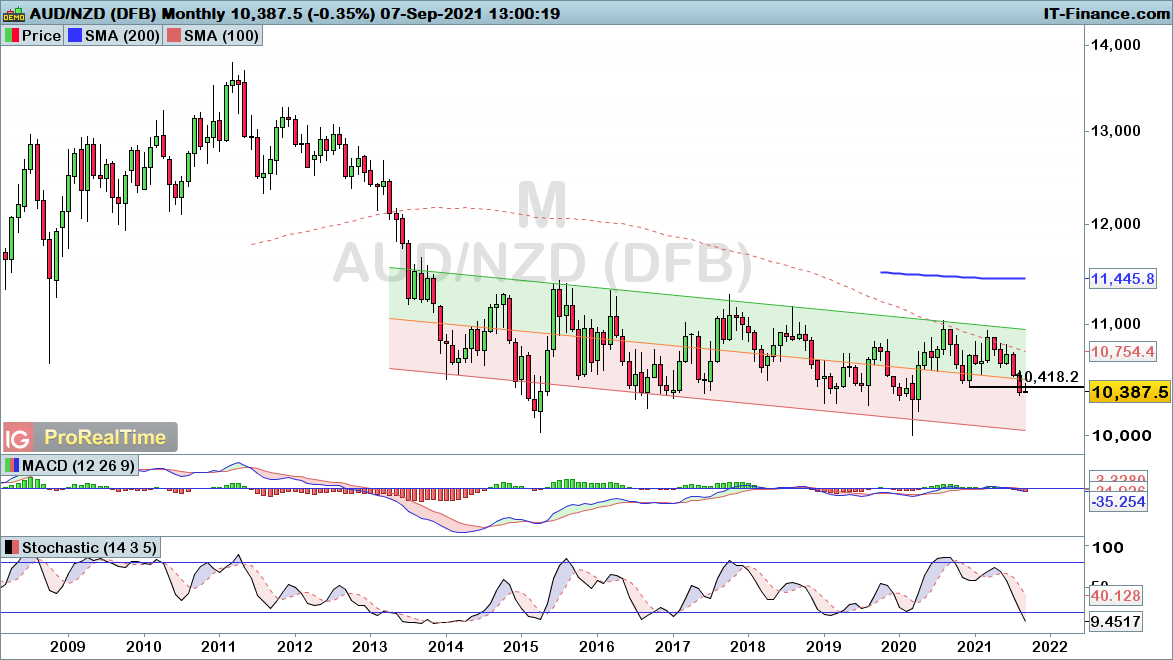
The chart below highlights how AUD/NZD is coming off the back of a period of weakness that has seen four of five months post significant downside. Notably, we have also seen price drop below 1.0418, bringing a double top formation into play.

AUDNZD-Monthly7921.pngSource: ProRealTime


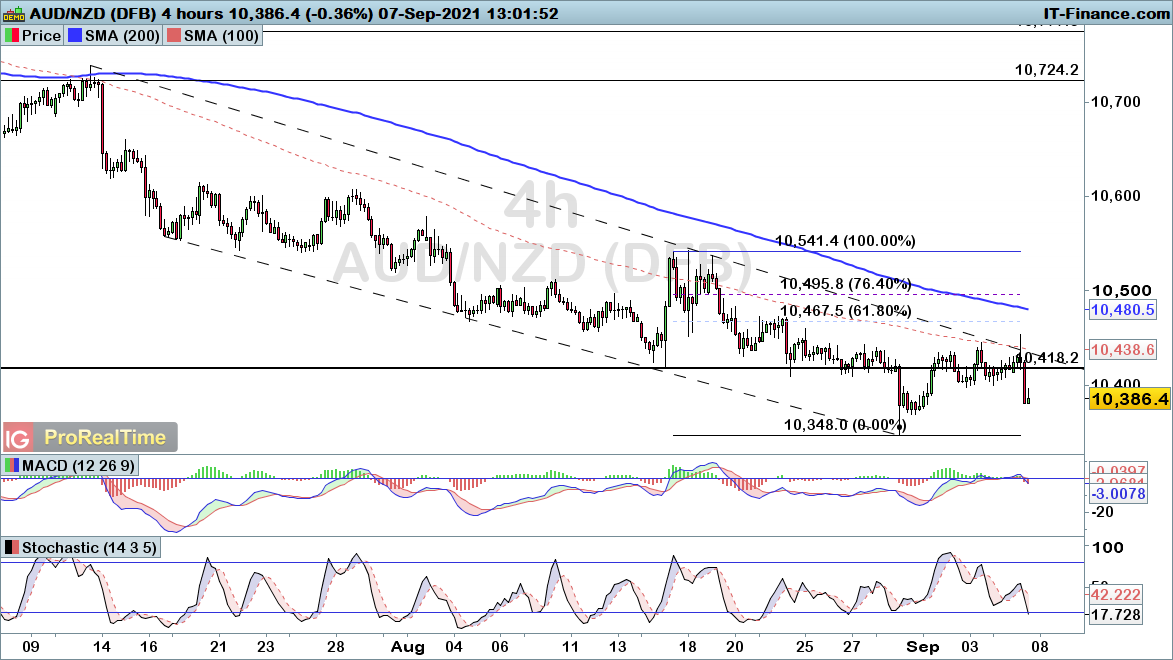
With the long-term downtrend in play here, there is a good chance we are set for further weakness. The intraday downtrend remains in play here, with the weakness seen today bringing a bearish continuation signal.

With that in mind, a bearish outlook holds for AUD/NZD, with a break up through 1.0541 bringing about a more positive outlook for the pair.

AUDNZD-4-hours7921.pngSource: ProRealTime

0 Comments


Recommended Comments

There are no comments to display.

Create an account or sign in to comment

You need to be a member in order to leave a comment

Create an account

Sign up for a new account in our community. It's easy!

Register a new account

Sign in

Already have an account? Sign in here.

Sign In Now
  • Blog Statistics

    • Total Blogs
      3
    • Total Entries
      2,822
  • Latest Forum Topics

  • Our picks

    • International Workers' Day & Early May Trading Hours
      Please be advised that our opening hours will be adjusted on 1 May 2024 for International Workers’ Day and 6 May 2024 for the UK Early May Bank Holiday. Where appropriate, the times listed are in GMT.
    • Are these the best AI stocks to watch in May 2024?
      Microsoft, Apple, Nvidia, Amazon and Meta could be the best AI stocks to watch next month. These stocks are the largest AI stocks in the US based on market capitalisation.
    • Natural Gas Commodity Elliottwave Technical Analysis
      Natural Gas


      Mode - Impulsive 


      Structure - Impulse Wave 


      Position - Wave (iii) of 5


      Direction - Wave (iii) of 5 still in play


      Details:  Price now in wave iii as it attempts to breach 1.65 wave i low. Wave (iii) is still expected to extend lower in an impulse.


      Natural Gas is currently breaching the previous April low, marking a decisive move as the impulse initiated on 5th March continues its downward trajectory, further extending the overarching impulse wave sequence that commenced back in August 2022. This decline is anticipated to persist as long as the price remains below the critical resistance level of 2.012.


      Zooming in on the daily chart, we observe the medium-term impulse wave originating from August 2022, which is persisting in its downward trend after completing its 4th wave - delineated as primary wave 4 in blue (circled) - at 3.666 in October 2023. Presently, the 5th wave, identified as primary blue wave 5, is underway, manifesting as an impulse at the intermediate degree in red. It is envisaged that the price will breach the February 2024 low of 1.533 as wave 5 of (3) seeks culmination before an anticipated rebound in wave (4). This confluence of price movements underscores the bearish sentiment prevailing over Natural Gas in the medium term.


      Analyzing the H4 chart, we initiated the impulse wave count for wave (3) from the level of 2.012, which marks the termination point of wave 4. Notably, price action formed a 1-2-1-2 structure, with confirmation established at 1.65 and invalidation set at 2.012. The confirmation of our anticipated direction materialized as price breached the 1.65 mark, signifying a resumption of bearish momentum. Presently, there appears to be minimal resistance hindering the bears, thereby reinstating their dominance in the market. It is projected that wave iii of (iii) of 5 will manifest around 1.43, indicative of the potential for the wave 5 low to extend to 1.3 or even lower. This comprehensive analysis underscores the prevailing bearish outlook for Natural Gas in the immediate future.


      Technical Analyst : Sanmi Adeagbo
       
        • Like
×
×
  • Create New...
us