Bank of Japan (BoJ) preview: Monetary policy to hold steady

Entry posted by MongiIG in Market News
627 views
The Bank of Japan is set to hold their monetary meeting across 21 – 22 September 2021, as markets have their eyes on Japan’s ruling party leadership race.
 Source: Bloomberg
BoJ meeting expected to deliver little surprise
The BoJ monetary meeting next week may be expected to deliver little surprise, with the next outlook report to come only in the October meeting. Consensus expectations continue to point towards the BoJ keeping in place its target of -0.1% for short-term rates and 0% for the 10-year bond yield, under its policy of negative interest rate policy (NIRP) and yield curve control (YCC).
With elevated Covid-19 cases in the summer break, expected uplift in consumer spending based on pent-up demand did not materialise in August. Latest manufacturing PMI saw a tick lower to 52.7 from previous 53.0, while services PMI saw a deeper plunge into contractionary territory at 42.9. Both are largely by-products of supply chain disruptions and Covid-19 resurgences in the region, which may be highlighted by the BoJ next week as downside risks to economic growth. Therefore, the central bank may refrain from any premature policy tightening, suggesting that accommodative policies are likely to remain for an extended period.
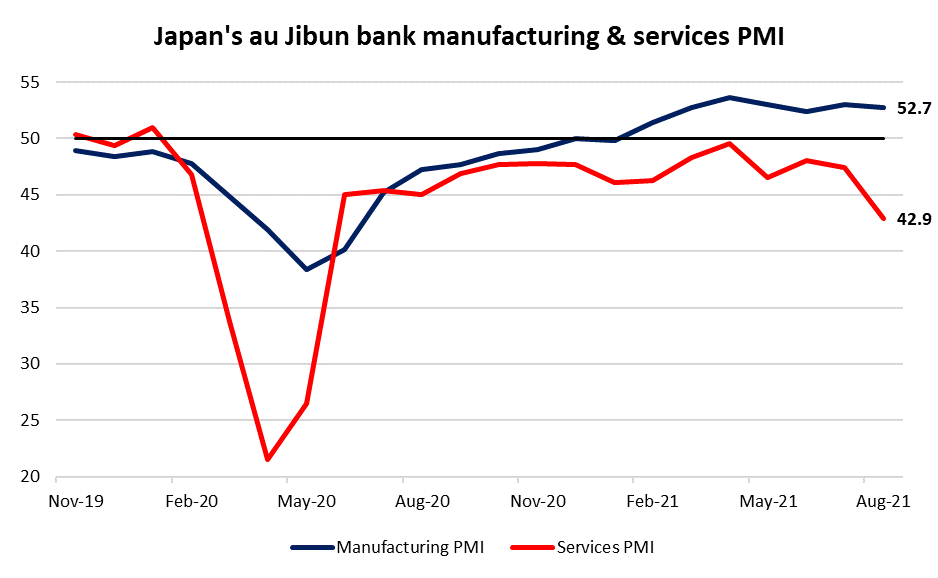
Source: au Jibun Bank/IHS Markit
That said, with falling Covid-19 cases and an improving vaccination rate over the past weeks, plans to loosen its virus restrictions are in the pipeline. The BoJ is likely to reiterate their expectations that economic recovery will pick up pace once Covid-19 risks abate, underpinned by accommodative financial conditions and an expected increase in business fixed investments. That will leave any further easing unwarranted for now. Inflationary pressures are also of least concern to drive any action from the central bank. The latest core CPI in July registered -0.2% year-on-year, a far cry from its inflation target of 2%, and is not expected to reach the target before 2023.
As the ruling party's leadership vote looms, all three contenders have floated expectations of an economic stimulus package. Current accommodative monetary policies are expected to complement the more expansive fiscal policy to come, as highlighted by BoJ Governor Haruhiko Kuroda. Its stance on ETF purchases may also remain for now, having adopted a more flexible framework in March to ensure sustainability in its monetary easing.
Japan 225 index nearing key resistance
The Japan 225 index has broken above the upper trendline of its descending triangle pattern back in early September, signalling a shift in sentiments to the upside. Near-term price action seems to trade within an ascending channel pattern, with the key resistance level at 30,700 next to watch. Currently, the index is being supported by the lower trendline of the channel pattern at the 30,200 level, which also coincides with a previous resistance-turned-support horizontal level.
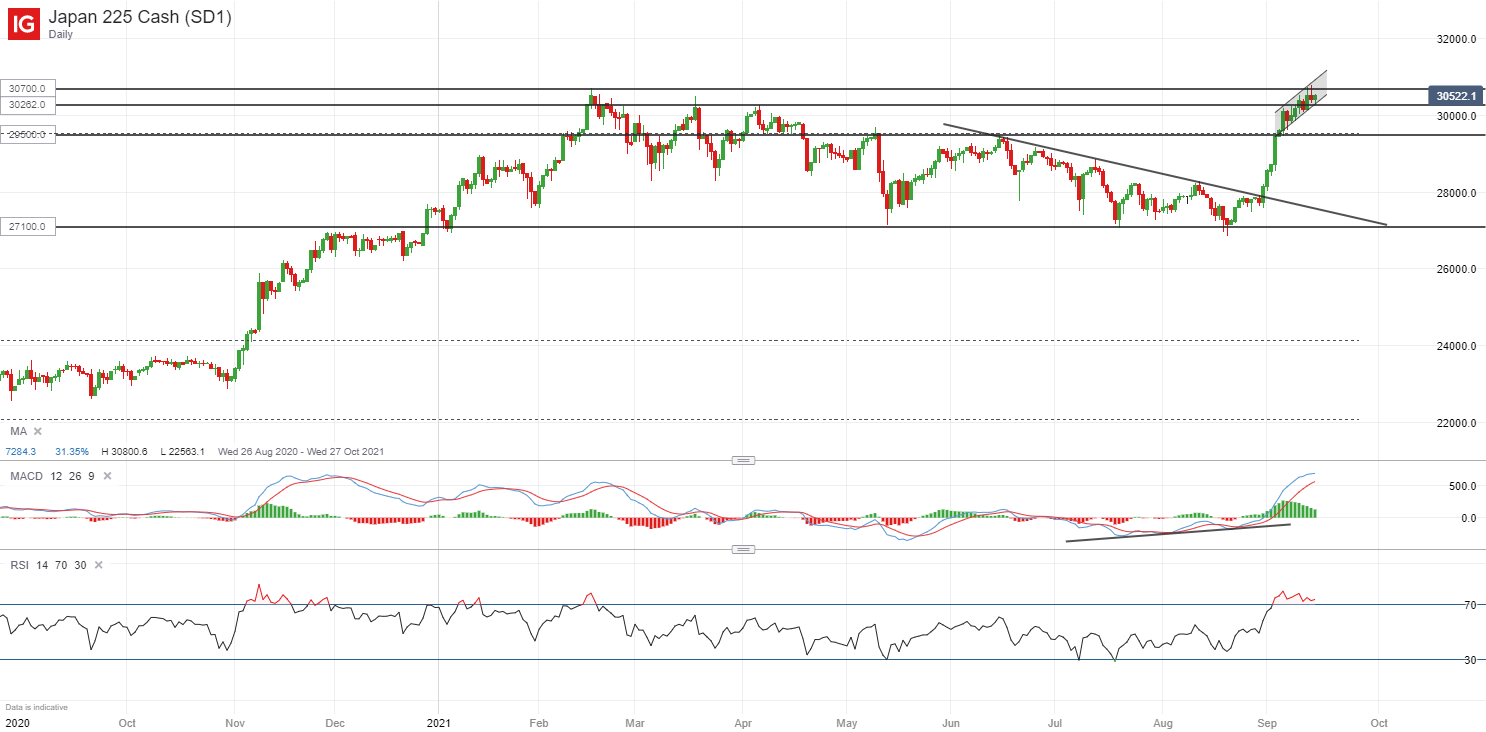
Source: IG charts
USD/JPY largely range-bound
On the four-hour chart, the USD/JPY has been range-bound over the past month, currently trading near the lower base of a rectangle pattern at 109.53. This level also coincides with the Fibonacci 23.6% retracement level, reinforcing it as a line of support. Near-term, the currency pair has broken below an upward trendline connecting higher lows. If the 109.53 level fails to hold, the pair may see a move lower to the 109.00 level next.
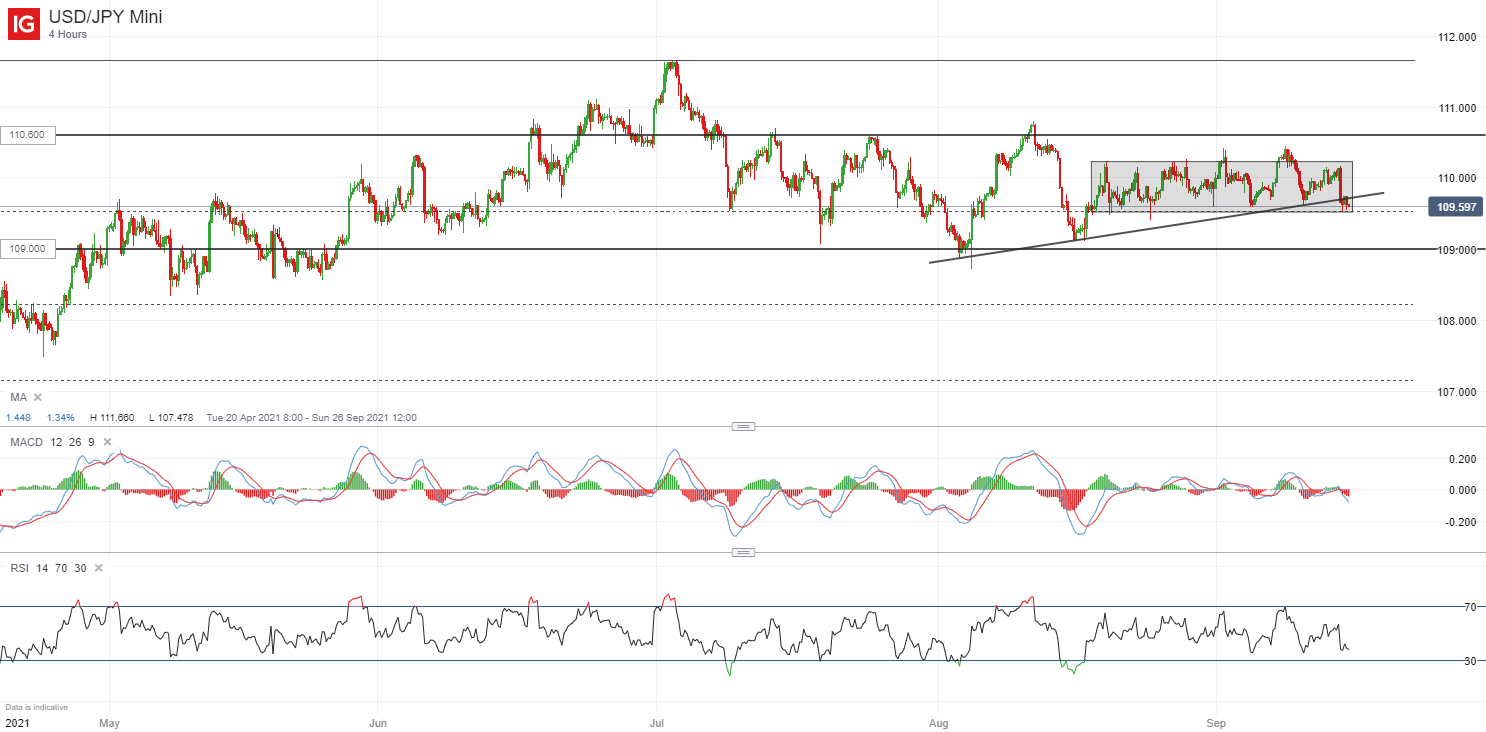
Source: IG charts


.jpeg.98f0cfe51803b4af23bc6b06b29ba6ff.jpeg)

0 Comments
Recommended Comments
There are no comments to display.
Create an account or sign in to comment
You need to be a member in order to leave a comment
Create an account
Sign up for a new account in our community. It's easy!
Register a new accountSign in
Already have an account? Sign in here.
Sign In Now