Jump to content

Dollar double bottom looks to bring potential long-term upside for DXY


MongiIG

760 views

The dollar has been on the rise as the Fed plots an increasingly hawkish path. With Powell stepping up once again, there is a good chance we could see months of dollar outperformance

BG_US_DOLLAR.JPGSource: Bloomberg
 Joshua Mahony | Senior Market Analyst, London | Publication date: Tuesday 28 September 2021. IG

Hawkish Fed stance builds case for dollar strength

Federal Reserve Chair, Jerome Powell, steps up to make yet another appearance today, following last week’s hugely significant Federal Open Market Committee (FOMC) meeting.

That meeting signalled a likely move to commence tapering in November, with the Federal Reserve (Fed) expected to start raising rates in 2022.

From a dollar perspective, the fact that the Fed appears to be leading from the front brings the potential for a carry trade to appear. Interestingly, the recent rise in 10-year treasury yields highlights a somewhat mixed relationship with the dollar. At times of economic crisis, the dollar haven role comes into play as treasury demand drives down yields.

However, the chart below highlights how we often see the two markets move in tandem. As such, the recent push higher for yields (driven in part by hawkish Fed comments) also drives up the dollar.
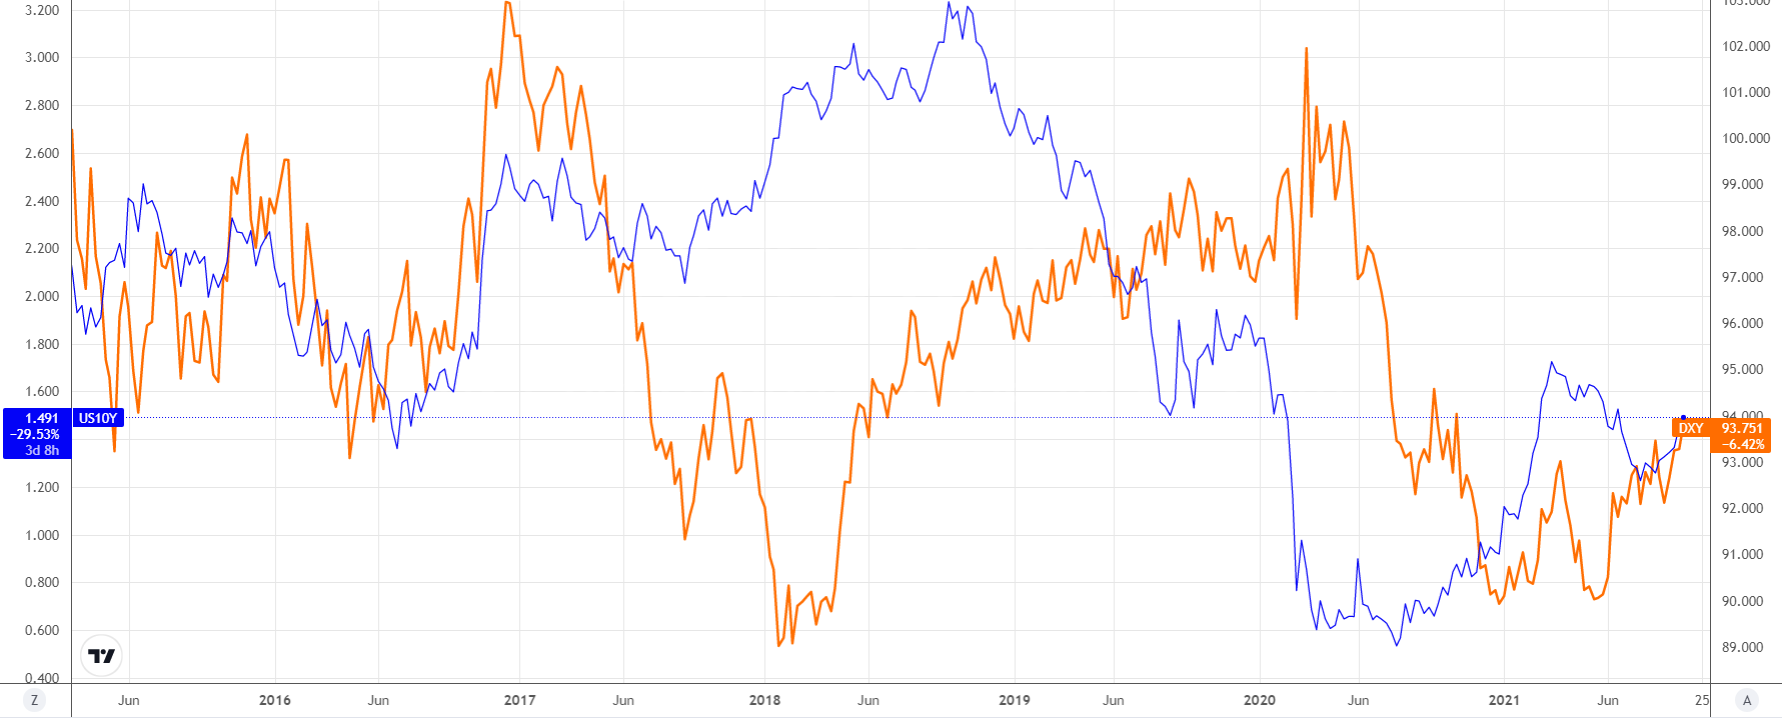
 

DXY_VS_YIELDS.pngSource: TradingView

Dollar index reaches crucial double bottom support

The dollar index has enjoyed a bullish four months, with the greenback pushing into a fresh 10-month high this week.

The recent drive through 93.47 brings a double bottom into play, highlighting the potential for a bullish breakout. The subsequent retracement looks to be over, with price back through the 93.73 resistance level today.

With Powell stepping up to provide yet another outlook this afternoon, there is a chance we will see another leg higher for the dollar if he reiterates last week’s comments.
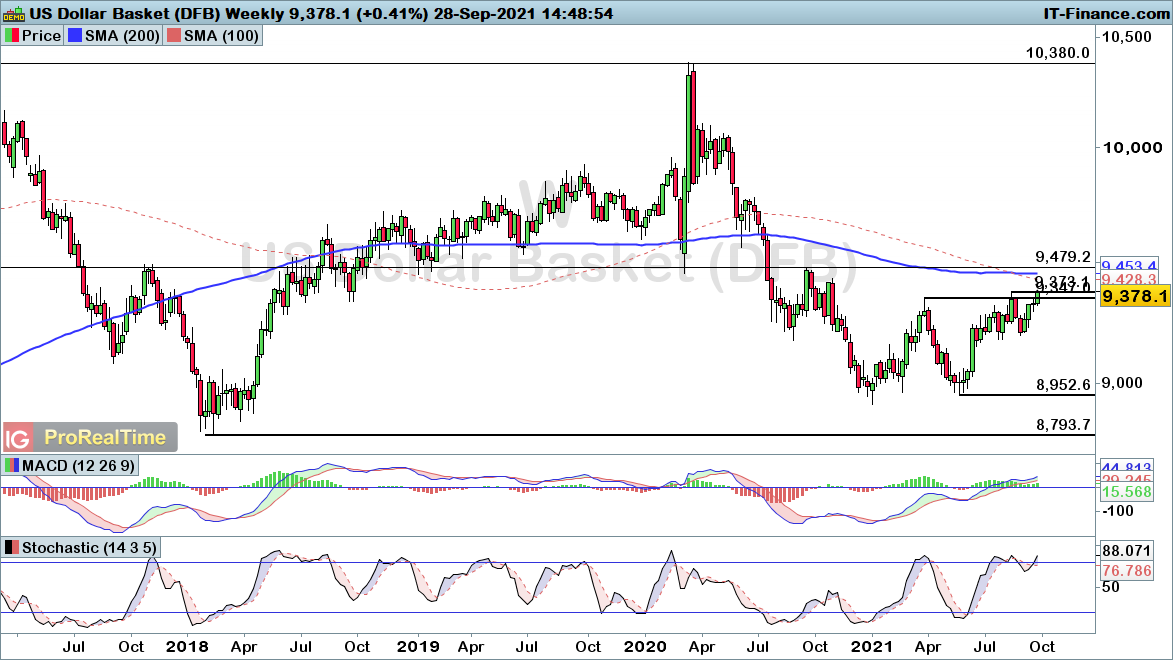
DX-Weekly28921.pngSource: ProRealTime


The intraday charts highlight this recent outperformance, with the latest drive higher bringing fresh long-term highs.

This push through resistance provides us with a fresh bullish outlook, with a break below 92.96 required to negate that positive dollar view.
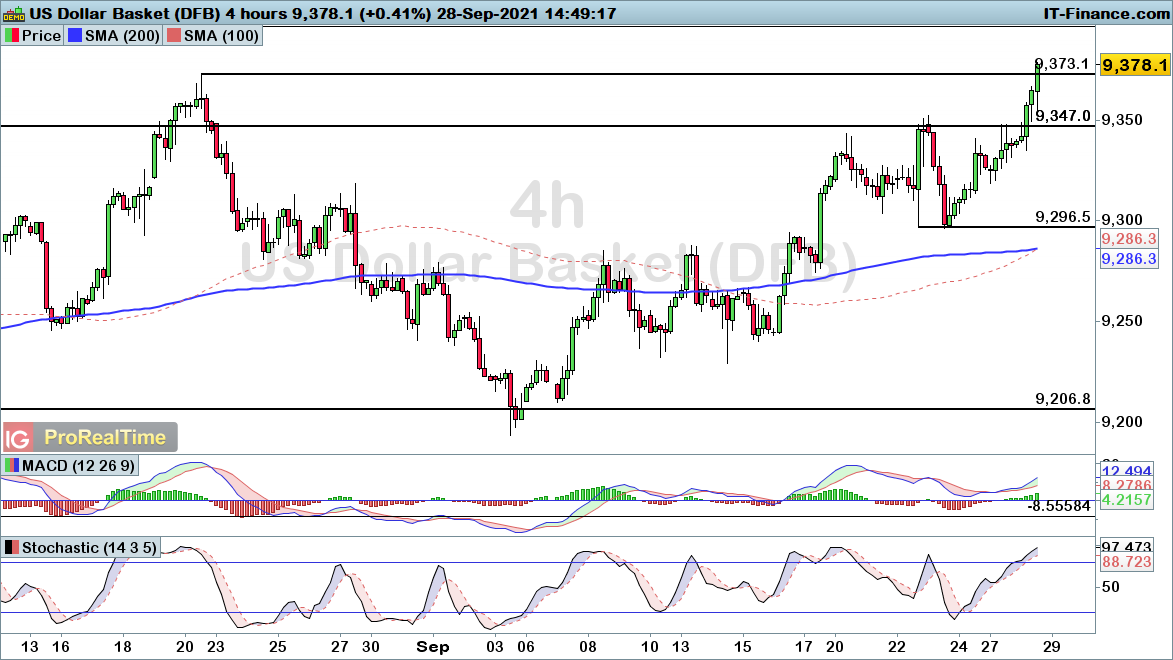
DX-4-hours28921.pngSource: ProRealTime

0 Comments


Recommended Comments

There are no comments to display.

Create an account or sign in to comment

You need to be a member in order to leave a comment

Create an account

Sign up for a new account in our community. It's easy!

Register a new account

Sign in

Already have an account? Sign in here.

Sign In Now
  • Blog Statistics

    • Total Blogs
      3
    • Total Entries
      2,822
  • Latest Forum Topics

  • Our picks

    • International Workers' Day & Early May Trading Hours
      Please be advised that our opening hours will be adjusted on 1 May 2024 for International Workers’ Day and 6 May 2024 for the UK Early May Bank Holiday. Where appropriate, the times listed are in GMT.
        • Like
    • Are these the best AI stocks to watch in May 2024?
      Microsoft, Apple, Nvidia, Amazon and Meta could be the best AI stocks to watch next month. These stocks are the largest AI stocks in the US based on market capitalisation.
    • Natural Gas Commodity Elliottwave Technical Analysis
      Natural Gas


      Mode - Impulsive 


      Structure - Impulse Wave 


      Position - Wave (iii) of 5


      Direction - Wave (iii) of 5 still in play


      Details:  Price now in wave iii as it attempts to breach 1.65 wave i low. Wave (iii) is still expected to extend lower in an impulse.


      Natural Gas is currently breaching the previous April low, marking a decisive move as the impulse initiated on 5th March continues its downward trajectory, further extending the overarching impulse wave sequence that commenced back in August 2022. This decline is anticipated to persist as long as the price remains below the critical resistance level of 2.012.


      Zooming in on the daily chart, we observe the medium-term impulse wave originating from August 2022, which is persisting in its downward trend after completing its 4th wave - delineated as primary wave 4 in blue (circled) - at 3.666 in October 2023. Presently, the 5th wave, identified as primary blue wave 5, is underway, manifesting as an impulse at the intermediate degree in red. It is envisaged that the price will breach the February 2024 low of 1.533 as wave 5 of (3) seeks culmination before an anticipated rebound in wave (4). This confluence of price movements underscores the bearish sentiment prevailing over Natural Gas in the medium term.


      Analyzing the H4 chart, we initiated the impulse wave count for wave (3) from the level of 2.012, which marks the termination point of wave 4. Notably, price action formed a 1-2-1-2 structure, with confirmation established at 1.65 and invalidation set at 2.012. The confirmation of our anticipated direction materialized as price breached the 1.65 mark, signifying a resumption of bearish momentum. Presently, there appears to be minimal resistance hindering the bears, thereby reinstating their dominance in the market. It is projected that wave iii of (iii) of 5 will manifest around 1.43, indicative of the potential for the wave 5 low to extend to 1.3 or even lower. This comprehensive analysis underscores the prevailing bearish outlook for Natural Gas in the immediate future.


      Technical Analyst : Sanmi Adeagbo
       
        • Like
×
×
  • Create New...
us