Jump to content

British Pound (GBP) Price Outlook: GBP/JPY Closes in on Major Resistance Levels


MongiIG

626 views

GBP PRICE, NEWS AND ANALYSIS:

  • The strong move higher in GBP/JPY, that has taken it from a recent low at 148.96 on September 21 to above 1.55 currently, is now facing stiff resistance that will have to be overcome if the trend is to continue.
  • Even if it can break through the 1.5611 high recorded on May 27, there is further resistance at the 156.62 high recorded on February 2, 2018.

Forex - GBP/JPY down during the Asian session By Investing.com


GBP/JPY FACING KEY TEST

The strength of the recent advance in GBP/JPY is facing a key test at the 1.5611 high recorded on May 27 and it will likely pause at that level as traders decide whether to keep buying the pair. If it does break through, GBP will be at its highest level since early 2018.

Moreover, a further advance above the 156.62 high recorded in February that year would take GBP to its highest against JPY for more than five years, as shown on the weekly chart below.

GBP/JPY PRICE CHART, WEEKLY TIMEFRAME (JANUARY 18, 2016 - OCTOBER 14, 2021)

Latest GBP/JPY price chart.

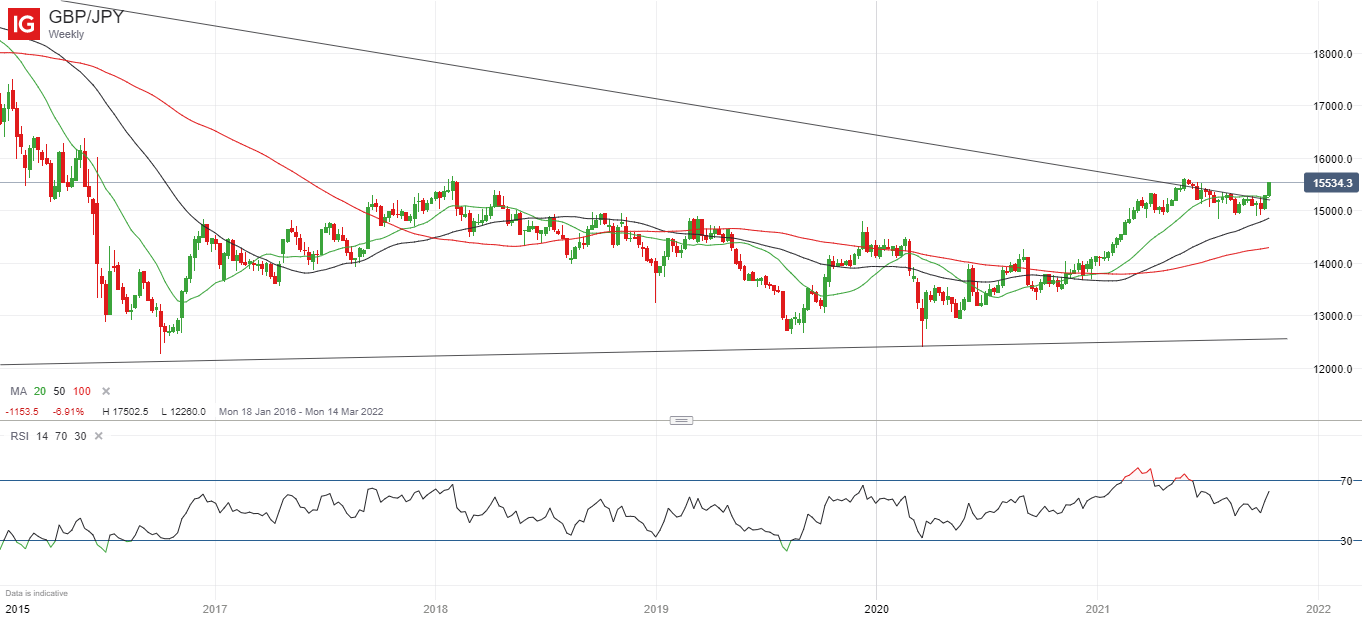
Source: IG (You can click on it for a larger image)


On the GBP side of the equation, the Pound is benefiting from suggestions that the Bank of England could be the second major central bank, after only New Zealand, to tighten monetary policy in the current cycle. On the JPY side, Bank of Japan Policy Board member Noguchi Asahi said Thursday that he ruled out withdrawing stimulus even after the Japanese economy recovers from the hit caused by the Covid-19 pandemic.

That should keep the upward trend in GBP/JPY going longer-term, but the resistance levels mentioned earlier will likely cause at least a temporary barrier first.

BULLISH SIGNAL FROM POSITIONING DATA

As for sentiment, IG client figures show that 27.15% of traders using the company’s platforms are net-long, with the ratio of traders short to long at 2.68 to 1. The number of traders net-long is 0.49% higher than yesterday but 13.50% lower than last week, while the number of traders net-short is 2.42% higher than yesterday and 33.50% higher than last week.

Here at DailyFX, we typically take a contrarian view to crowd sentiment, and the fact traders are net-short suggests GBP/JPY prices may continue to rise. Moreover, traders are further net-short than yesterday and last week, and the combination of current sentiment and recent changes gives us a stronger GBP/JPY-bullish contrarian trading bias.


Written by Martin Essex, Analyst, 14th October 2021. DailyFX

0 Comments


Recommended Comments

There are no comments to display.

Create an account or sign in to comment

You need to be a member in order to leave a comment

Create an account

Sign up for a new account in our community. It's easy!

Register a new account

Sign in

Already have an account? Sign in here.

Sign In Now
  • Blog Statistics

    • Total Blogs
      3
    • Total Entries
      2,822
  • Latest Forum Topics

  • Our picks

    • International Workers' Day & Early May Trading Hours
      Please be advised that our opening hours will be adjusted on 1 May 2024 for International Workers’ Day and 6 May 2024 for the UK Early May Bank Holiday. Where appropriate, the times listed are in GMT.
    • Are these the best AI stocks to watch in May 2024?
      Microsoft, Apple, Nvidia, Amazon and Meta could be the best AI stocks to watch next month. These stocks are the largest AI stocks in the US based on market capitalisation.
    • Natural Gas Commodity Elliottwave Technical Analysis
      Natural Gas


      Mode - Impulsive 


      Structure - Impulse Wave 


      Position - Wave (iii) of 5


      Direction - Wave (iii) of 5 still in play


      Details:  Price now in wave iii as it attempts to breach 1.65 wave i low. Wave (iii) is still expected to extend lower in an impulse.


      Natural Gas is currently breaching the previous April low, marking a decisive move as the impulse initiated on 5th March continues its downward trajectory, further extending the overarching impulse wave sequence that commenced back in August 2022. This decline is anticipated to persist as long as the price remains below the critical resistance level of 2.012.


      Zooming in on the daily chart, we observe the medium-term impulse wave originating from August 2022, which is persisting in its downward trend after completing its 4th wave - delineated as primary wave 4 in blue (circled) - at 3.666 in October 2023. Presently, the 5th wave, identified as primary blue wave 5, is underway, manifesting as an impulse at the intermediate degree in red. It is envisaged that the price will breach the February 2024 low of 1.533 as wave 5 of (3) seeks culmination before an anticipated rebound in wave (4). This confluence of price movements underscores the bearish sentiment prevailing over Natural Gas in the medium term.


      Analyzing the H4 chart, we initiated the impulse wave count for wave (3) from the level of 2.012, which marks the termination point of wave 4. Notably, price action formed a 1-2-1-2 structure, with confirmation established at 1.65 and invalidation set at 2.012. The confirmation of our anticipated direction materialized as price breached the 1.65 mark, signifying a resumption of bearish momentum. Presently, there appears to be minimal resistance hindering the bears, thereby reinstating their dominance in the market. It is projected that wave iii of (iii) of 5 will manifest around 1.43, indicative of the potential for the wave 5 low to extend to 1.3 or even lower. This comprehensive analysis underscores the prevailing bearish outlook for Natural Gas in the immediate future.


      Technical Analyst : Sanmi Adeagbo
       
        • Like
×
×
  • Create New...
us