BoE rate hikes could bring big breakout for UK banking stocks

Entry posted by ArvinIG in Analyst Article
1,714 views
As the Bank of England prepare to raise rates, UK banking stocks look primed to finally break higher from the post-2009 downtrend.

Source: Bloomberg
Weekend commentary from Bank of England (BoE) Governor Andrew Bailey served to highlight just how close we could be to a rate hike at Threadneedle Street. With markets now pricing in a 82% chance of a 25 basis point (bp) rate rise in November, markets are increasingly steadfast in their view that the BoE will move next month.
The impact of Bailey’s appearance can be seen below, with implied bp jumping spiking over the weekend.
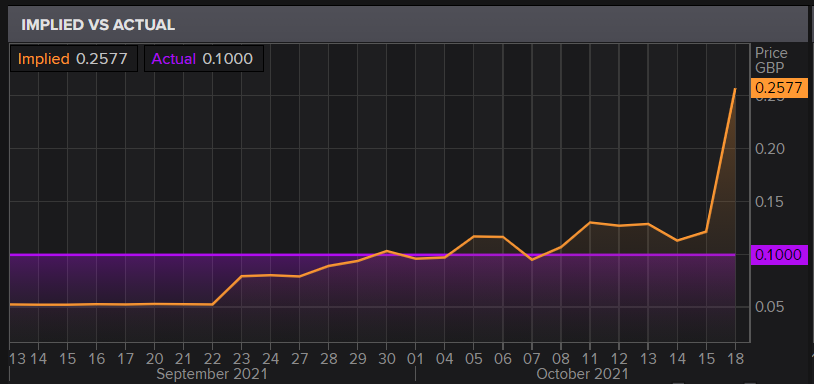
Source: Eikon
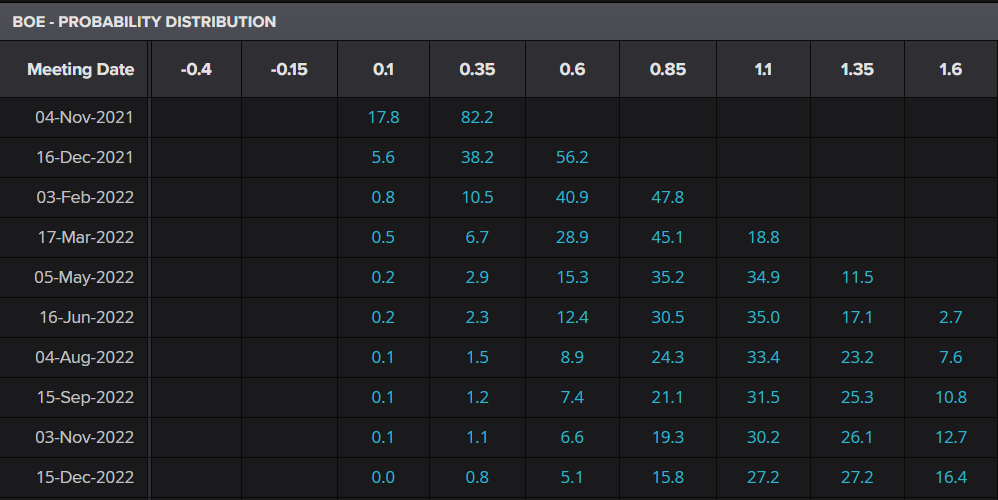
However, perhaps more importantly, we are looking at a potential series of hikes rather than simply a one-off move in November. Instead, markets are expecting rates to get back above 1% by June 2022. That means the potential for five or six 25 bp hikes within the next six meetings. Quite whether that comes to fruition remains to be seen.
However, it does provide an intriguing proposition for banks, with margins expected to improve markedly over the year ahead. UK banks have typically underperformed their US counterparts over the years, yet a push towards higher rates from the BoE certainly does provide speculation over whether there is better value form UK financials.
Source: Eikon
Inflation will be a critical factor for the interest rate outlook, with the latest UK consumer price index (CPI) figure bringing a welcome decline for both headline and core CPI. The prospect of a protracted push higher in rates will be driven by continued above-target inflation, and thus any sign that CPI has topped out could weaken the case for multiple hikes.
Nonetheless, with the prices being driven by a host of factors such as hiring difficulties, supply-chain struggles, and soaring input prices, there is a good chance we could see further price gains as Christmas and the winter period exacerbate these already troubling issues.
The outlook for banks will also rely on the perspective for economic growth, with some speculating that the recent rise in inflation and supply chain issues could hinder economic growth. Nonetheless, much of that economic difficulty will likely take the form of businesses failing to fully seize the opportunity provided by rising consumer demand.
Looking at UK 10-year treasury yields, we can see that rising confidence in higher rates and economic stability has pushed yields higher despite market volatility. The chart also highlights how UK-focused banks typically move in tandem with yields.
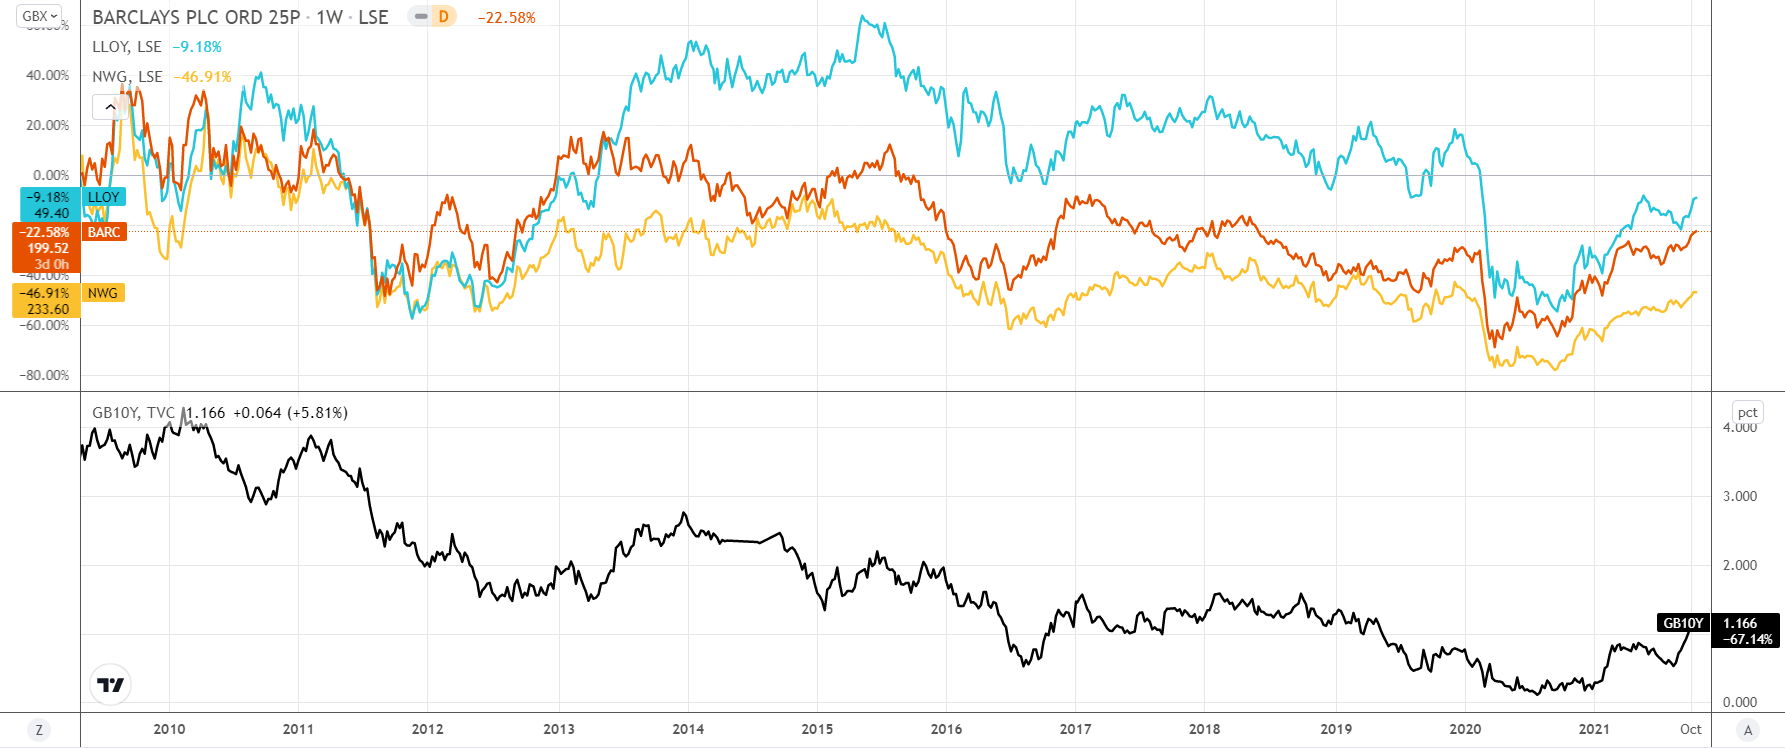
Source: TradingView
This wider perspective also shows how the downward trajectory in yields has brought a similar inability to break higher for banking stocks, with the prices creating lower highs as yields do the same. The risk here is that we could yet see yields roll over to create another lower high before long, bringing banking stocks down with it.
However, with inflation soaring, there is a question over whether yields could overcome their 2018 peak if the BoE raise rates above 0.75% (13-year highs). Such a move could help lift banking stocks out of their long-term downtrend.
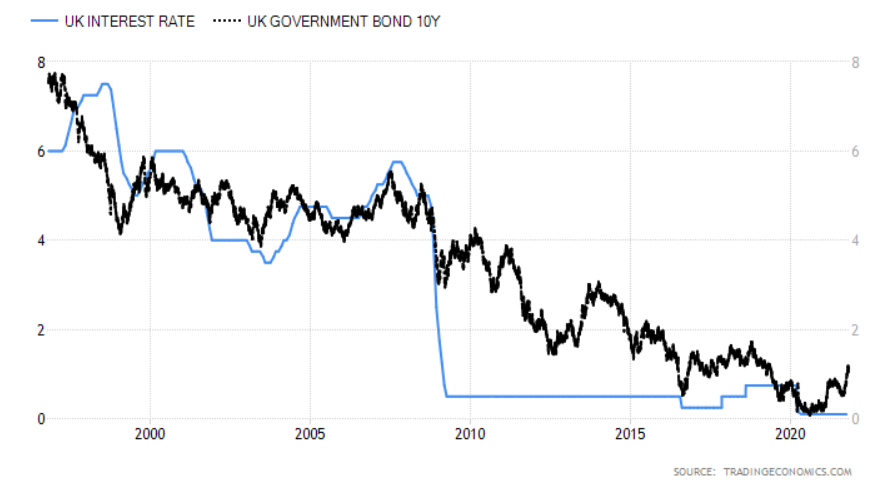
Source:Tradingeconomics
Barclays
Q3 Earnings - 21 October
Barclays are the leader of the pack, with the bank breaking up through the 2019 swing high of £1.78 back in March. We have subsequently seen the price push up into a fresh four-year high today, with the price pushing back towards the crucial 2017 peak of £2.08. We are certainly building a story that tells us of the potential for this stock to finally reverse its 14-year downtrend.
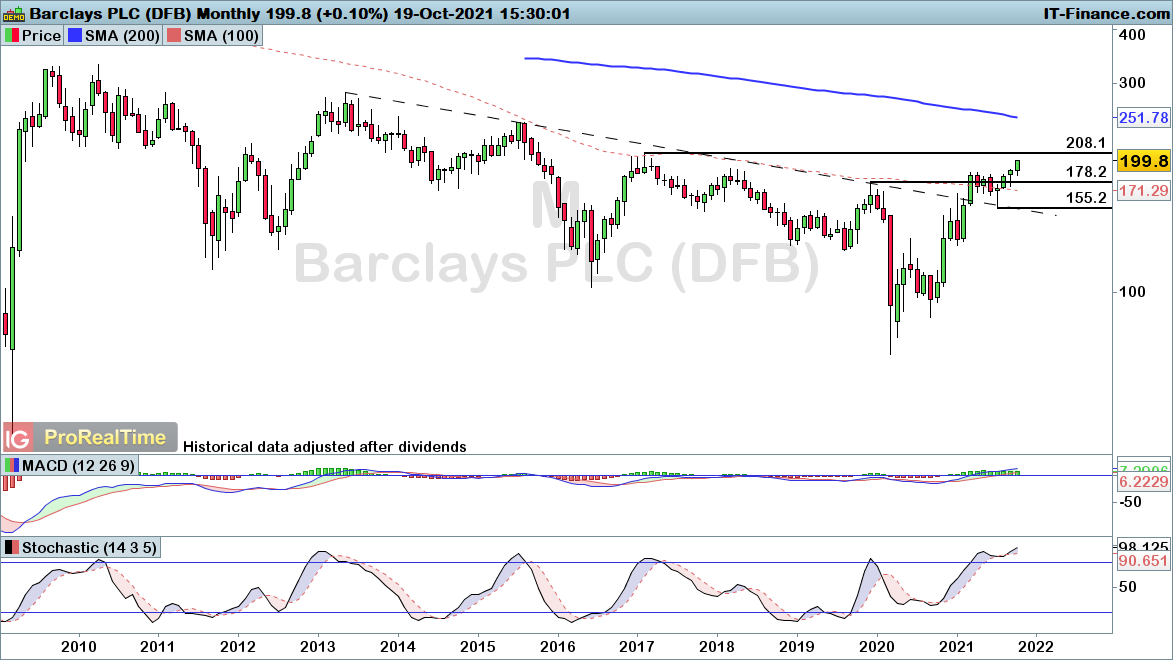
Source: ProRealTime
NatWest Group
Q3 earnings – 29 October
NatWest have struggled since the 2008 selloff, with the price trending lower after a somewhat lackluster 2009 rebound. The continued creation of lower highs comes into question as we close in on the £2.53 level. A break up through that 2018 high ends the downtrend, signalling the potential for another bout of gains in the years ahead.
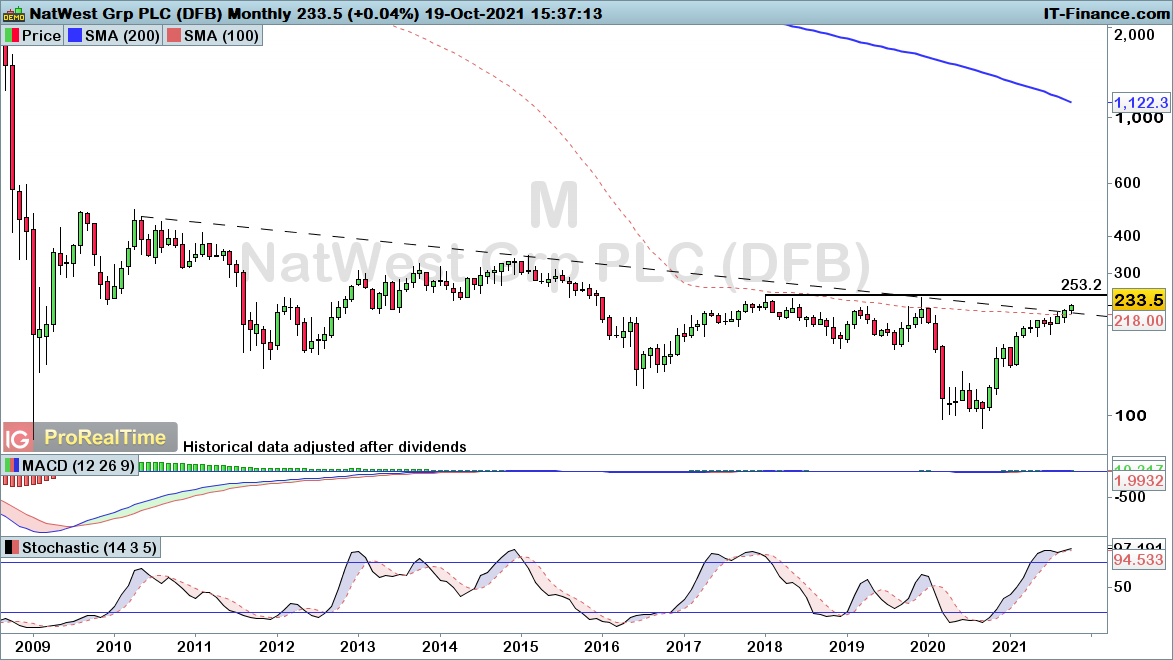
Source: ProRealTime
Lloyds Banking Group
Q3 IMS – 28 October
Lloyds also remains below its Covid-19 pre-pandemic levels, with the price yet to take on the 76.4% Fibonacci resistance level at 53p. However, we ultimately require a break up through 63p resistance to end this wider downtrend that has been play over the course of the past eight years. With the price taking on the 2021 high 50p coming back into play this week, a break up through that level should push us towards the next leg higher for this stock.
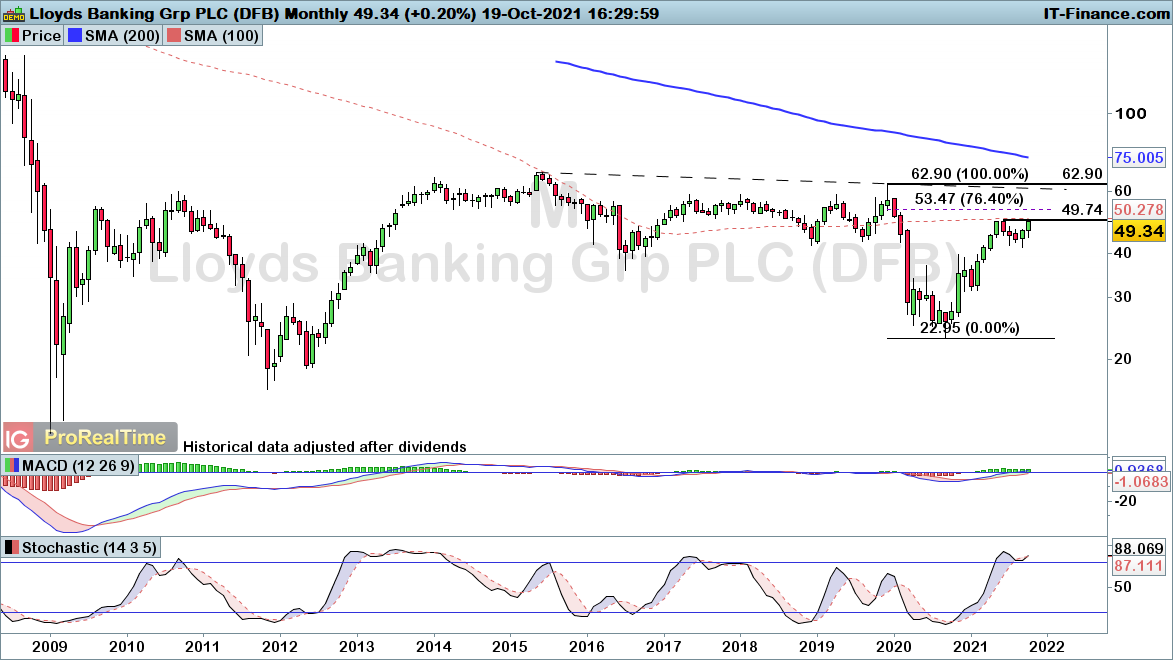
Source: ProRealTime


.jpeg.98f0cfe51803b4af23bc6b06b29ba6ff.jpeg)


0 Comments
Recommended Comments
There are no comments to display.
Create an account or sign in to comment
You need to be a member in order to leave a comment
Create an account
Sign up for a new account in our community. It's easy!
Register a new accountSign in
Already have an account? Sign in here.
Sign In Now