Bank of Japan (BoJ) preview: outlook report to provide fresh update

Entry posted by ArvinIG in Analyst article
324 views
The Bank of Japan is set to hold their monetary meeting across 27 – 28 October 2021, as markets look towards its outlook report for guidance.

Source : Bloomberg
BoJ meeting expected to keep policy on hold
The Bank of Japan (BoJ) monetary meeting this week will see the release of its outlook report, where updates on economic activities and prices will be observed. While Covid-19 risks are currently taking a backseat in Japan, supply constraints are putting a cap on production output for its export-reliant economy.
A plunge in autos shipments has led to a slowdown in export growth to 13.0% in September, down from 26.2% in August. With that, the central bank may refrain from any premature policy tightening, with accommodative policies to remain for the foreseeable future. Consensus expectations point towards the BoJ keeping in place its target of -0.1% for short-term rates and 0% for the 10-year bond yield.
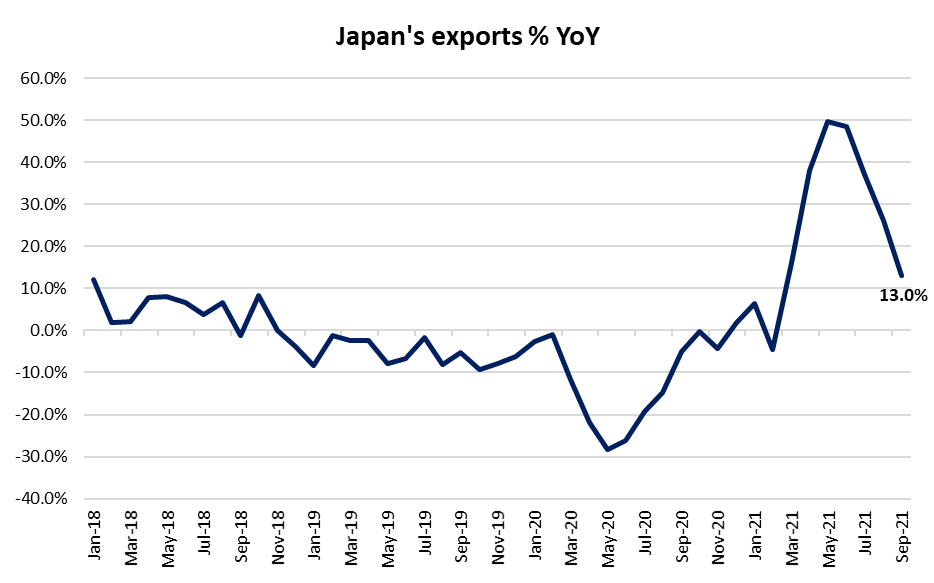
Source: Ministry of Finance, Japan
There have been some expectations for a downward revision in the growth outlook for fiscal year 2021 (FY 2021) to reflect the extended Covid-19 restrictions in September. That said, the BoJ will likely reiterate its stance of a delayed economic recovery, which could include an upward revision in growth forecast for FY 2022 onwards. This comes as Covid-19 restrictions are gradually eased and with close to 70% of its population being fully vaccinated, this suggests that the general direction points towards more reopening and could drive a rebound in retail sales towards the rest of the year.
In terms of inflation, Japan’s latest core consumer price inflation (CPI) in September has come in at 0.1% year-on-year (YoY). This marked its first increase in 18 months, as surging energy prices are bringing back price pressures for Japan. Previous BoJ forecasts suggest that core CPI may come in at 0.6% for FY 2021, 0.9% for FY 2022 and 1.0% in FY 2023. With its current 12-month average inflation only at -0.3%, a downward revision for FY 2021’s CPI forecast may be likely.
That said, recent months have revealed a wide divergence between its producer price index (PPI) and CPI. This could imply that as reopening takes place, some of these costs faced by producers could potentially be passed on to the consumers, lifting the CPI into FY 2022 onwards. While any upward revisions from current levels may still be some distance away from BoJ’s inflation target of 2% and is unlikely to shift monetary policy stance for now, any upside inflationary risks are still worth watching to drive a longer-term policy outlook.
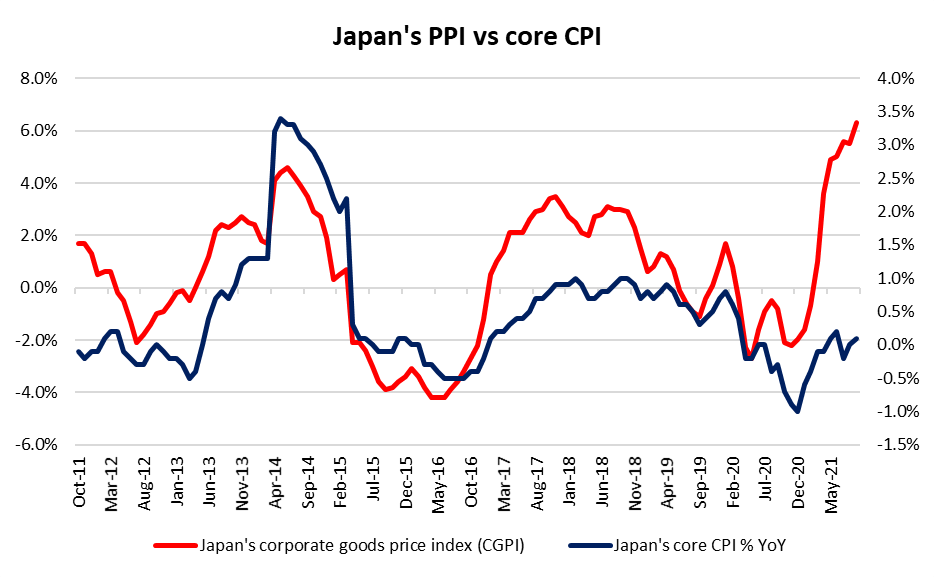
Source: Statistics Bureau of Japan
Japan 225 attempting to go higher
Amid the risk-on mood in global markets, the Japan 225 index has rebounded off its support at the 27,100 level. Recent higher highs and higher lows may suggest that the near-term uptrend remains intact. This may lead the index to retest the 29,500 level next, where a downward trendline may serve as resistance to overcome. Near-term support could potentially be at 28,400, where the level has supported prices on previous four occasions.
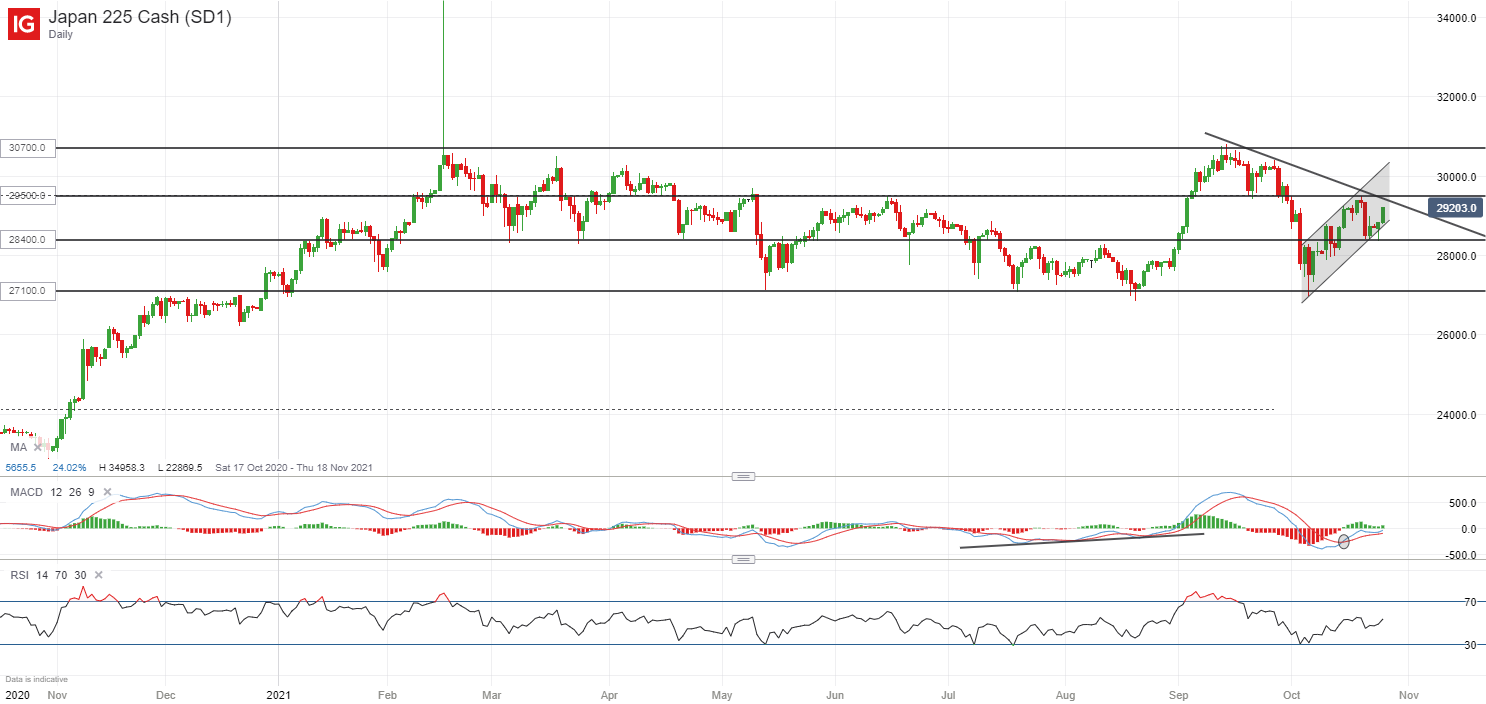
Source: IG charts
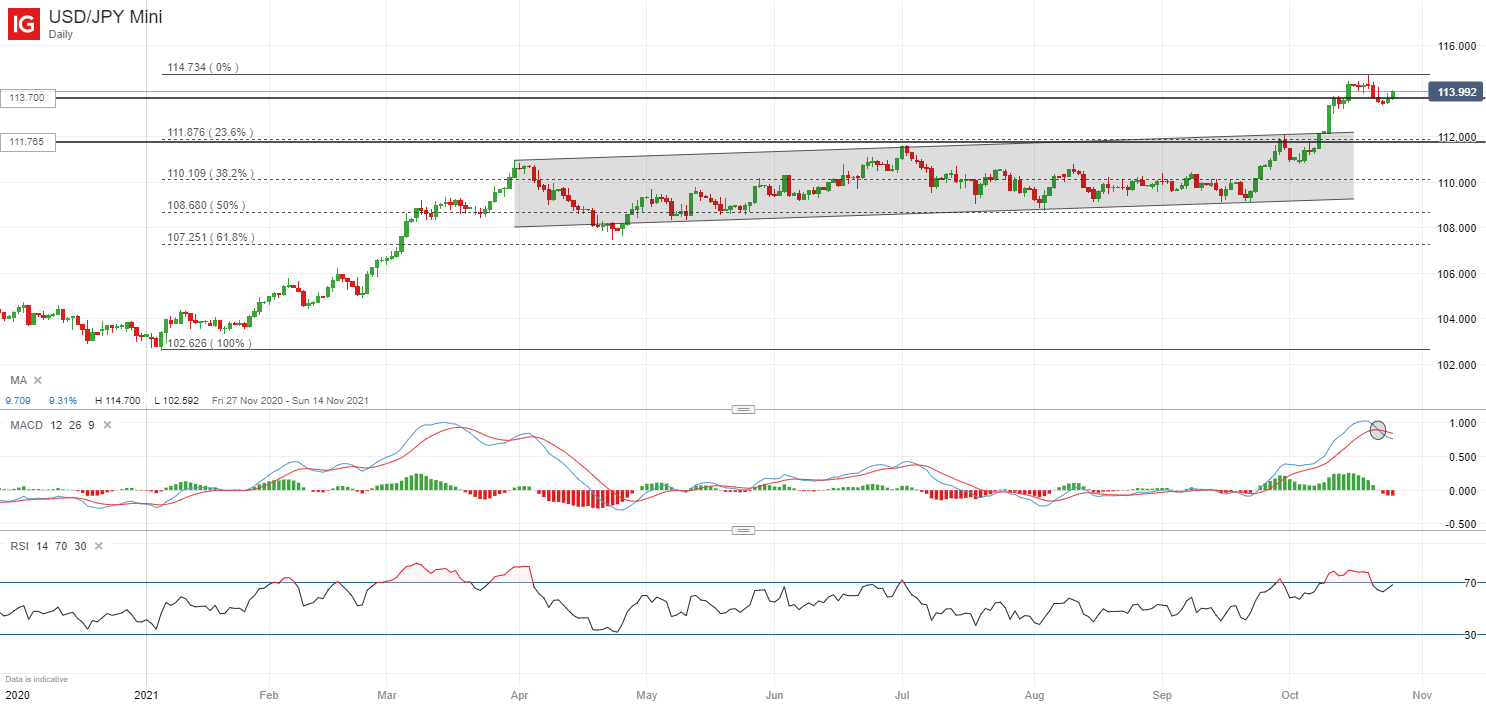
USD/JPY remains upside bias
The USD/JPY seems to be taking a breather after surging to its three-year high over the past weeks. The strength in the currency pair has been riding on the widening yield differential between the United States and Japan government bonds, largely a result of the divergence in policy stance between the BoJ and the Federal Reserve (Fed). The recent Commodity Futures Trading Commission (CFTC) non-commercial net positioning data continues to reveal a further push into net-short territory for the Japanese Yen, indicating further bearish bets.
Markets will be on watch for how the BoJ may address the ongoing weakness for the yen in the upcoming meeting. A no-action by the central bank may provide further strength for the USD/JPY with near-term support potentially at the 113.70 level.
26 October 2021


.jpeg.98f0cfe51803b4af23bc6b06b29ba6ff.jpeg)


0 Comments
Recommended Comments
There are no comments to display.
Create an account or sign in to comment
You need to be a member in order to leave a comment
Create an account
Sign up for a new account in our community. It's easy!
Register a new accountSign in
Already have an account? Sign in here.
Sign In Now