Jump to content

British Pound (GBP) Price Outlook: GBP/USD to Drift, UK Jobs Data Mixed


MongiIG

1,060 views

GBP PRICE, NEWS AND ANALYSIS:

  • GBP/USD will likely continue to trade close to the 1.32 level ahead of Thursday’s monetary policy announcement by the Bank of England, unaffected by the latest UK employment figures.
  • Those showed that 257,000 people were added to company payrolls last month, the most since records began in 2014.

British Pound (GBP) Price Outlook: GBP/USD to Drift, UK Jobs Data Mixed

GBP/USD TO DRIFT AHEAD OF BANK OF ENGLAND

GBP/USD will likely remain close to the 1.32 mark ahead of the Bank of England’s monetary policy announcement Thursday. With the Omicron coronavirus variant spreading in the UK, and new restrictions on the way, it now seems probable that the BoE will leave Bank Rate unchanged, rather than increasing it as had once seemed to be on the cards.

GBP/USD PRICE CHART, ONE-HOUR TIMEFRAME (NOVEMBER 26 – DECEMBER 14, 2021)

Latest GBP/USD price chart

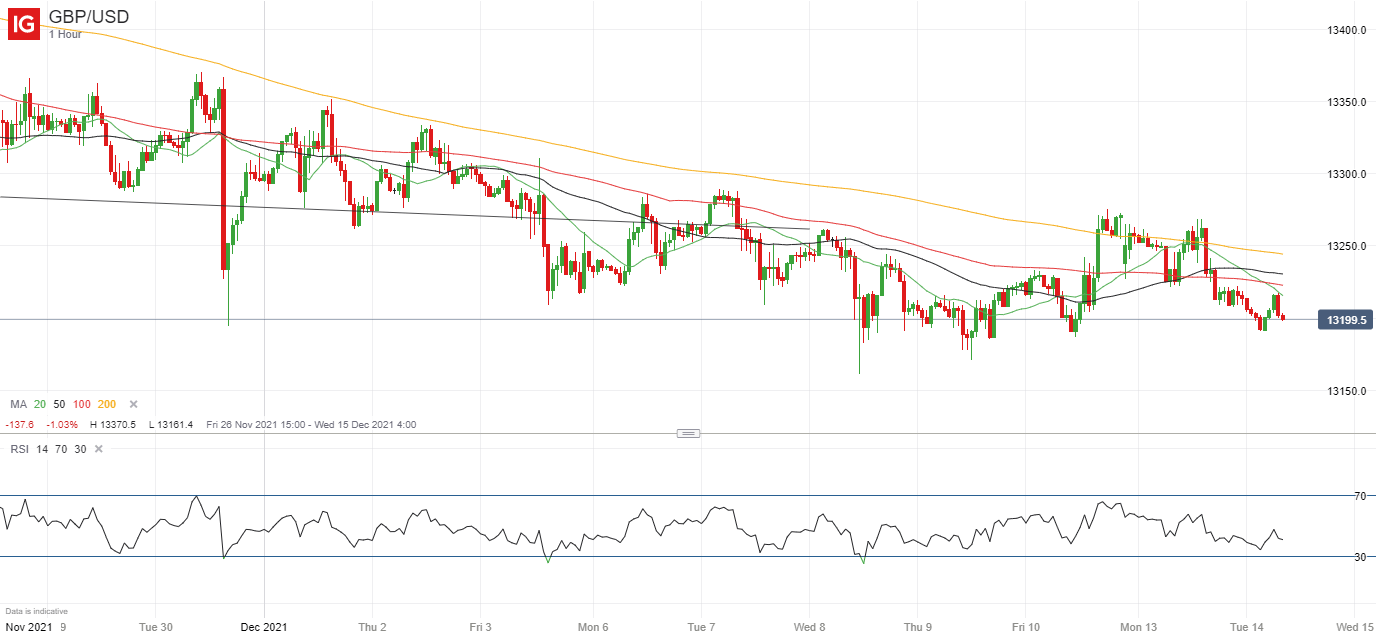
Source: IG (You can click on it for a larger image)


UK PAYROLLS RISE

In the news, UK employment data released Tuesday showed that 257,000 people were added to company payrolls last month, the most since records began in 2014. That suggests UK businesses have largely survived the ending of the Government’s furlough scheme but the numbers will probably be ignored by the BoE, which now looks set to delay any tightening of monetary policy until next year. Meanwhile the data also showed a falling unemployment rate but a smaller than forecast increase in employment.

UK jobs data.

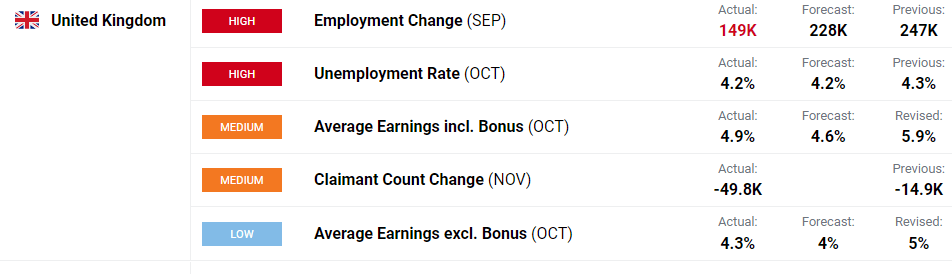
Source: DailyFX calendar


The Bank will also likely ignore Wednesday’s UK inflation figures, with the consensus forecast an increase in the core rate to 3.7% year/year in November, up from the previous 3.4%.

RETAIL TRADER DATA BEARISH GBP/USD

Turning to the IG client positioning numbers, retail trader data show 75.83% of traders are net-long GBP/USD, with the ratio of traders long to short at 3.14 to 1. The number of traders net-long is 9.67% higher than yesterday and 10.77% higher than last week, while the number of traders net-short is 5.13% lower than yesterday and 7.72% lower than last week.

Here at DailyFX, we typically take a contrarian view to crowd sentiment, and the fact traders are net-long suggests GBP/USD may fall. Moreover, traders are further net-long than yesterday and last week, and the combination of current sentiment and recent changes gives us a stronger GBP/USD-bearish contrarian trading bias.


Written by Martin Essex, Analyst, 14th December 2021. DailyFX

0 Comments


Recommended Comments

There are no comments to display.

Create an account or sign in to comment

You need to be a member in order to leave a comment

Create an account

Sign up for a new account in our community. It's easy!

Register a new account

Sign in

Already have an account? Sign in here.

Sign In Now
  • Blog Statistics

    • Total Blogs
      3
    • Total Entries
      2,822
  • Latest Forum Topics

  • Our picks

    • International Workers' Day & Early May Trading Hours
      Please be advised that our opening hours will be adjusted on 1 May 2024 for International Workers’ Day and 6 May 2024 for the UK Early May Bank Holiday. Where appropriate, the times listed are in GMT.
        • Like
    • Are these the best AI stocks to watch in May 2024?
      Microsoft, Apple, Nvidia, Amazon and Meta could be the best AI stocks to watch next month. These stocks are the largest AI stocks in the US based on market capitalisation.
    • Natural Gas Commodity Elliottwave Technical Analysis
      Natural Gas


      Mode - Impulsive 


      Structure - Impulse Wave 


      Position - Wave (iii) of 5


      Direction - Wave (iii) of 5 still in play


      Details:  Price now in wave iii as it attempts to breach 1.65 wave i low. Wave (iii) is still expected to extend lower in an impulse.


      Natural Gas is currently breaching the previous April low, marking a decisive move as the impulse initiated on 5th March continues its downward trajectory, further extending the overarching impulse wave sequence that commenced back in August 2022. This decline is anticipated to persist as long as the price remains below the critical resistance level of 2.012.


      Zooming in on the daily chart, we observe the medium-term impulse wave originating from August 2022, which is persisting in its downward trend after completing its 4th wave - delineated as primary wave 4 in blue (circled) - at 3.666 in October 2023. Presently, the 5th wave, identified as primary blue wave 5, is underway, manifesting as an impulse at the intermediate degree in red. It is envisaged that the price will breach the February 2024 low of 1.533 as wave 5 of (3) seeks culmination before an anticipated rebound in wave (4). This confluence of price movements underscores the bearish sentiment prevailing over Natural Gas in the medium term.


      Analyzing the H4 chart, we initiated the impulse wave count for wave (3) from the level of 2.012, which marks the termination point of wave 4. Notably, price action formed a 1-2-1-2 structure, with confirmation established at 1.65 and invalidation set at 2.012. The confirmation of our anticipated direction materialized as price breached the 1.65 mark, signifying a resumption of bearish momentum. Presently, there appears to be minimal resistance hindering the bears, thereby reinstating their dominance in the market. It is projected that wave iii of (iii) of 5 will manifest around 1.43, indicative of the potential for the wave 5 low to extend to 1.3 or even lower. This comprehensive analysis underscores the prevailing bearish outlook for Natural Gas in the immediate future.


      Technical Analyst : Sanmi Adeagbo
       
        • Like
×
×
  • Create New...
us