Weekly Fundamental US Stocks Forecast: Inflation Data in Focus After FOMC Minutes, NFP

Entry posted by MongiIG in Market News
696 views
FUNDAMENTAL FORECAST FOR THE US DOLLAR: NEUTRAL
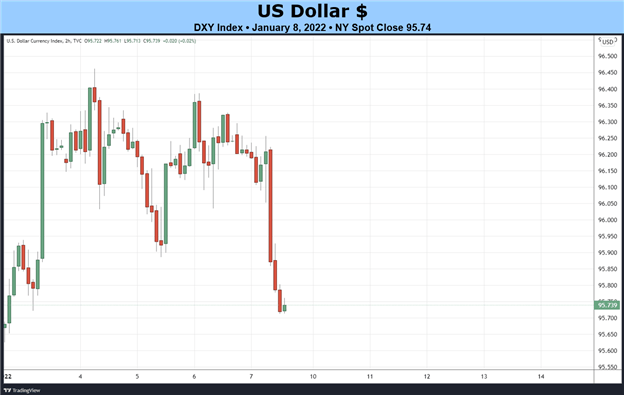
- While the DXY Index added +0.07%, most of its gains were given back by the end of the week following the middling December US jobs report.
- Not only are there several ‘high’ ranked data releases due in the coming days, there are testimonies and speeches by several Federal Reserve policymakers that seem destined to introduce more volatility to financial markets.
- According to the IG Client Sentiment Index, the US Dollar has a mixed bias heading into mid-January.

US DOLLAR WEEK IN REVIEW
The first week of the year proved to be disappointing for the US Dollar. While the DXY Index added +0.07%, most of its gains were given back by the end of the week following the middling December US jobs report. EUR/USD rates finished lower by -0.20%, while USD/JPY rates added +0.33%. With risk appetite fading, high beta pairs like AUD/USD and NZD/USD fell back by -1.24% and -1.07%, respectively. GBP/USD rates bucked the trend, gaining +0.39%.
US ECONOMIC CALENDAR IN FOCUS
With the holidays official in the rearview mirror, the turn into the second week of January brings about a supersaturated US economic docket. Not only are there several ‘high’ ranked data releases due in the coming days, there are testimonies and speeches by several Federal Reserve policymakers that seem destined to introduce more volatility to financial markets in the wake of the December Fed meeting minutes.
- On Monday, January 10, the November US wholesale inventories report will be released in the morning. In the afternoon, are 3-month and 6-month bill auctions.
- On Tuesday, January 11, Kansas City Fed President George will give a speech preceding testimony by Fed Chair Powell at his nomination hearing. In the afternoon, there will be a 3-year note auction as well as the release of the weekly US API crude oil stock report.
- On Wednesday, January 12, weekly US MBA mortgage applications figures are due in the morning, as is the December US inflation rate (CPI) report. After the US cash equity open the weekly US EIA energy stock reports will be released. In the afternoon, there is a 10-year note auction and the December US monthly budget statement is due.
- On Thursday, January 13, Philadelphia Fed President Harker will give remarks and the weekly US jobless claims figures will be released. Incoming Fed Vice Chair Brainard will give testimony at her nomination hearing. In the afternoon, there are 4-week and 8-week bill auctions, Chicago Fed President Evans will give a speech, and there will be a 30-year bond auction.
- On Friday, January 14, the December US retail sales report, the December US industrial production report, and the November US business inventories figures will be released ahead of the US cash equity open. Later in the morning, the preliminary January US Michigan consumer sentiment survey is due. Rounding out the day, New York Fed President Williams will give remarks.
ATLANTA FED GDPNOW 4Q’21 GROWTH ESTIMATE (JANUARY 6, 2021) (CHART 1)
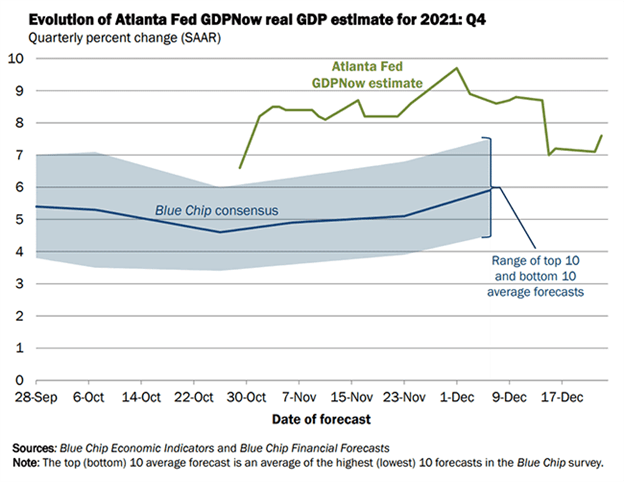
Based on the data received thus far about 4Q’21, the Atlanta Fed GDP Now growth forecast is now at +6.7% annualized, down from +7.4% on January 4. “Recent releases from the US Bureau of Economic Analysis, the US Census Bureau, and the Institute for Supply Management” have weighed down US growth expectations as the COVID-19 omicron variant infection rate has surged in recent weeks.
The next update to the 4Q’21 Atlanta Fed GDP Now growth forecast is due on Monday, January 10 after November US wholesale inventories data are released.
For full US economic data forecasts, view the DailyFX economic calendar.
MARKET PRICING FOR FED MORE AGGRESSIVE
We can measure whether a Fed rate hike is being priced-in using Eurodollar contracts by examining the difference in borrowing costs for commercial banks over a specific time horizon in the future. Chart 2 below showcases the difference in borrowing costs – the spread – for the January 2022 and December 2023 contracts, in order to gauge where interest rates are headed by December 2023.
EURODOLLAR FUTURES CONTRACT SPREAD (JANUARY 2022-DECEMBER 2023) [BLUE], US 2S5S10S BUTTERFLY [ORANGE], DXY INDEX [RED]: DAILY CHART (JULY 2021 TO JANUARY 2022) (CHART 2)
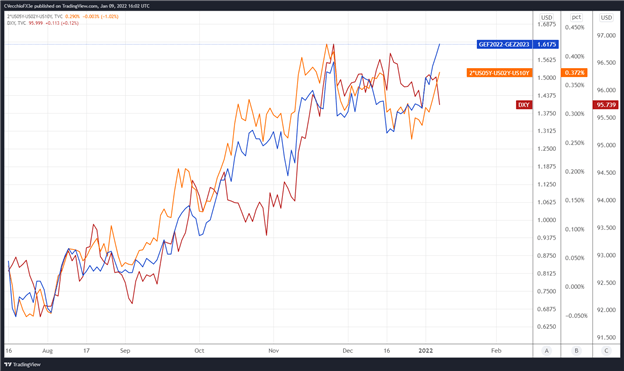
By comparing Fed rate hike odds with the US Treasury 2s5s10s butterfly, we can gauge whether or not the bond market is acting in a manner consistent with what occurred in 2013/2014 when the Fed signaled its intention to taper its QE program. The 2s5s10s butterfly measures non-parallel shifts in the US yield curve, and if history is accurate, this means that intermediate rates should rise faster than short-end or long-end rates.
There are 161.75-bps of rate hikes discounted through the end of 2023 while the 2s5s10s butterfly is just off of its widest spread since the Fed taper talk began in June (and its widest spread of all of 2021). After the December Fed meeting minutes and December US NFP report, rates markets are effectively pricing in a 100% chance of six 25-bps rate hikes and a 47% chance of seven 25-bps rate hikes through the end of next year – the most aggressive Fed rate pricing seen during the pandemic thus far.
US TREASURY YIELD CURVE (1-YEAR TO 30-YEARS) (JANUARY 2020 TO JANUARY 2022) (CHART 3)
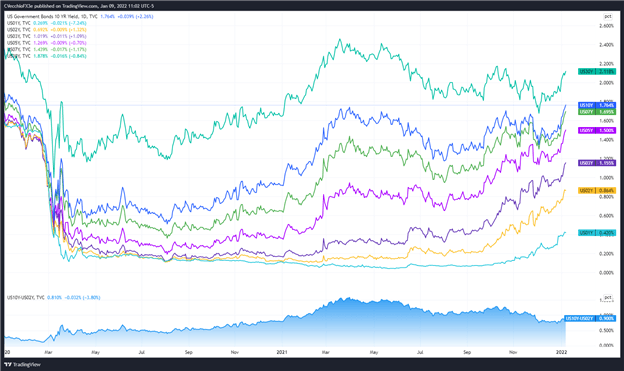
Historically speaking, the combined impact of rising US Treasury yields – particularly as intermediate rates outpace short-end and long-end rates – alongside elevated Fed rate hike odds has produced a favorable trading environment for the US Dollar.
CFTC COT US DOLLAR FUTURES POSITIONING (JANUARY 2020 TO JANUARY 2022) (CHART 4)
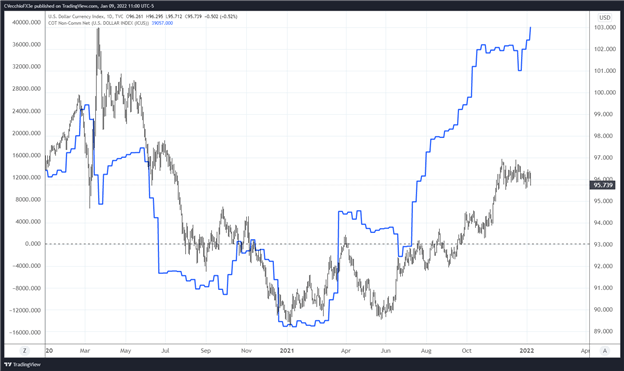
Finally, looking at positioning, according to the CFTC’s COT for the week ended December 7, speculators decreased their net-long US Dollar positions to 39,057 contracts from 36,775 contracts. Net-long US Dollar positioning continues to hold near its highest level since October 2019, when the DXY Index was trading above 98.00. Failure by the DXY Index to push higher despite rising US Treasury yields and increasing Fed rate hike odds may be symptomatic of an oversaturated futures market.
Written by Christopher Vecchio, CFA, Senior Strategist. 10th Jan 2022. DailyFX


.jpeg.98f0cfe51803b4af23bc6b06b29ba6ff.jpeg)

0 Comments
Recommended Comments
There are no comments to display.
Create an account or sign in to comment
You need to be a member in order to leave a comment
Create an account
Sign up for a new account in our community. It's easy!
Register a new accountSign in
Already have an account? Sign in here.
Sign In Now