Facebook (FB, Meta) and Nasdaq 100 Outlook Following Big Earnings Hit

Entry posted by MongiIG in Market News
543 views

Feb 3, 2022
By:Paul Robinson, DailyFX
Facebook & NDX Technical Outlook
Facebook (Meta?) stock takes huge hit on earnings
Gap-down could spark post-earnings drift
Nasdaq 100 in a precarious spot after big technical trigger
Facebook (FB, Meta) and NDX Technical Outlook Following Big Earnings Hit
Facebook (FB), or ‘Meta’ (the new parent company name), took a massive hit overnight on its earnings miss. The stock is down over 20% in pre-market trading on a variety of issues with its quarterly earnings and future outlook.
I’m not going to go into all the messy details of exactly why Wall St. is reacting the way it is, I think all we need to know is that it is reacting in a big way and that types of gaps don’t happen without an abundance of sellers heading for the exit on a generally wrong view.
Facebook’s stock has been in this position before. Back in 2018, FB lost nearly 19% following an earnings miss. The most interesting part about the event then was that it came after a strong run and close to a record high the day of its earnings announcement. The market was obviously not positioned for a miss.
This time, it is a little different. FB topped in September and has been generally weaker than the broader market, suggesting that there was at least some level of concern about the future of Meta, even if only in the intermediate-term.
Nevertheless, gaps of this size against the primary trend, whether from dead highs or relatively close to them, show that a large number of market participants are leaning the wrong way. This significantly increases the odds that we see a post-earnings drift lower.
In 2018, this is exactly what happened the months following the surprise release. After the one-day gouge, the stock declined about another 30% before eventually bottoming. It appears the risk of a similar fate is in store for FB this go around. Maybe it falls more this time, maybe less, but in an event the bias is towards shorts over the coming weeks and months.
FB is looking to open around solid support near 250 created during 2020/2021, so this may provide an initial floor. A breaking of support, whether it comes today or after a bounce, could help with timing the above scenario. There is a trend-line dating to 2013 that runs up to under 200 that could be the first spot of real support once immediate support is taken out.
FB DAILY CHART
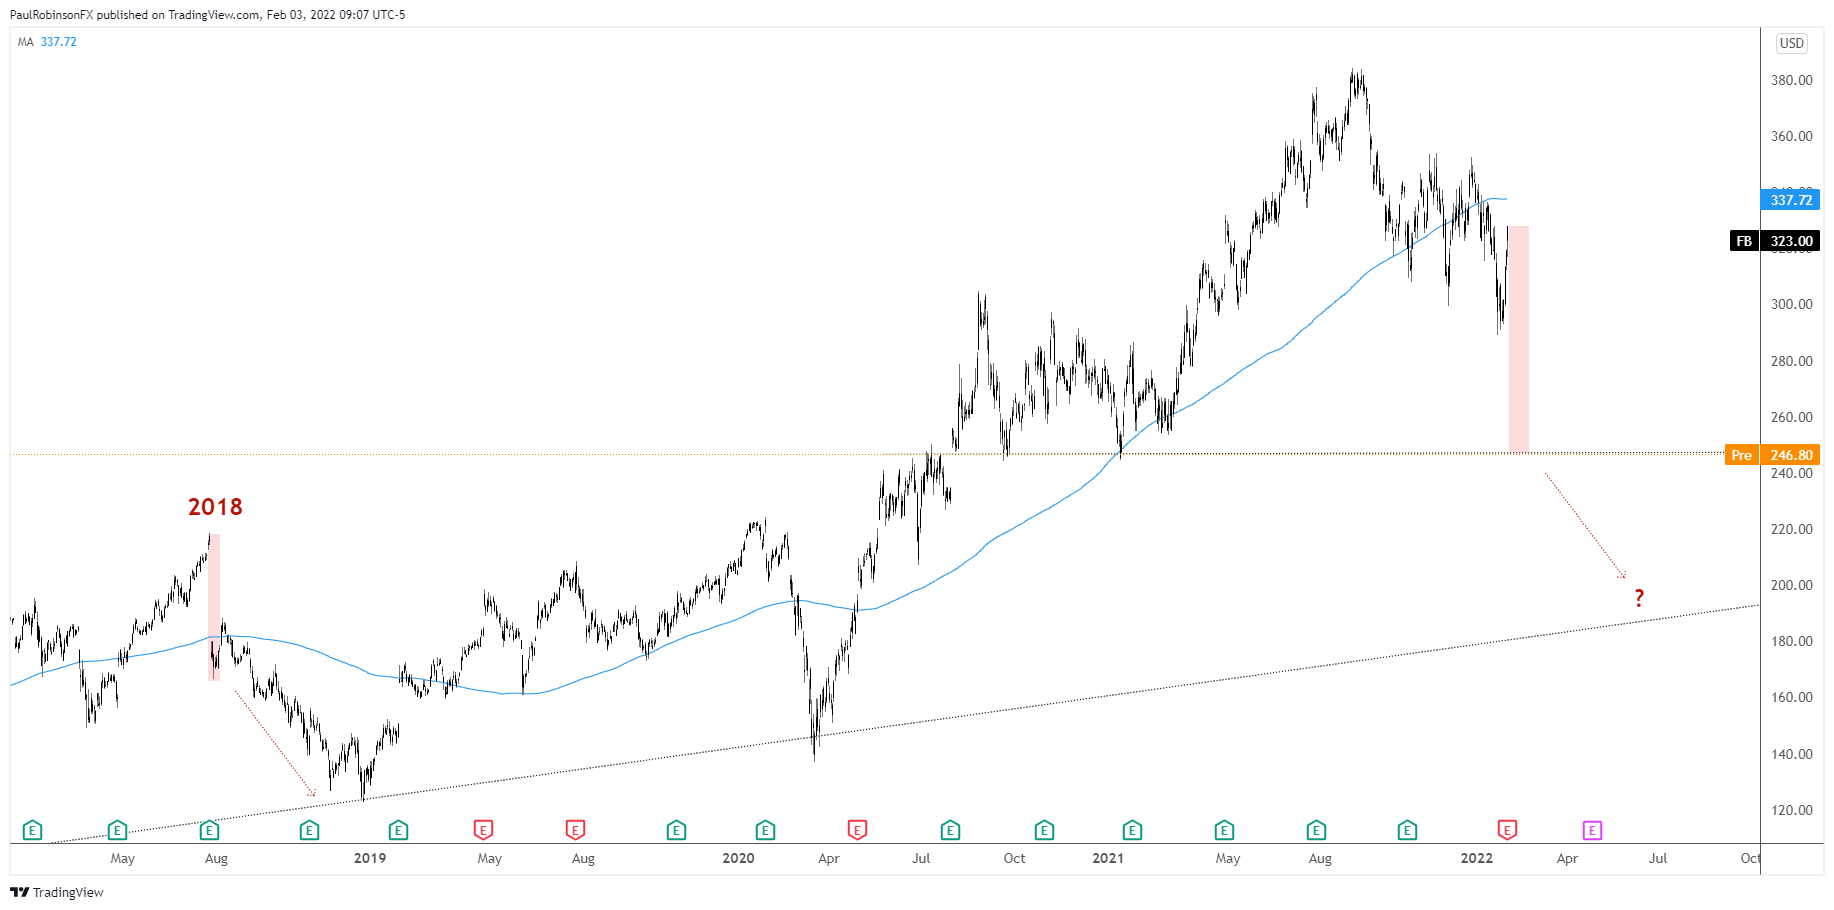
FB Chart by TradingView
The Nasdaq 100 recently snapped a bullish channel dating to September 2020, putting it in position to sell off even more. We are currently seeing some strength out of the market after reaching oversold conditions.
Just a bounce or a renewed leg higher in the bull market? The thinking is that risk is quite high we are in for at least another leg lower over the next few weeks. If the NDX can’t recover the channel by climbing above the lower channel line, then looking for a decline to begin soon.
The move off the recent low has the potential to post the right shoulder of a would-be ‘head-and-shoulders’ pattern. We have the other two parts (left shoulder & head), but will need to not only see a right shoulder develop but then the neckline break. The breaking of the neckline is the most important piece of confirmation for an H&S pattern.
From a tactical standpoint, a test of the lower trend-line could offer up a solid risk/reward entry for shorts or bearish options strategies, such as buying puts or put spreads. A confirmed break of the neckline (a good distance lower) would firm up the notion that we are heading well into bear market territory. More on that later if it becomes relevant…
NASDAQ 100 DAILY CHART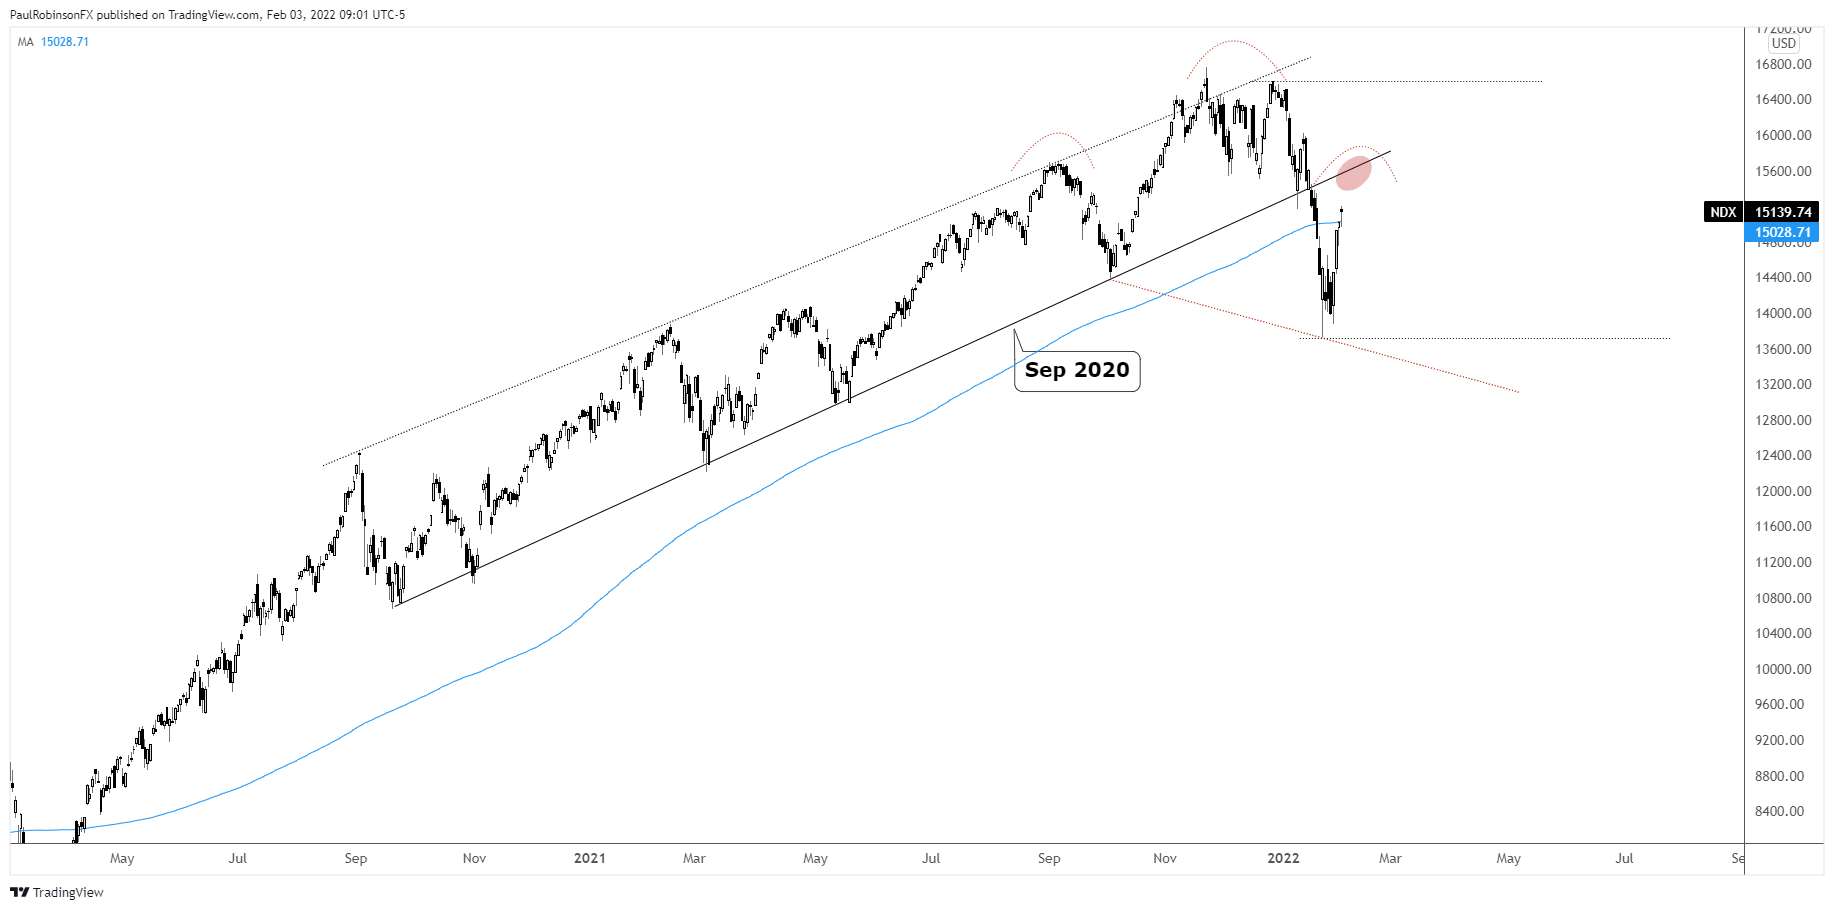
Nasdaq 100 Chart by TradingView
Written by Paul Robinson, Market Analyst


.jpeg.98f0cfe51803b4af23bc6b06b29ba6ff.jpeg)

0 Comments
Recommended Comments
There are no comments to display.
Create an account or sign in to comment
You need to be a member in order to leave a comment
Create an account
Sign up for a new account in our community. It's easy!
Register a new accountSign in
Already have an account? Sign in here.
Sign In Now