Netflix’s share price: what to expect from Q1 results

Entry posted by ArvinIG in Analyst article
830 views
Find out what to expect from Netflix’s earnings results, how they will affect Netflix share price, and how to trade Netflix’s earnings.

Source: Bloomberg
When is Netflix’s results date?
Tuesday 19 April, after the market close is when traders and investors can get their hands on the streaming giant’s first quarter (Q1) earnings results.
Netflix share price: forecasts from Q1 results
And give it’s the first of the FAANG (Facebook, Apple, Amazon, Netflix, and Google) to release its figures, it has a tendency to be a closely watched event with implications not just for other streamers aiming to mimic its success in being at the very top, but for other growth and tech related companies.
Analysts’ forecasts are for an earnings per share (EPS) reading of $2.9 for Q1, below the $3.75 EPS seen for the same period last year. That estimate has been little changed over the past two months. As for revenue, they’re hoping for over $7.9 billion (source: finance.yahoo.com).
As for last time around when it released Q4 results back in January, it was a beat on earnings ($1.33 vs $0.82) while a match on revenue ($7.71 billion). What struck a big nerve then that sent its share price tumbling 20% after its 2021 Q4 earnings was the miss on subscribers from the 8.5 million it had forecasted, and an outlook that surprised to the downside.
Expecting to add 2.5 million this quarter instead of prior expectations from analysts of 6.93 million and well above what it enjoyed last year at 3.98 million wasn’t taken well given the reception in the financial markets to its share price. And that means subscriber growth is likely to be the main item in focus this time around with a withdrawal from Russia noted, also taking a look at guidance for the quarter we’re currently in.
That “added competition may be affecting our marginal growth” was a key takeaway from Q4 shareholder letter, this as it remains the pricier option amongst most streaming companies. Any update or change in thought process on that front ought to be taken into consideration, as well as the ongoing push into gaming after another acquisition late last month.
Overall, it’s a majority buy rating with few daring to go into the ‘underperform’ and ‘sell’ categories as mostly either ‘hold’ or ‘buy’, with a decent amount going for ‘strong buy’. It gets interesting with the price target, the average going for a price target above $500 from where it currently stands at around $352 (source: finance.yahoo.com).
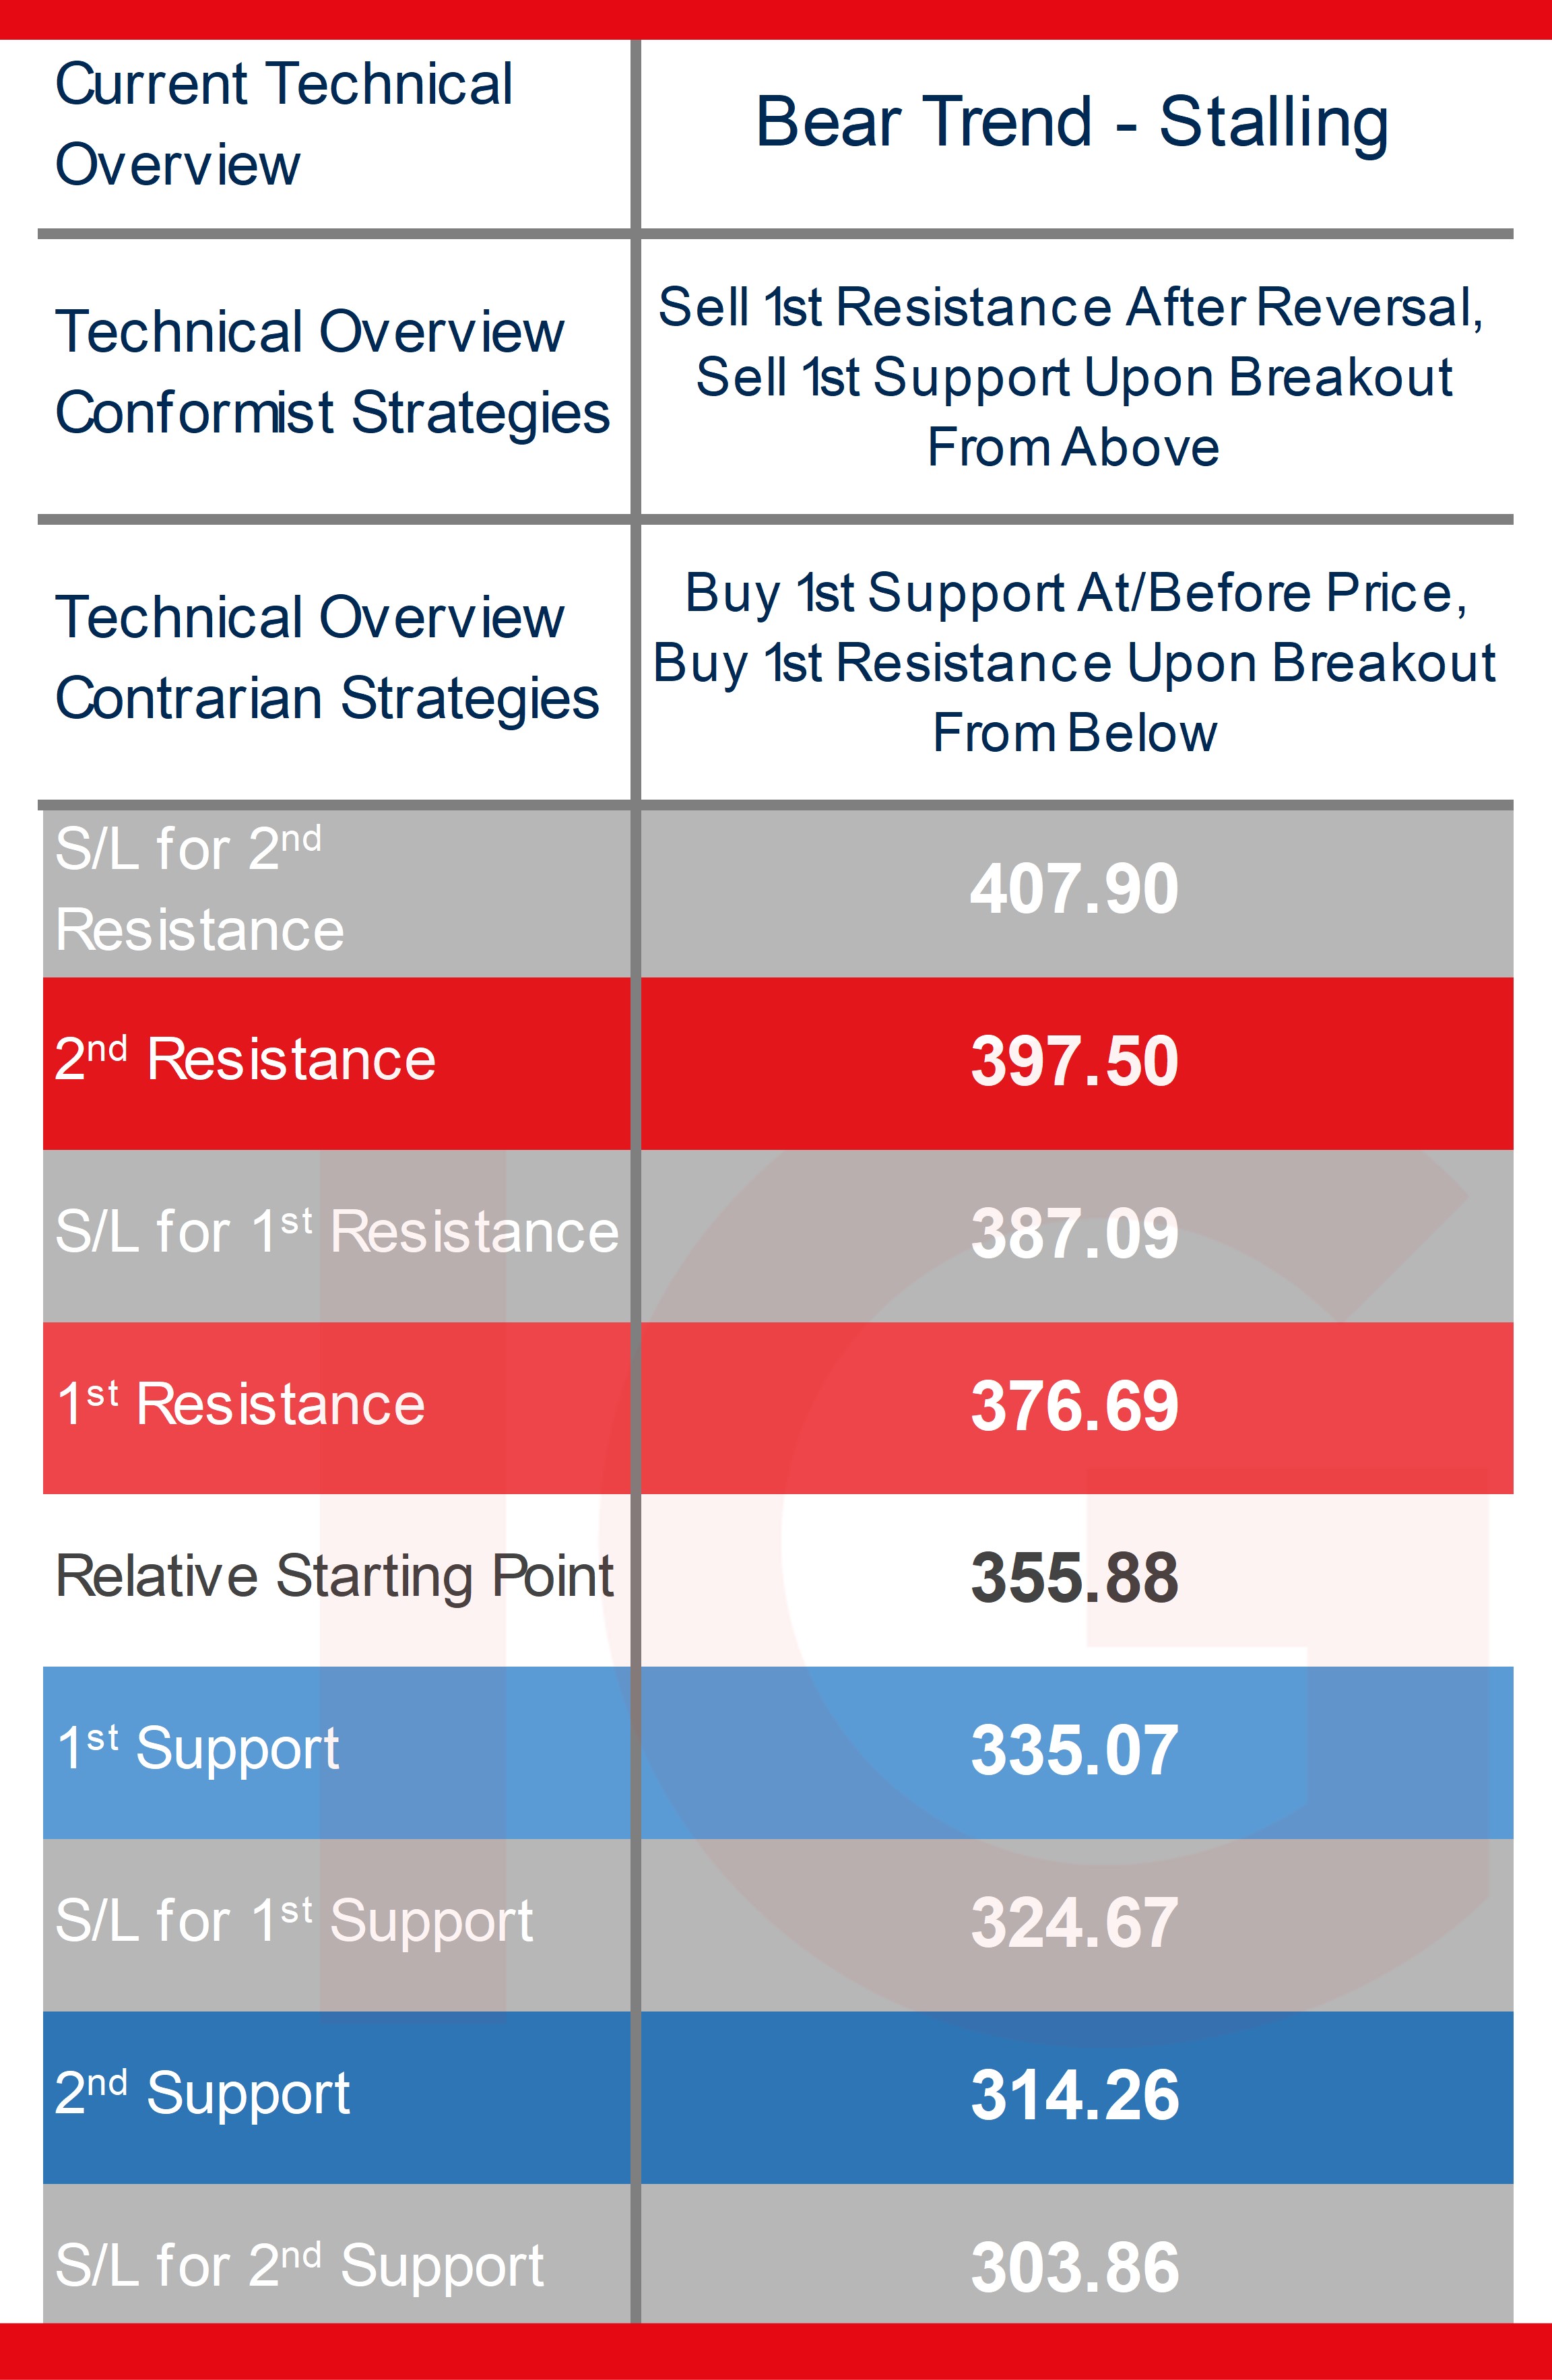
Trading Netflix’s Q1 results: weekly technical overview and trading strategies
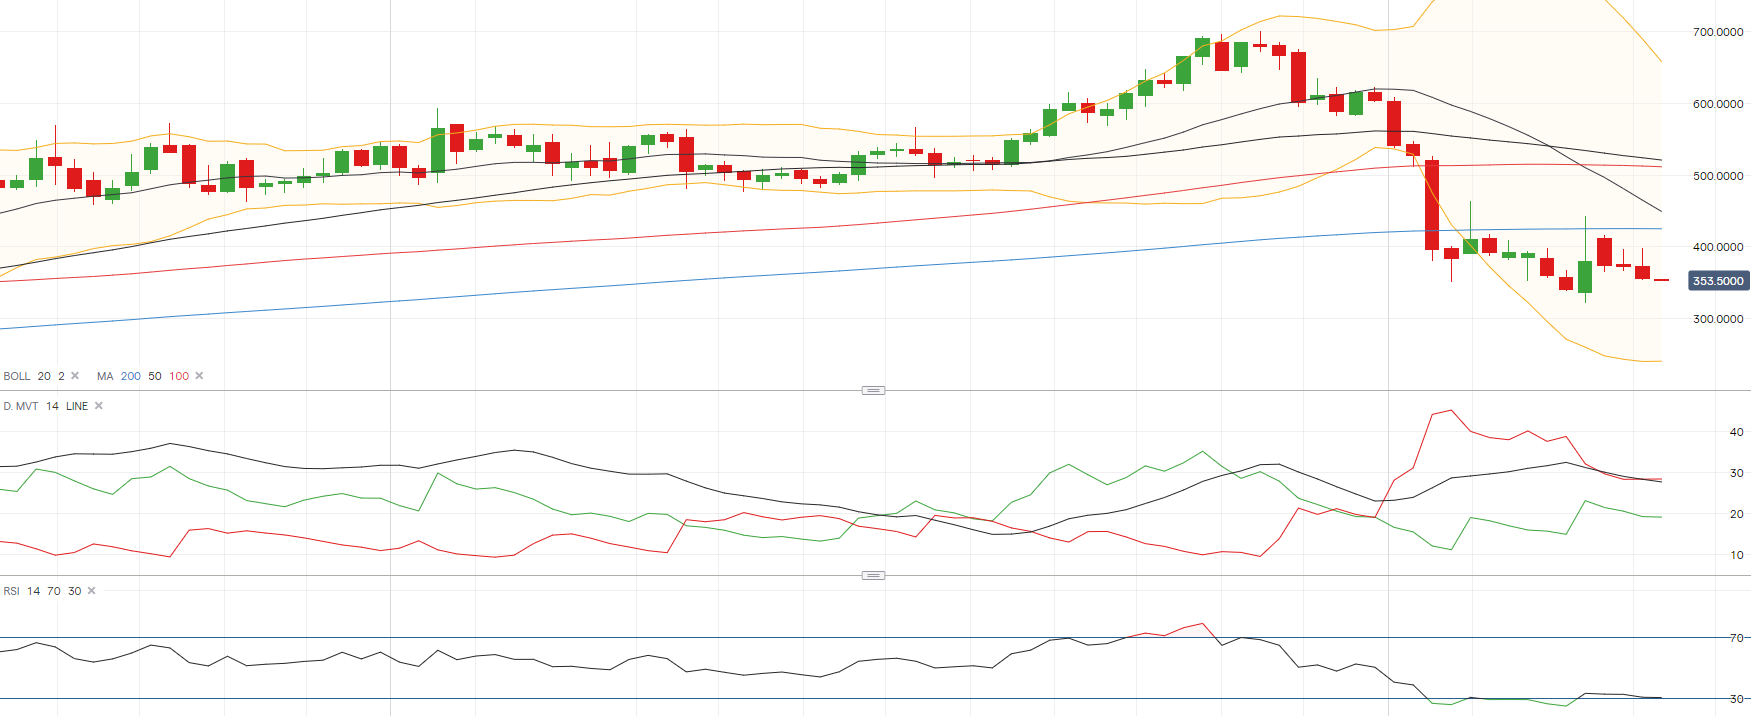
Although earnings are about the fundamental aspect of the company, a brief glance at the technicals and they haven’t been too kind to say the least, especially when zooming out to the weekly time frame seen in the chart below.
Ratings upgrades amongst some (like Citi) and big money from others (like Bill Ackman’s Pershing Square fund back in January following the drop then) were thought to have helped assuage fears that its share price hasn’t met its floor yet, only to disappoint thereafter.
Prices are beneath all its main short and long-term weekly moving averages, with a relative strength index (RSI) shy of oversold territory, its directional movement index (DMI) showing a decent enough margin of the negative directional indicator (DI-) over the positive directional indicator (DI+), and with an average directional movement index (ADX) still in trending territory.
The bulk of this negative technical bias is attributed to the move last January and zooming into the daily time frame shows more consolidatory tendencies, albeit still somewhat negative as it approaches the lower end of the daily Bollinger Band with a negative DMI cross not far off from occurring in the shorter-term time frame.
In all, when it comes to the weekly time frame, and the technical overview is a stalling bear trend in terms of classification, while in terms of strategies one where conformist strategies clearly haven’t won out over the last few months on what have been some rangebound weeks offering little if any follow-through to the downside, testing sell-breakout strategies at times.
That could change when doused with a major fundamental event like next Tuesday’s, especially as traders, market makers, and investors will remember the double-digit percentage drop last time around and will be eyeing a move well past levels formulated on more recent price action, making it more breakout vs. reversal.
Source: IG Charts
Netflix Weekly Chart with key technical indicators
Source: IG Charts
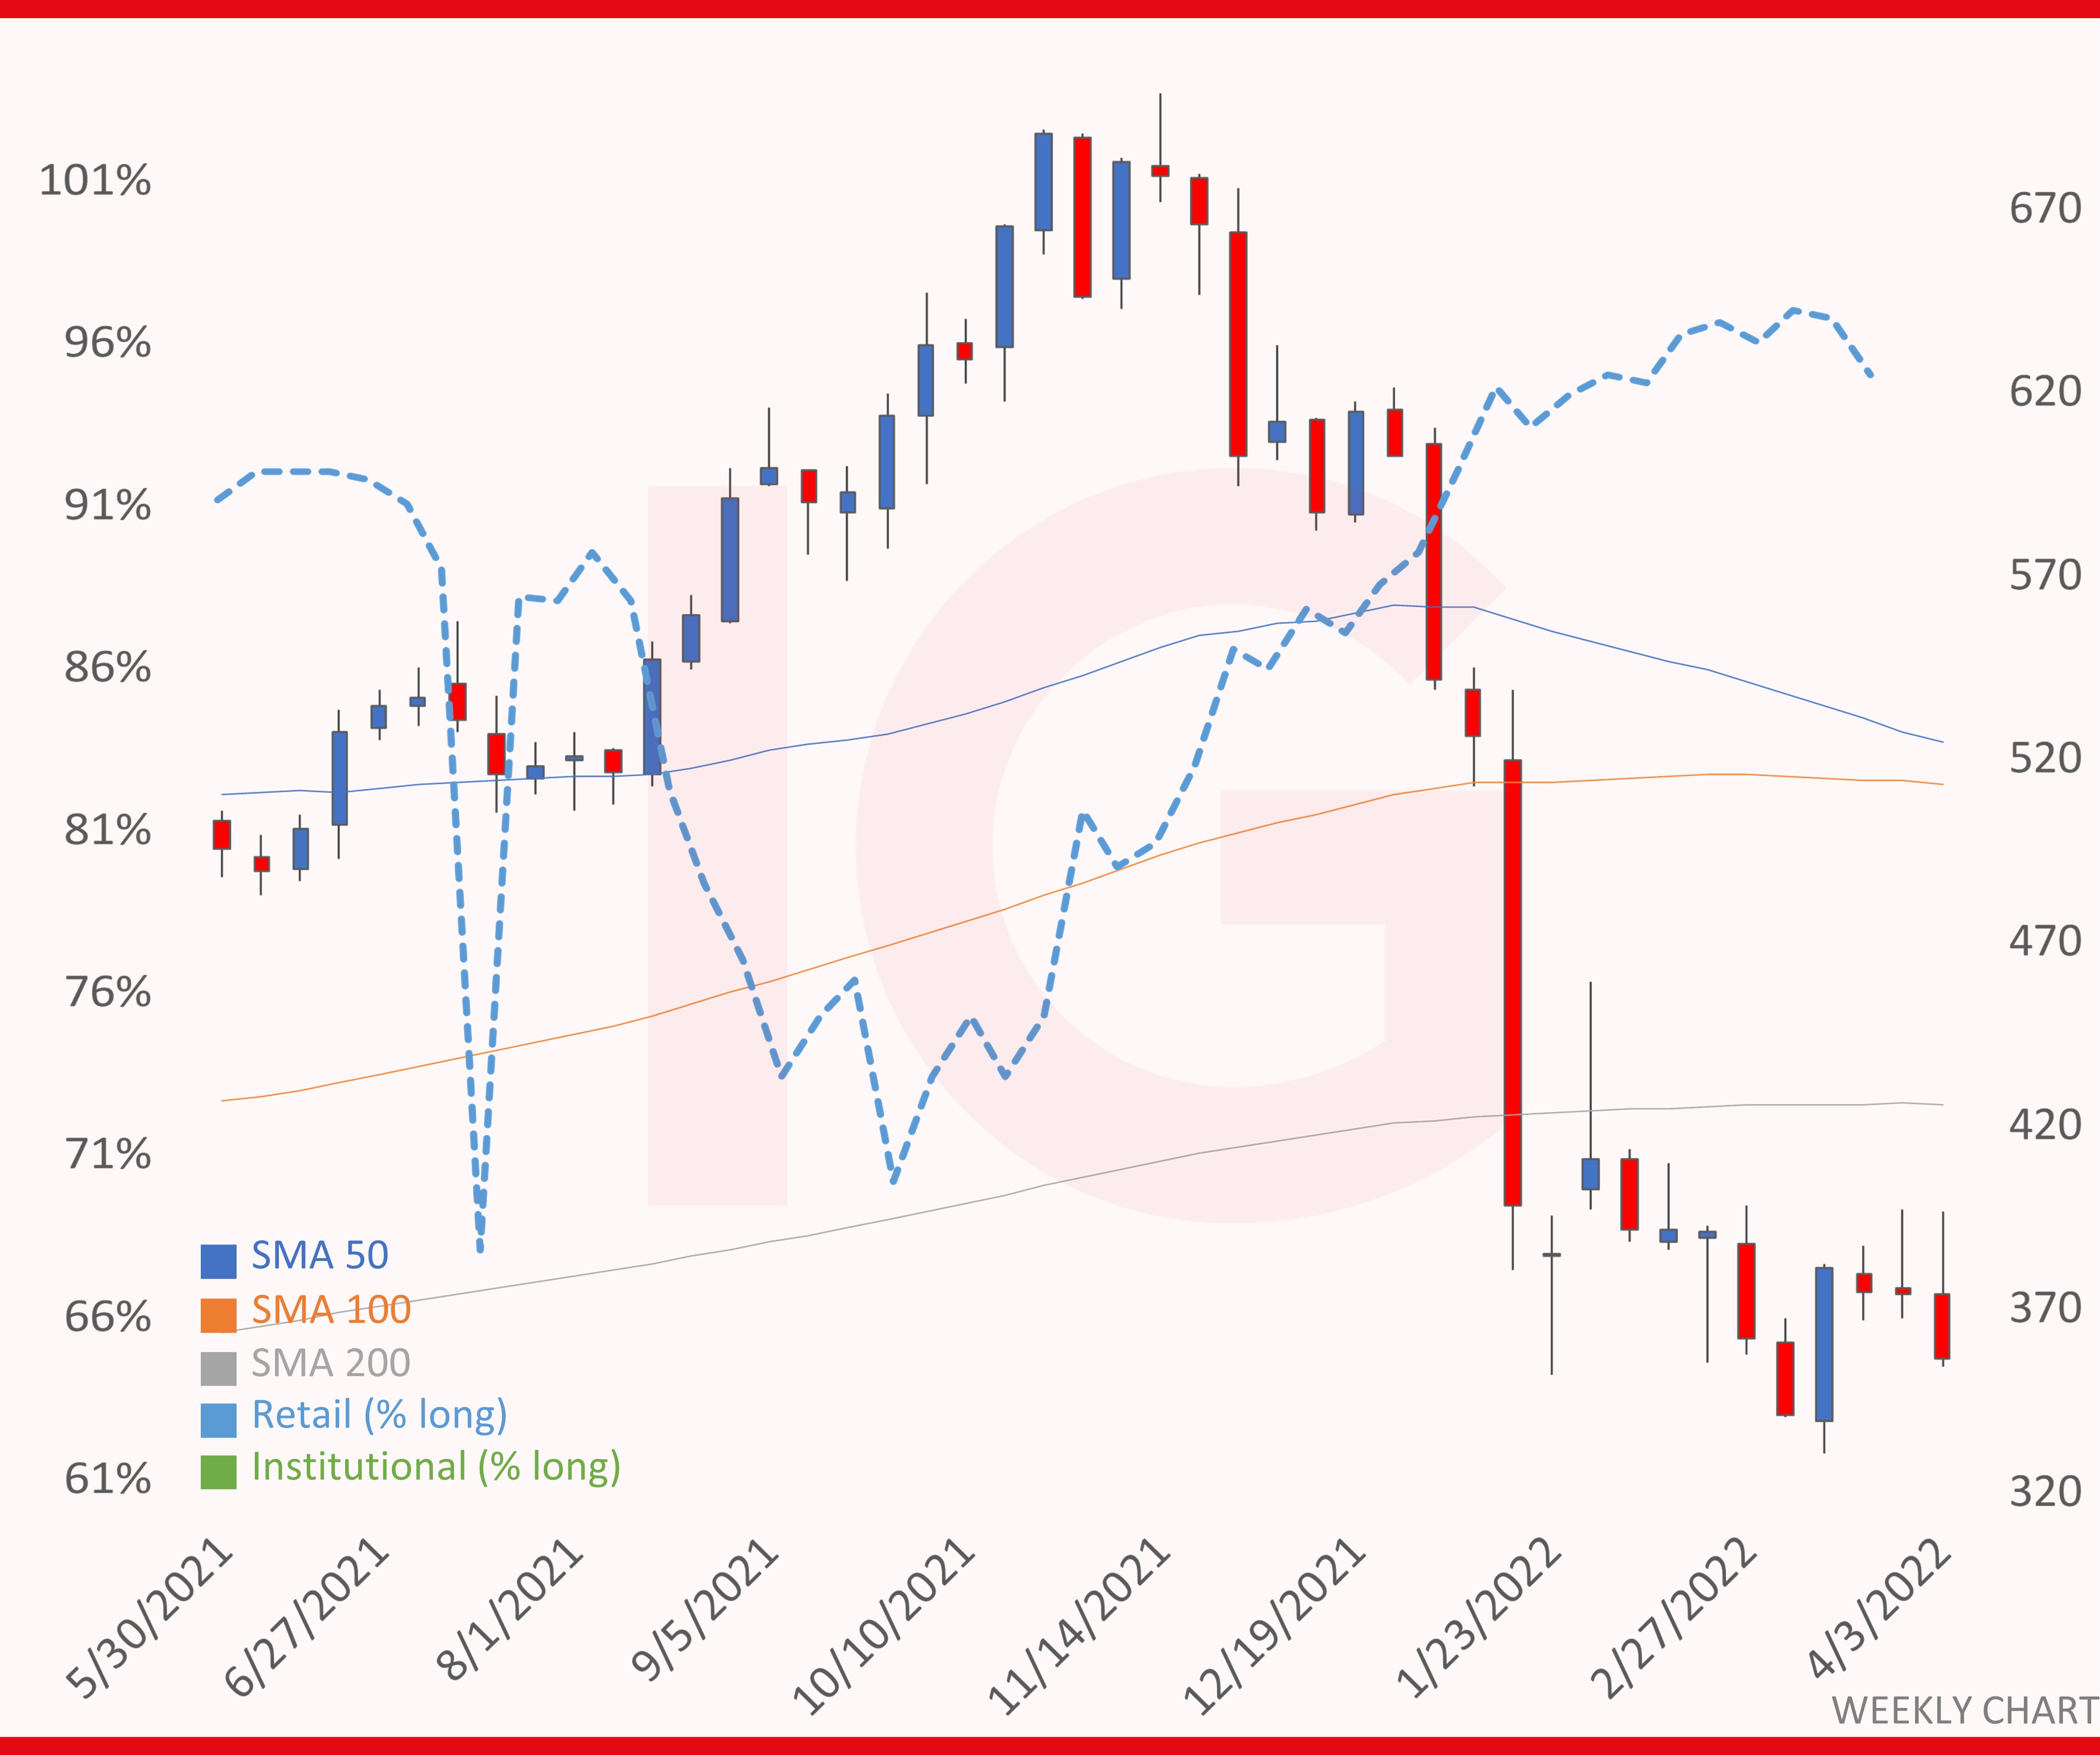
Netflix Weekly Chart with IG Client sentiment*
Source: IG Charts
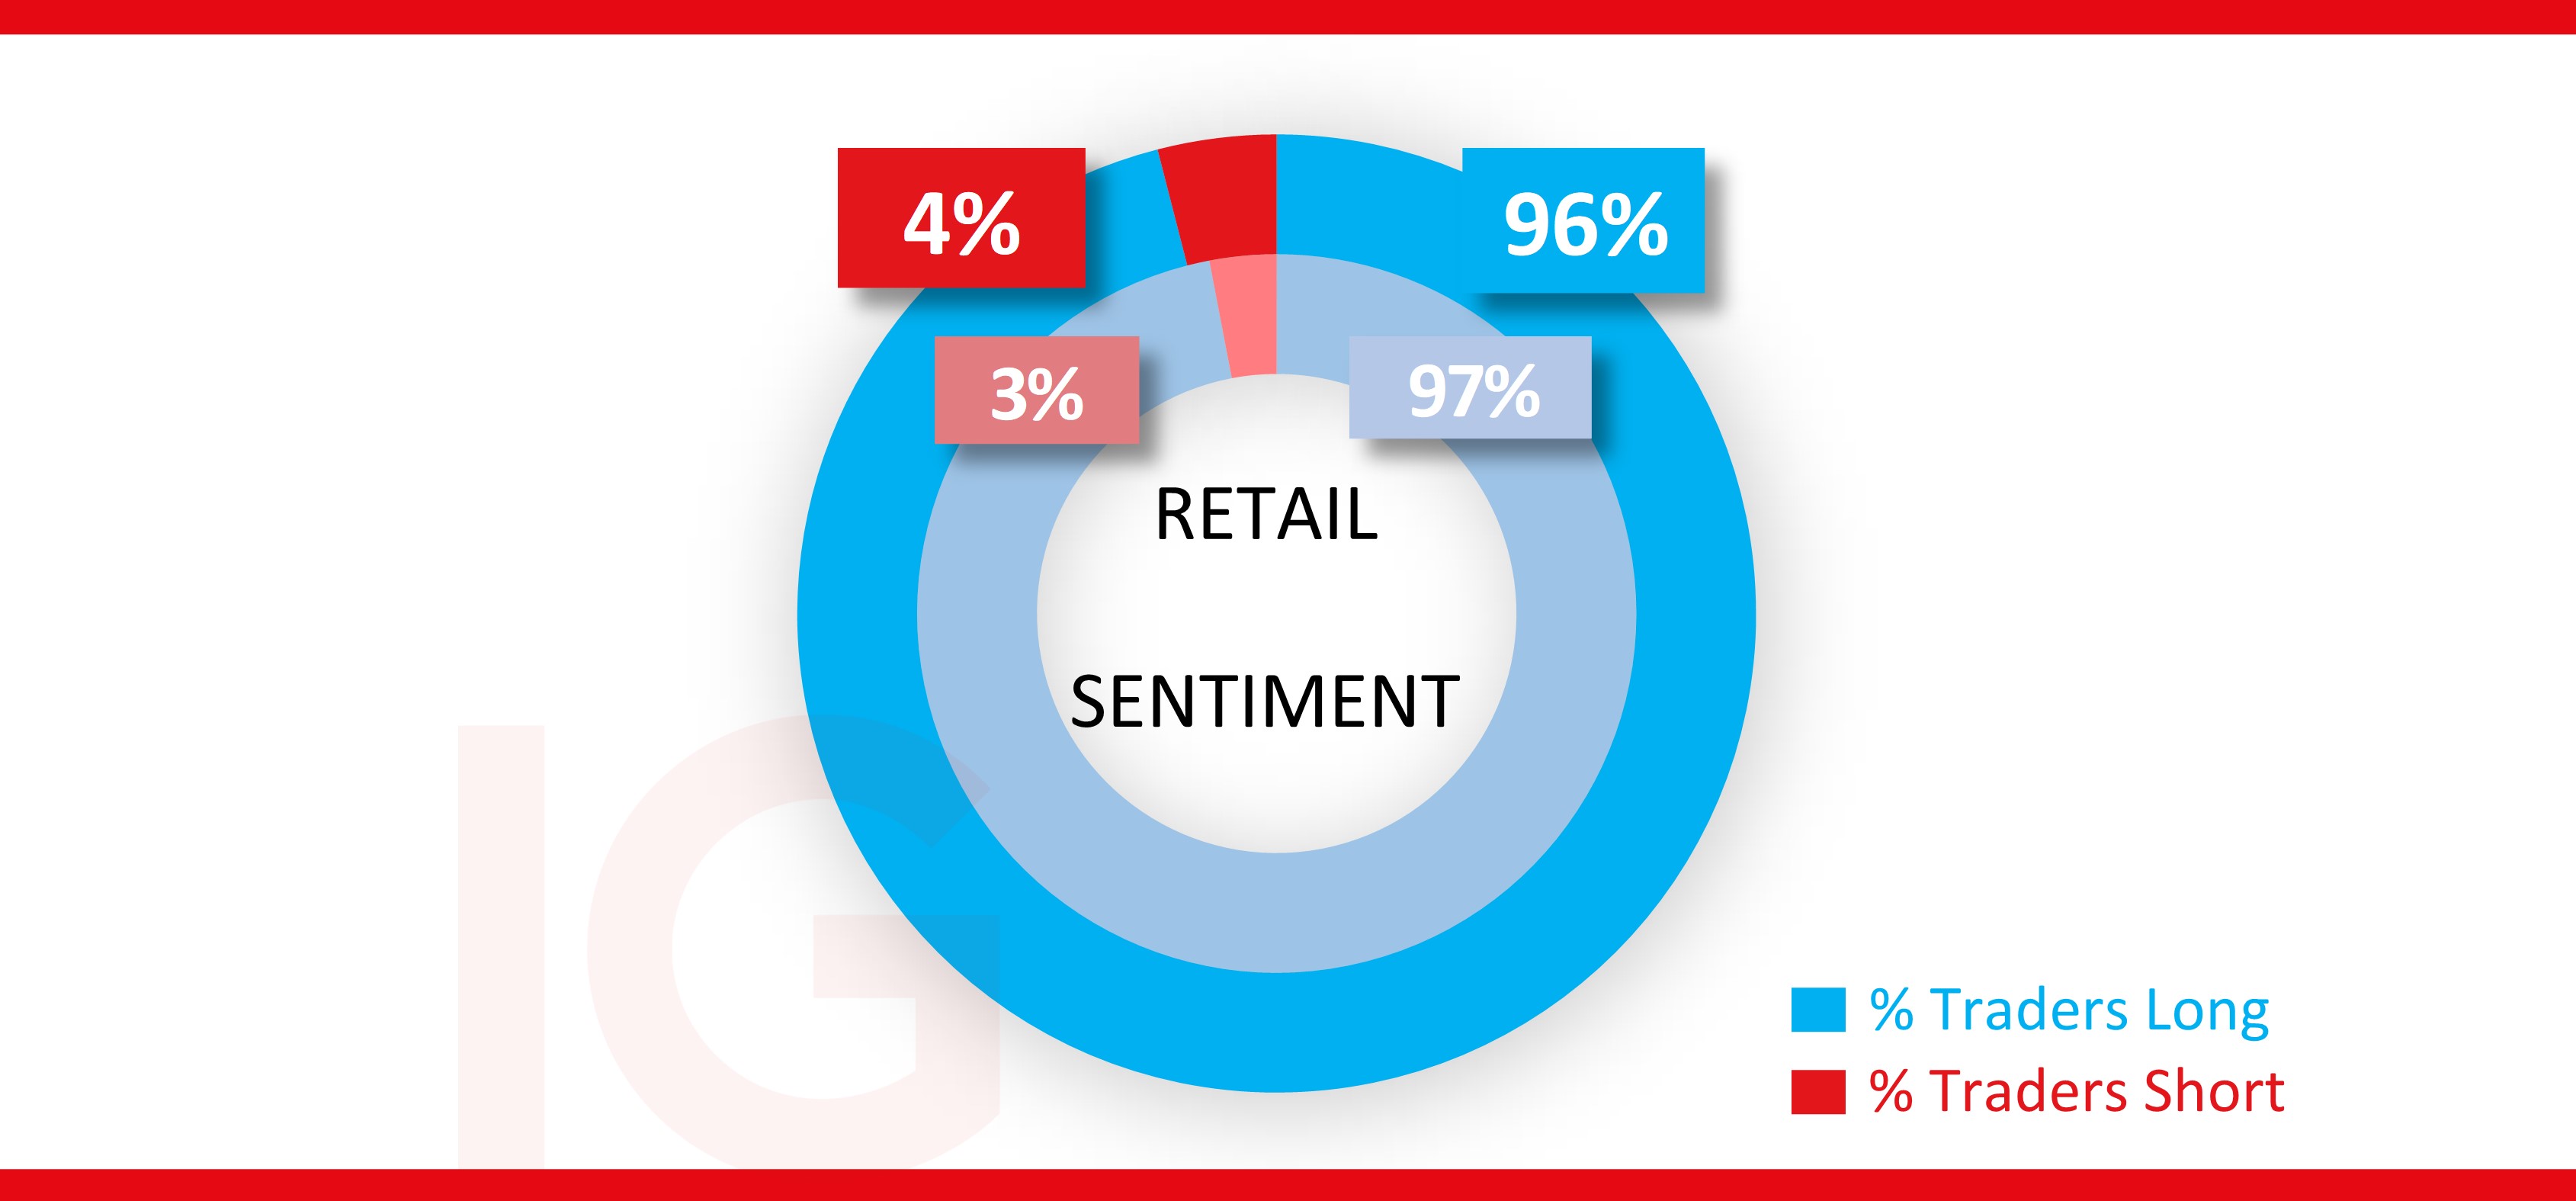
IG Client sentiment* and short interest for Netflix shares
It’s been heavy to extreme buy bias amongst retail traders for months now (blue dotted line in the chart above as % long i.e., 91% means 91% majority buy). And while traders were enticed into taking profit from August until about September, the pullback off the highs and the bear trend that ensued only pushed that buy bias into extreme buy territory, the latest reading at 96% and little changed week-on-week (WoW).
As for sentiment on the exchange, the number of current shares short stands at around 9.7 million, a bit higher than when it announced its earnings last time around and represents 2.21% of the total number of shares floating (source: shortsqueeze.com).
Source: IG Charts
* The percentage of IG client accounts with positions in this market that are currently long or short. Calculated to the nearest 1%, as of the start of the week for the outer circle, and the start of last week for the inner circle.
Monte Safieddine | Market analyst, Dubai
12 April 2022


.jpeg.98f0cfe51803b4af23bc6b06b29ba6ff.jpeg)


0 Comments
Recommended Comments
There are no comments to display.
Create an account or sign in to comment
You need to be a member in order to leave a comment
Create an account
Sign up for a new account in our community. It's easy!
Register a new accountSign in
Already have an account? Sign in here.
Sign In Now