FOMC, GDP and inflation to provide risk catalysts for the USD this week

Entry posted by ArvinIG in Analyst article
1,247 views
FOMC meeting minutes, a GDP revision and PCE inflation to guide the dollar price this week.

Source: Bloomberg
FOMC meeting minutes
Minutes from the last Federal Market Open Committee (FOMC) meeting on the 4th of May, are set for release on Wednesday (25 May) evening (GMT).
Markets will be looking for further clues with regards to the future of monetary tightening in the world's largest economy.
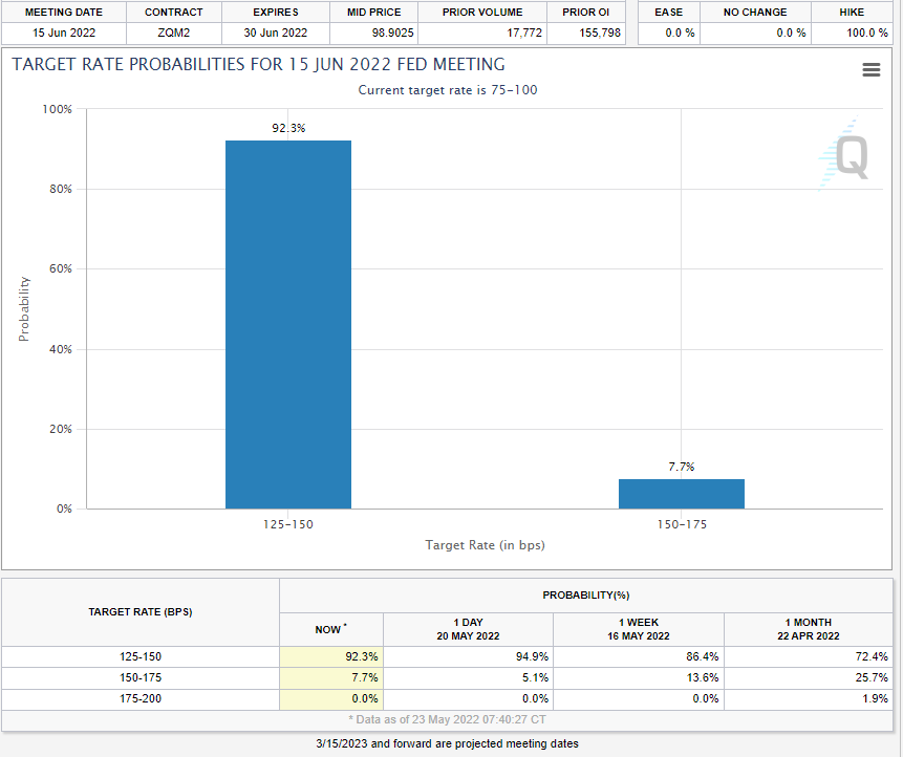
Source: CME Group Fedwatch Tool
The CME Group’s Fedwatch Tool currently suggests that a 50 basis point (bps) hike has a 92.3% probability at the 15 June meeting. The Fedwatch Tool goes on to suggest another 50 bps hike (87.6% probability) at July’s meeting as well.
But while the Federal Reserve (Fed) has become progressively more hawkish at each meeting, the group's outlook towards inflation and growth will come under increased scrutiny.
A more hawkish approach to monetary policy will find some friction against contraction in economic growth, whereby the first quarter produced negative growth of 1.4% year-on-year. The contraction in growth meets Consumer Price Index (CPI) inflation still tracking above 8%. Negative growth and high inflation provide two component parts of the ‘stagflation’ conundrum. The third component part to ‘stagflation’ is labour, which at current levels (3.6% unemployment) holds off overuse of the word just yet. Stagflation is known to be a precursor to a recession.
GDP and inflation prints this week as well
Further to Wednesday’s release of the FOMC meeting minutes, markets will be looking to Thursday’s US Gross Domestic Product (GDP) and Friday’s Personal Consumption Expenditure (PCE) Index data for near-term directional guidance.
The preliminary GDP data is a revision of the advance GDP data released last month, which showed an economic contraction of 1.4%. The PCE Index data is the Federal Reserve's preferred measure of inflation and follows on from the recently released CPI data which showed inflation in the world’s largest economy at 8.1% annualised in April this year.
The US dollar – technical view
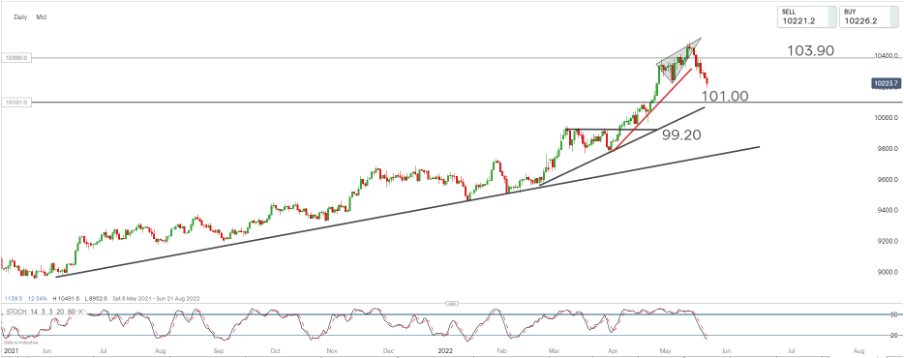
Source: ProRealTime
The dollar index is currently correcting from near-term highs. The rising wedge (shaded area), price blowoff (three steepening trendlines), and overbought signals were warnings that we could see a short-term correction of the longer term uptrend, which is now taking place.
Traders respecting the longer term uptrend, will be looking for a bullish price reversal from the short-term correction underway for long entry into the dollar. A confluence of horizontal and trendline support is considered at around the 101.00 mark.
Should we not get a bullish price reversal before this level, and instead see a price close below, we would then be looking for long entry on a bullish price reversal closer to the 99.20 support level.
Shaun Murison | Senior Market Analyst, Johannesburg
24 May 2022


.jpeg.98f0cfe51803b4af23bc6b06b29ba6ff.jpeg)


0 Comments
Recommended Comments
There are no comments to display.
Create an account or sign in to comment
You need to be a member in order to leave a comment
Create an account
Sign up for a new account in our community. It's easy!
Register a new accountSign in
Already have an account? Sign in here.
Sign In Now