What is a Short Squeeze and How to Trade It?

Entry posted by MongiIG in Analyst Piece
1,431 views

The short squeeze has demanded the audience from many of the best investors and traders the world over, with some boastful about correct market predictions while others are humbled by the swift yet destructive nature that is the short squeeze. This article will outline the foundational concepts of the short squeeze while providing insight on how to manage and trade around this contentious financial market phenomena.
WHAT IS A SHORT SQUEEZE?
The definition of a short squeeze can be termed as the strain experienced by short sellers to cover (by buying to close) their respective positions due to a sharp rise in stock prices.
For example, Investor A borrows 10 shares of Company Z at $5 per share. A few days later, Company Z shares rise to $10 per share which means that Investor A is currently running a $50 loss. The logic behind a short squeeze is that when short sellers (individuals forecasting share price declines) run losing negative positions due to price appreciation, the domino effect of these investors buying back shares to close positions as to not incur further loss causes an exponential rise in stock prices.
A good example is the Volkswagen AG (VOW.DE) short squeeze of 2008 whereby Porsche purchased large volumes of Volkswagen shares driving up prices roughly fourfold ultimately causing short sellers to lose billions in the process. The chart below shows the relative price increase between Volkswagen AG and the German DAX index.
Volkswagen AG vs DAX Index:
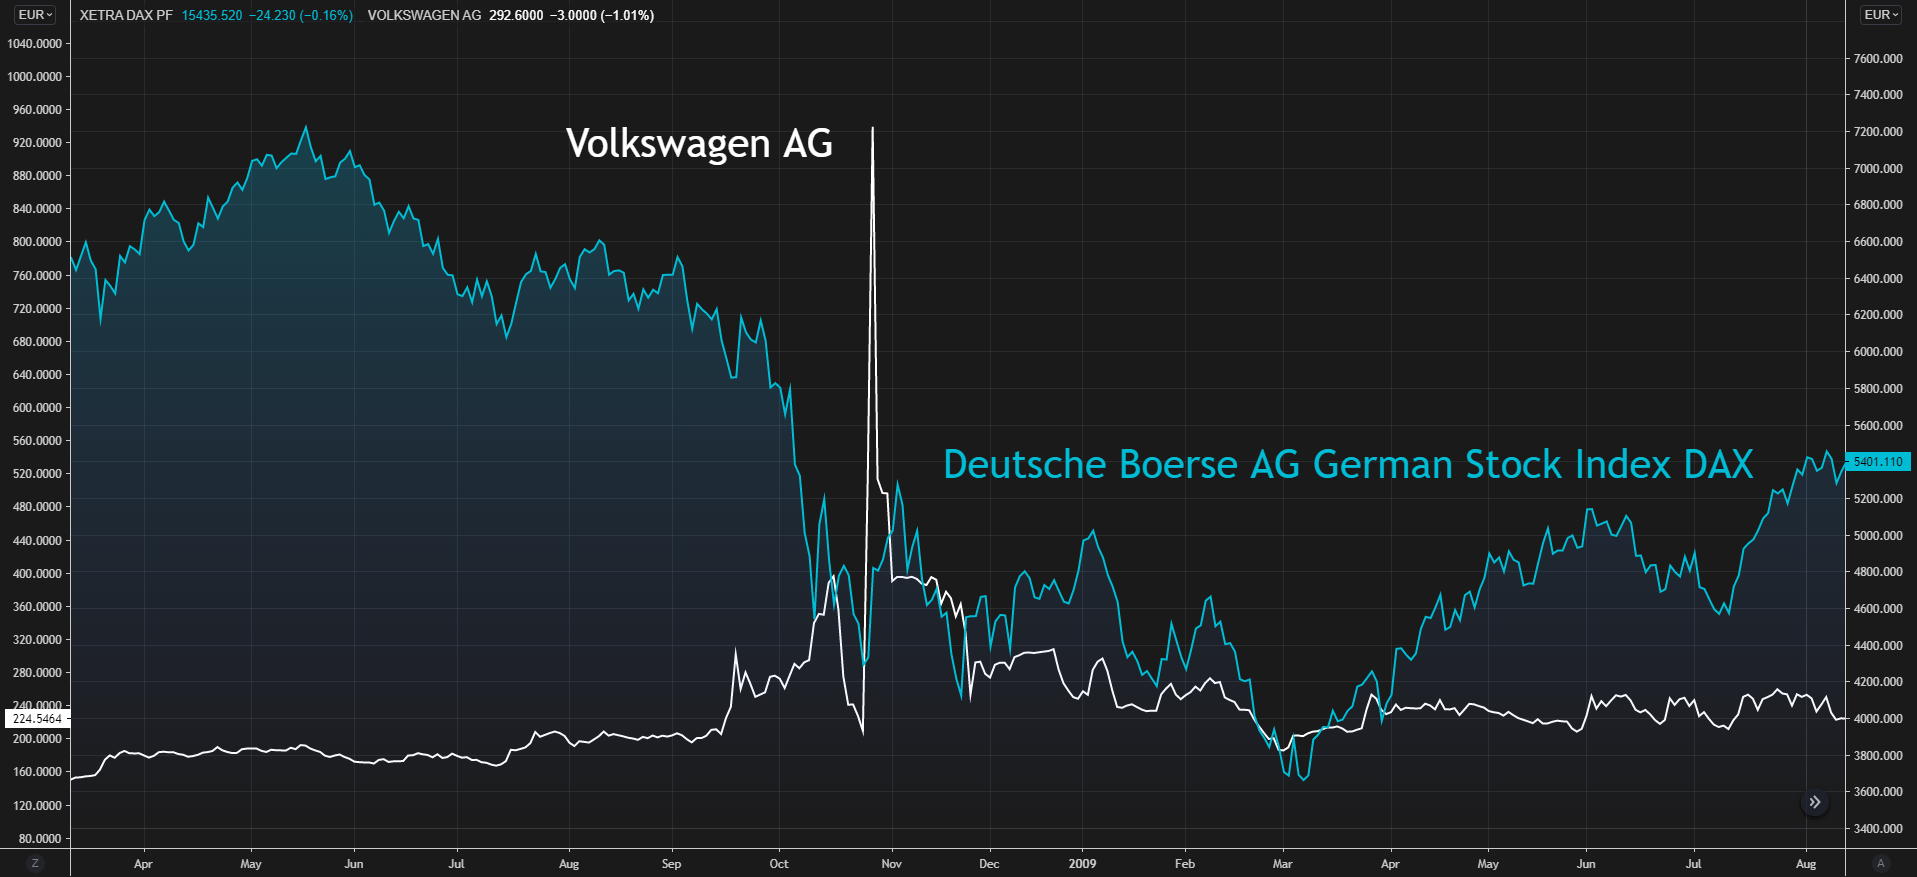
Chart prepared by Warren Venketas, Refinitiv
When many short sellers attempt to buy back simultaneously, there is no cap on how high stock prices may rise. This often gives rise to opportunistic investors trying to capitalize on the short squeeze by buying during the price ascension.
WHAT CAUSES A SHORT SQUEEZE?
From the explanation above we can summarize the events leading up to a short squeeze scenario in the list below:
- Investors identify what they believe to be an overvalued share and take short positions on the particular share – in expectation of a price drop whereby they may buy back the shares at a lower price (sell high, buy low).
- Share price moves in the adverse direction to investor forecasts causing a rapid price rise.
- Short sellers then realize that the position is not profitable and try to buy back shares at a minimal loss, thus causing further price escalation.
IS A SHORT SQUEEZE ILLEGAL?
According to the Securities and Exchange Commission short selling is illegal as the law states.
“Selling stock short and failing to deliver shares at the time of settlement with the purpose of driving down the security’s price. This manipulative activity, in general, would violate various securities laws, including Rule 10b-5 under the Exchange Act.”
HOW TO TRADE A SHORT SQUEEZE
Trading around a short squeeze (often prompted unlawfully by a large external third party) can be extremely dangerous and can result in significant financial loss. However, there are traders who use cautionary signals provided by market movements to forecast potential short squeezes. (To wit: the GameStop saga, which had traders on different sides of the action.) This high risk activity does carry the potential for high reward in certain cases. Some investors attempt to pre-empt an upcoming short squeeze by monitoring several key indicators. Primarily the main indicator would be:
Market Sentiment
Market sentiment reveals the markets inclination toward a specific financial instrument – in this case a share. The below are two potential methods of assessing, timing and interpreting possible signs of an impending short squeeze.
Short interest ratio:
This ratio simply put is a mathematical indicator that tells investors the average number of days it takes for short sellers to buy back borrowed shares. This ratio is calculated by the total number of shorted stocks divided by the average daily trading volume. For example, if there are 10000 shorted stocks on Company A with an average daily trading volume of 1000, then the short interest ratio would equal to 10. As a rule of thumb, a short interest ratio of 10 and higher is regarded as high and therefore the more short positions to cover – higher probability of a short squeeze.
Short interest percentage:
This percentage figure provides investors with a current gauge as to how many short sellers there are on a particular stock. That is, is there are 10000 short sellers on Company A with 1000000 outstanding shares then the short interest percentage figure would be 1%. The higher the figure, the more difficult it would be fore short sellers to buy back shares should prices increase.
HOW TO PROTECT AGAINST A SHORT SQUEEZE?
As mentioned, a short squeeze can cause large financial loss however, there are ways to mitigate excessive losses by means of two simple additives.
1. Stop loss: A stop loss is a level whereby a position will be closed should price hit a certain aforementioned level. For example, if a share is shorted at $10 a stop loss may be placed at $15 which means if the share price reaches $15 a purchase will ensue and the position will be closed at a loss of $5.
2. Hedging: This may seem counterintuitive as it is essentially netting off any gains however, purchase orders may be set in at a specified level to curtail losses up to a desired amount. For example, an order to buy the above share at $15 will effectively function as a stop loss.
Note: Traders should be aware of risks to stop loss orders. They are vulnerable to short-term fluctuations in price that could activate the stop price. All stop orders will be filled, though there is no guarantee of the price. What’s more, if your level is reached, your stop order cannot be filled at a better price than your stop, only the same price or worse, and this could impact your original risk-reward ratio.
Jul 26, 2022 | DailyFX
Warren Venketas, Analyst


.jpeg.98f0cfe51803b4af23bc6b06b29ba6ff.jpeg)


1 Comment
Recommended Comments
Create an account or sign in to comment
You need to be a member in order to leave a comment
Create an account
Sign up for a new account in our community. It's easy!
Register a new accountSign in
Already have an account? Sign in here.
Sign In Now