S&P 500 building on gains for second straight day: Brent crude, Nikkei 225, AUD/NZD

Entry posted by MongiIG in Market News
870 views
Major US indices ended on a positive note for the second straight day after a late-day push into the close, in anticipation of Fed Chair Jerome Powell’s speech at Jackson Hole today
 Source: Bloomberg
Market Recap
Major US indices ended on a positive note for the second straight day (DJIA +0.98%; S&P 500 +1.41%; Nasdaq +1.67%) after a late-day push into the close, in anticipation of Federal Reserve (Fed) Chair Jerome Powell’s speech at Jackson Hole today. A series of economic data pointing to some resilience may have underpinned the risk environment by pushing back against growth risks. For one, overall risk sentiments in pre-market were already drawing an uplift from Germany’s final estimate for quarter two (Q2) gross domestic product (GDP) growth, which saw an improved reading of 1.7% from its previous 1.4%. This is mirrored in the second estimate for US GDP growth rate for Q2 as well, which came in at a lesser contraction (-0.6%) from its preliminary estimate (-0.8%). Of note is the resilience in consumer spending being displayed with an upward revision (1.5% versus prior 1.0%). The weekly jobless claims figures also delivered a downside surprise, marking the third consecutive week where initial claims have come in lower than expected.
Along with the more upbeat economic data, a series of hawkish Fed comments has driven markets to further lean towards a 75 basis-point (bp) hike in the September Federal Open Market Committee (FOMC) meeting with a 63% chance. Fed voting member Esther George guided for rates above 4%, while James Bullard said he expects high inflation to be more persistent, and that the current interest rates are not high enough to begin curtailing price pressures. However, the further lean towards a 75 bp was not translated into overnight up-move for the US dollar and US Treasury yields, as some expectations could have been priced with their recent rallies. The lack of upside on both front aided to provide the go-ahead for risk sentiments overnight, but all eyes will be on Fed Chair Jerome Powell next to provide a lifeline from recent hawkish Fed comments. Failure to do so could be a catalyst for downside risk in the equities market.
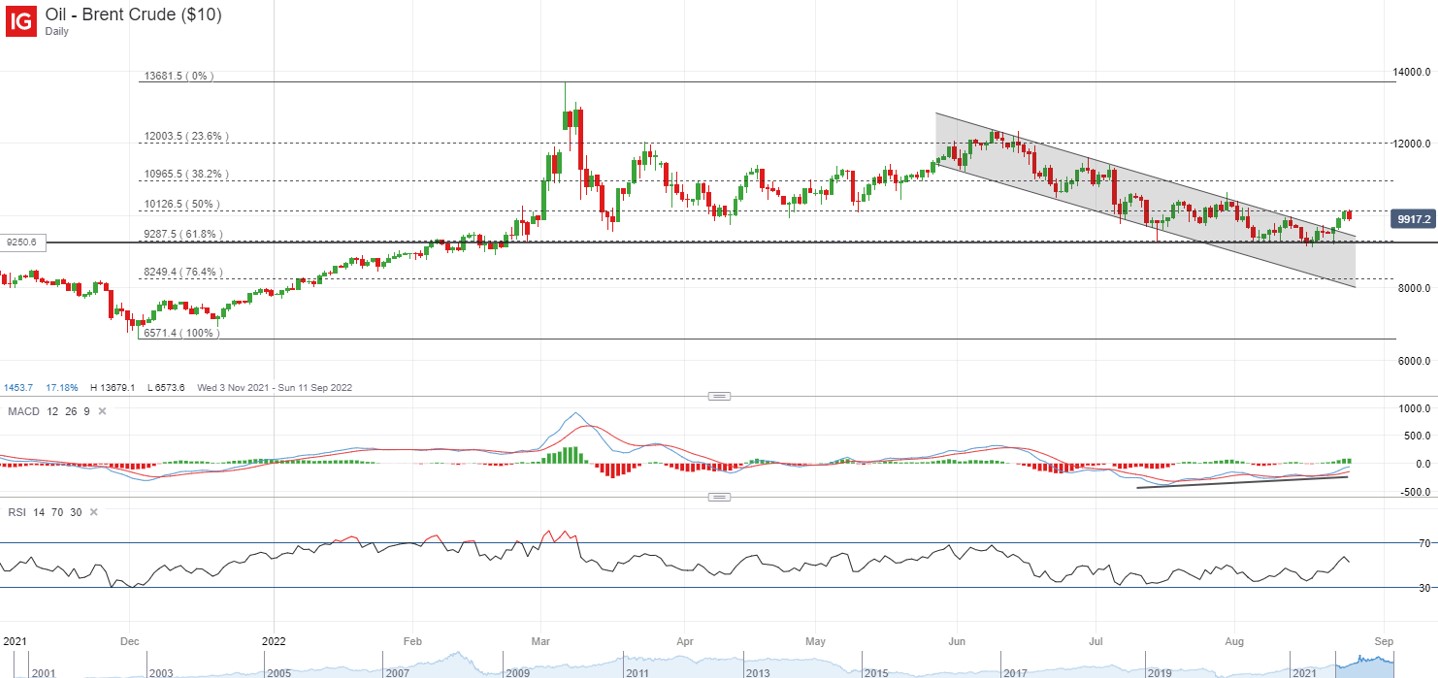
On another note, Brent crude prices are currently finding some resistance at a key 50% Fibonacci retracement around the key US$100 level, as talks to revive the Iran nuclear deal are ongoing. Having broken out of an ascending channel pattern this week, the formation of a new higher high still suggests an attempt for a near-term reversal in sentiments. While any resolution in the nuclear deal could bring additional supplies into the market, this will be weighed against an increased likelihood for production cuts in Organization of the Petroleum Exporting Countries Plus (OPEC+). One may watch for any formation of a new higher low in the event of a knee-jerk reaction to the downside, with the key psychological US$100 level being a key resistance to overcome ahead.
 Source: IG charts
Asia Open
Asian stocks look set for a positive open, with Nikkei +0.98%, ASX +0.50% and KOSPI +0.63% at the time of writing. Coming after a 700-point surge in the Hang Seng Index yesterday, the positive momentum was carried into the US trading session as well, with the Nasdaq Golden Dragon China Index up by 6.3% overnight. Optimism was greatly uplifted as some compromise may have been made in the talks between US-China to avoid the delisting of companies from US exchanges. Regulators in China are said to have told accounting firms to prepare to bring audit paperwork for US-listed Chinese companies to Hong Kong, where it can be reviewed by the US Public Company Accounting Oversight Board. While a resolution is still far from done, this move signals some willingness for cooperation, especially coming after some strained tensions from their mutual Taiwan relations. That helped to remove one key risk overhang for Chinese equities, at least in the near term.
The day ahead will leave a quiet economic calendar in Asia with the lead-up to Fed Chair Jerome Powell’s speech at Jackson Hole. Singapore’s industrial production data could be on watch, with expectations of some resilience from the previous month by delivering a 0.9% expansion. The YoY growth is expected to come in at 5.3% versus previous 2.2%.
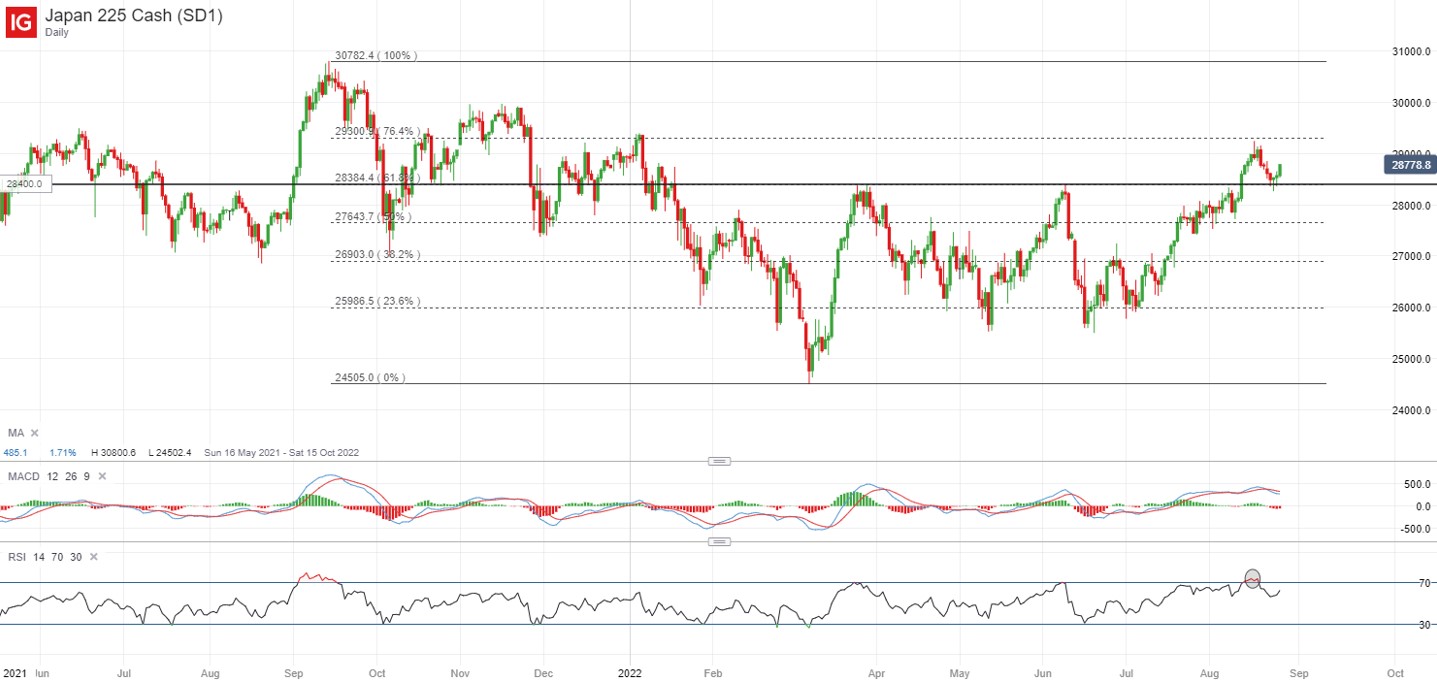
For the Japan 225, the 28,400 level has proven to be a line of resistance-turned-support, which coincides with a key 61.8% Fibonacci retracement level. The formation of a bullish hammer candlestick at that level, along with a follow-through over the past few days, suggest an ongoing attempt by equity bulls to retain its upward bias with a higher low. Further up-move could drive another retest of the 29,300 level next, where a 76.4% Fibonacci retracement has weighed on three previous occasions.
 Source: IG charts
On the watchlist: AUD/NZD at its highest level since December 2017, but can it last?
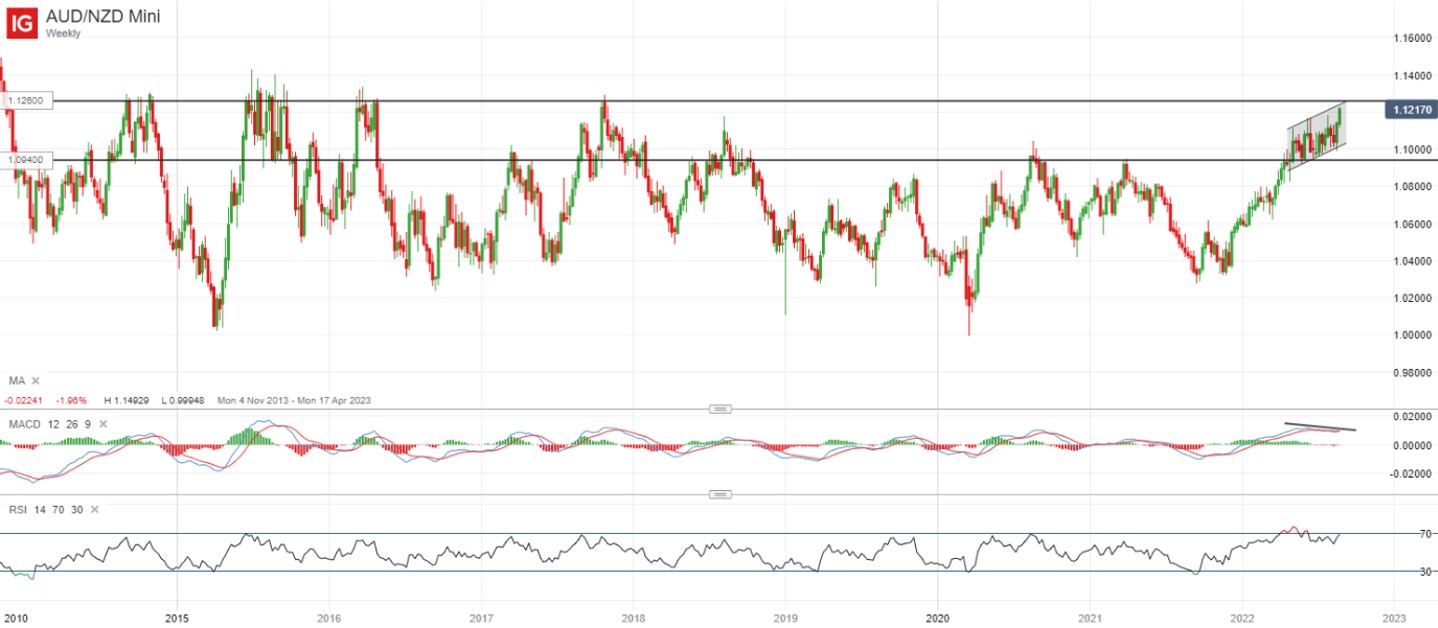
The AUD/NZD pair continues to push higher overnight, coming in at its highest level since December 2017. Some recovery in risk sentiments over the past two days have provided an uplift for the risk-sensitive Australian dollar while a dismay retail sales figure out of New Zealand weighed on the kiwi. Retail sales in New Zealand for the Q2 contracted 3.7% as overall consumer demand came under pressure from policy tightening efforts and elevated pricing pressures. Having traded within an ascending channel pattern on the weekly chart since May this year, a retest of the upper channel trendline resistance at the 1.126 level will be looked upon. That said, a bearish divergence on moving average convergence divergence (MACD) seems to suggest weaker upward momentum with this recent up-move and any failure at the channel resistance could see a move to retest the 1.104 level.
 Source: IG charts
Thursday: DJIA +0.98%; S&P 500 +1.41%; Nasdaq +1.67%, DAX +0.39%, FTSE +0.11%


.jpeg.98f0cfe51803b4af23bc6b06b29ba6ff.jpeg)

0 Comments
Recommended Comments
There are no comments to display.
Create an account or sign in to comment
You need to be a member in order to leave a comment
Create an account
Sign up for a new account in our community. It's easy!
Register a new accountSign in
Already have an account? Sign in here.
Sign In Now