Ethereum merged: what happened and where to from here?

Entry posted by ArvinIG in Analyst article
1,657 views
We review the events of the week and where Ethereum goes from here.
Last week was a historic one for Ethereum and the cryptocurrency industry more broadly. As we discussed here in the past, Ethereum has undergone its so-called “merge”, where the network went from proof-of-work to proof-of-stake.
In this week’s Crypto Verse, we review the event and what means for Ethereum, then take a look at recent price action for Ether and the Bitcoin/Ethereum cross.
The merge - reviewing the event
To put it simply: the merge was successful. The act itself was described as being like trying to change the engine of a jumbo jet mid-flight. If that was the favoured metaphor for the event, then it all went smoothly. Ethereum founder Vitalik Buterin to Twitter on Thursday last week to laud the success.
“And we finalized! Happy merge all. This is a big moment for the Ethereum ecosystem.”
Source: Twitter
Where to from here for Ethereum?
The purpose of the merger was to make the Ethereum network more sustainable and eco-friendly. It is estimated that the move to proof of work will cut the network’s carbon emissions by almost 99.99%, addressing one of the major objections to cryptocurrencies’ viability.
That puts it at a possible competitive advantage against its main rival, Bitcoin, which continues to operate in a far more energy-intensive fashion.
It’s a matter of content whether the cryptocurrency industry’s overall emissions will be reduced by virtue of the merger. While the Ethereum network will be far less “dirty”, it’s expected that profit-seeking miners will shift focus to other crypto-currencies which operate based on a proof of work model. On the day of the merge, the hash rate - or the computing power used by a cryptocurrency network - surged for the likes of Ethereum classic, Ergo and Ravencoin.
Nevertheless, given Ethererum’s prominent role in facilitating transactions of smart contracts, including NFTs and other digital assets, the merge marks a big leap forward for both the network and cryptocurrency.
Technical analysis of the Ethereum price
Ether tumbled following the finalization of the merge, having rallied into the event. While it’s tempting to attribute the move to something to do with the merge, more than likely, it was more a reflection of narrative and sentiment - that is, a buy-the-rumour-sell-the-fact dynamic.
A nine percent plunge on the day of the merge and a steep weekly decline has pushed Ether’s price in the direction of its primary downtrend. Crucially, the price has also pushed below technical support at $1400. The next key levels to watch are around the 200-week MA, and below that, support at around $850.
Ether weekly chart
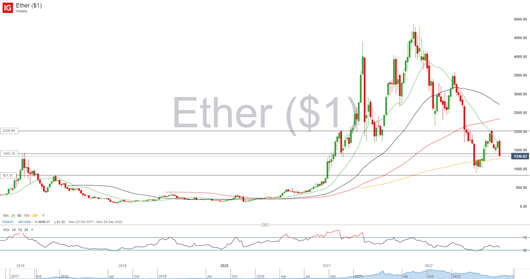
Source: IG
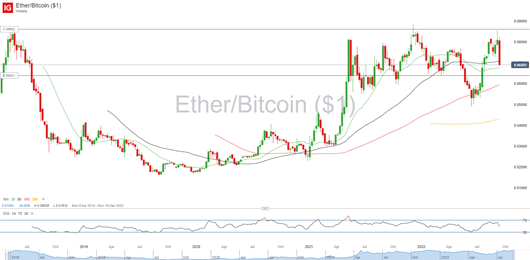
Technical analysis of BTC/ETH
The divergence in performance between Bitcoin and Ethereum reversed last week, with the Ether/Bitcoin cross rejecting resistance at its all-time high. Price has reverted to the 20- and 50-week moving averages, as momentum turns to the downside. The next level of support looks to be around 0.064.


.jpeg.98f0cfe51803b4af23bc6b06b29ba6ff.jpeg)


0 Comments
Recommended Comments
There are no comments to display.
Create an account or sign in to comment
You need to be a member in order to leave a comment
Create an account
Sign up for a new account in our community. It's easy!
Register a new accountSign in
Already have an account? Sign in here.
Sign In Now