Positive footing to start the fourth quarter: S&P 500, Brent crude, AUD/JPY, GBP/USD
With the seasonally weaker month of September behind us, US indices managed to kickstart the fourth quarter on a positive footing.
 Source: Bloomberg
Market Recap
With the seasonally weaker month of September behind us, US indices managed to kickstart the fourth quarter on a positive footing (DJIA +2.66%; S&P 500 +2.59%; Nasdaq +2.27%), with oversold market breadth indicators and technical conditions supportive of some long-awaited relief. The trigger for the overnight bullish moves came from the severe underperformance in the US September manufacturing Purchasing Managers' Index (PMI) data (50.9 versus 52.2 forecast), with markets finding comfort that the faster-than-expected moderation in economic conditions seems to be in line with the Federal Reserve (Fed)’s direction of ‘more pain’ and bolster the chances for a quicker policy pivot. The backdrop for market sentiments now may be the narrative that ‘bad news for the economy is good news for the markets’. That could provide a clue for the series of labour market data up for the rest of the week, where a lower-than-expected US job gains figure may be preferred by equity bulls to challenge the Fed’s frontloading of hikes.
US Treasury yields reacted to the downside on the data, with the US 10-year yields down 16 basis-points (bps) and the two-year yield lower by 10 bps. Their respective bearish crossover on moving average convergence divergence (MACD) overnight suggest that the momentum could continue to the downside in the near term, which may support further equities’ upside. Some of the sub-readings from the PMI data of note could be the further moderation in manufacturing prices for the fourth straight month (51.7 versus 51.9 expected), new orders (47.1) and employment (48.7) are in contractionary territory. While PMI employment figures may not necessarily go hand-in-hand with the US non-farm payrolls, the surprise contraction is looked upon as a sign that upcoming job gains could be lacklustre, which could be what markets want to see now.
Tesla’s share price was dragged lower by more than 8.5% with its lower-than-expected delivery of cars in the third quarter. Credit Suisse also took the market spotlight, falling as much as 11.5% on concerns of its liquidity and capital positions ahead of its business restructuring. They have since managed to push back against those fears for now, with its share price just barely down by 0.9% by the close.
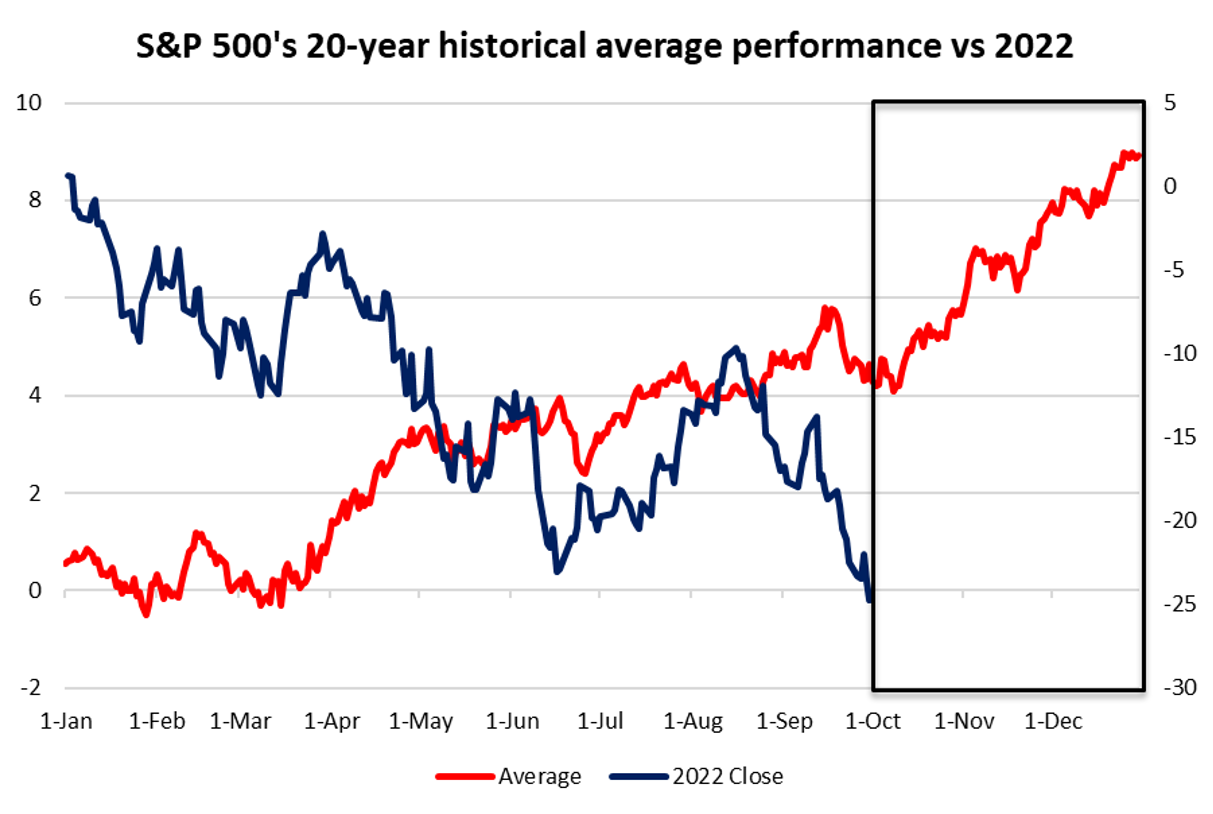
The past 20-year historical average performance for the S&P 500 suggests that we may be heading into a seasonally stronger quarter, but generally with November being the month with more positive upside. While seasonality is surely not a definite guide for market performance, especially when this year carries a huge increase in volatility, it may aid to provide a more lukewarm backdrop for risk sentiments towards the rest of the year.

Ahead of the Organization of the Petroleum Exporting Countries Plus (OPEC+) meeting, hopes of an output cut has supported oil prices overnight, with Brent prices at its one-week high. However, a key test will lie at the US$92.50 level, which marks a closely-watched support-turned-resistance level. A retest of the level on two occasions in September was met with a bearish rejection. Thus far, recession risks have pushed oil prices into a downward channel since June this year, and trading within the channel will leave the formation of any lower high on watch.
 Source: IG charts
Asia Open
Asian stocks look set for a positive open, with Nikkei +2.13%, ASX +2.32% and KOSPI +1.79% at the time of writing. China and Hong Kong markets are closed for holiday. The surge in Wall Street calls for some relief after equities were sold heavily over the past month, with equity futures seeing some positive follow-through as well. The day ahead will leave the Reserve Bank of Australia (RBA) meeting on watch, with market participants having a slight lean towards a 50 bp rate increase. Previous guidance that the RBA is getting closer to a ‘neutral’ rate has prompted some bets for a 25 bps but any delivery of that may be a negative surprise for the Australian dollar, when global central banks are still attempting to catch up with the Fed’s hiking process.
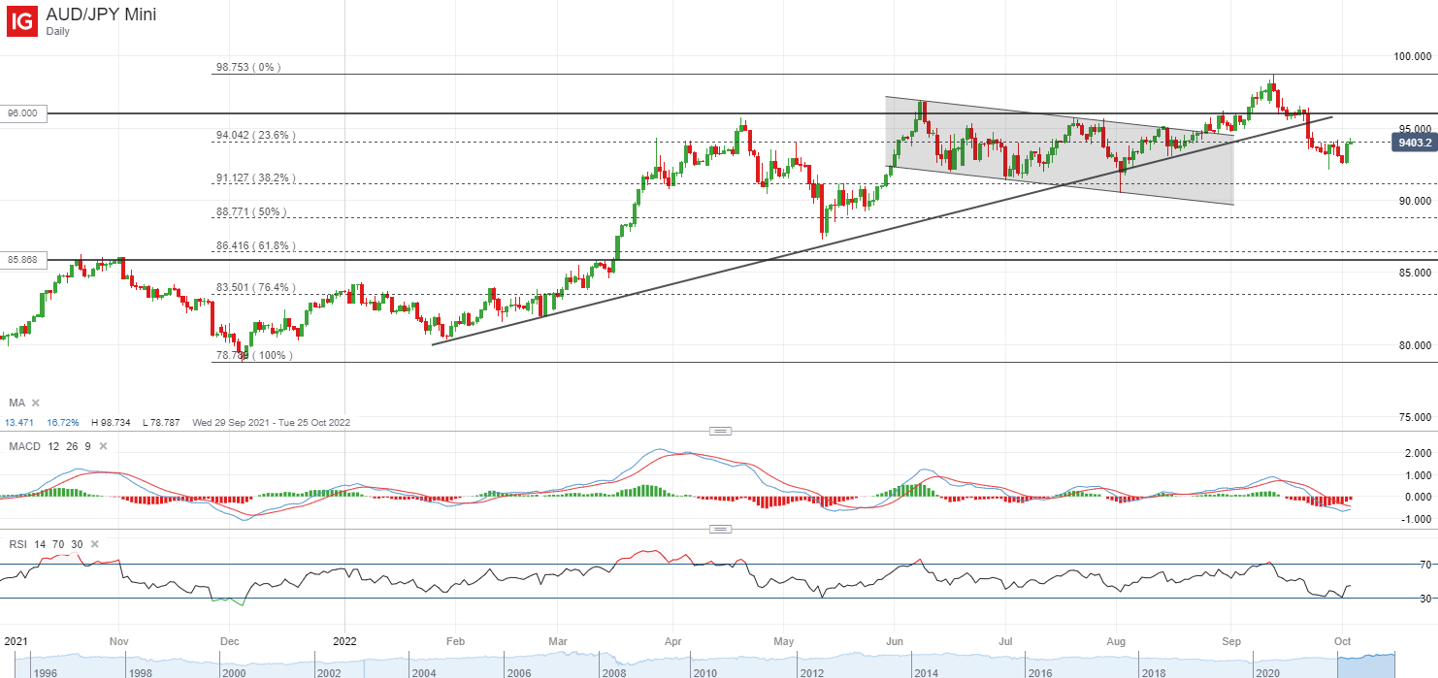
The AUD/JPY is on some wait-and-see this morning, after being provided a lift from the improved risk environment yesterday. A retest of key resistance at the 94.126 is in place, which marks a 23.6% Fibonacci retracement. Much will depend on whether we could obtain any guidance of a moderation in interest rates from the RBA towards the rest of the year.
 Source: IG charts
On the watchlist: GBP/USD recovered all losses spurred by previous turmoil of tax cut plans
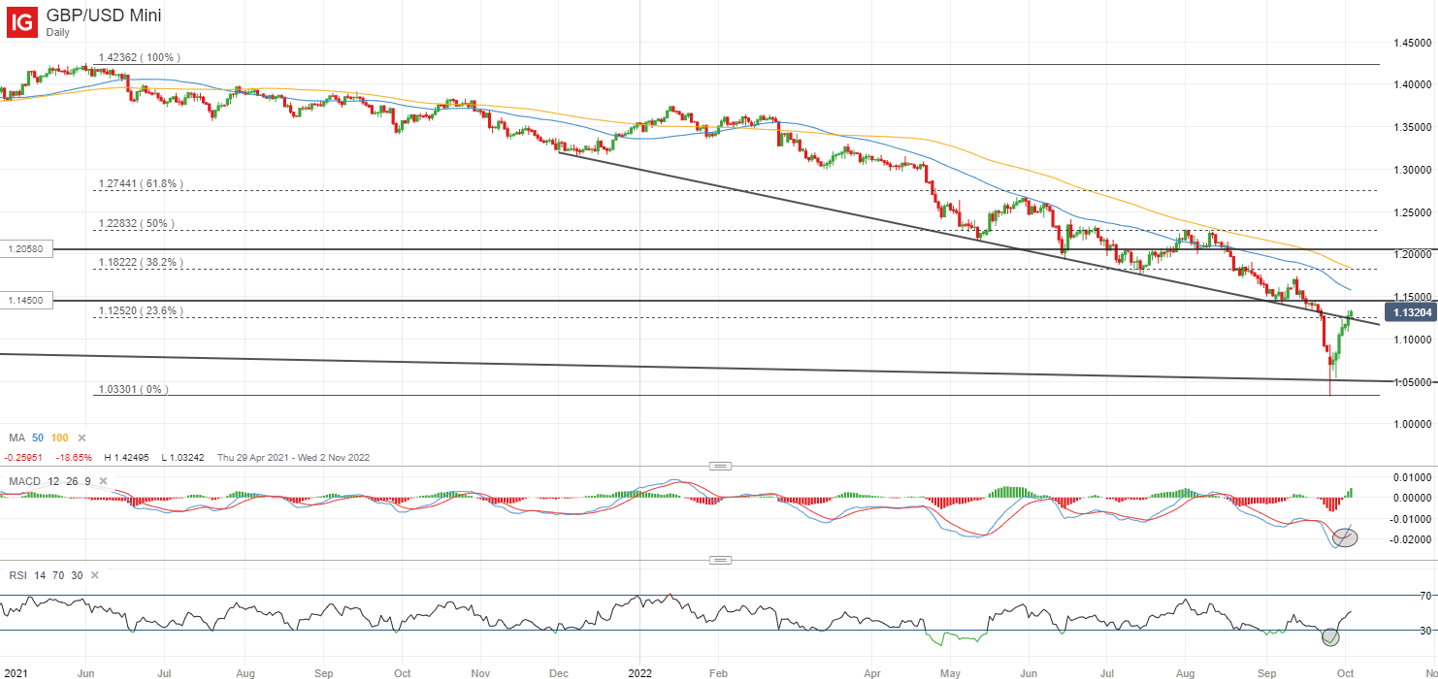
News that the UK government would reverse its plans to cut the highest rate of income tax has lifted the GBP/USD to its highest level since 22 September, with the pair recovering all of its previous turmoil from the introduction of tax cut plans. For now, the pair has managed to break above the 1.125 level, which marks a confluence of resistance from a downward trendline and a 23.6% Fibonacci retracement. The level will now serve as a level of support. That said, the overall downward trend for the pair still remains in place, while the removal of the top rate of tax only made up around two billion out of the 45 billion pounds of unfunded tax cuts. Looming recession risks into the fourth quarter, along with the ongoing tussle in the new government’s economic plans, suggest that uncertainty will continue, which may eventually cap the pound’s upside. The next level of resistance on watch will be at 1.145.
 Source: IG charts
Monday: DJIA +2.66%; S&P 500 +2.59%; Nasdaq +2.27%, DAX +0.79%, FTSE +0.22%


.jpeg.98f0cfe51803b4af23bc6b06b29ba6ff.jpeg)
0 Comments
Recommended Comments
There are no comments to display.
Create an account or sign in to comment
You need to be a member in order to leave a comment
Create an account
Sign up for a new account in our community. It's easy!
Register a new accountSign in
Already have an account? Sign in here.
Sign In Now