Hang Seng Index: is China’s reopening losing its momentum?

Entry posted by MongiIG in Market News
186 views
Hang Seng Index was in the red for two consecutive weeks and concluded the first half of February with a more than 7% decline. Is Hang Seng losing it momentum after an eye-widening 50% jump in three months?
 Source: Bloomberg
Hang Seng Weekly Review
Hang Seng index has declined by more than 7% in the first two weeks of February after soaring as much as 55% from late October. It appears that, Hong kong’s major index is losing some momentum in the new month after skyrocketing on China's reopening story.
Caution prevailed as more economic data from China challenged the optimism over China's recovery journey after three-years' "Covid Zero" setup. As such, unlike the rest of the world, China's lower-than-expected inflation print was hardly viewed as good news in the market.
According to the recently released data, Chinese's consumer price index (CPI) grew at an annualized 2.1%, more than 1.8% in December but below expectations of 2.2%. While the reading reflected the ongoing recovery after the abrupt COVID relaxing, it also indicated that the economic uncertainty was holding consumers back.
To add to the disappointment, China's Producer Price Index (PPI) contracted by an annual rate of 0.8% in January, which was not only lower than the expected drop of 0.5% but worse than the December reading, suggesting that the manufacturing sector continues to face significant pressure.
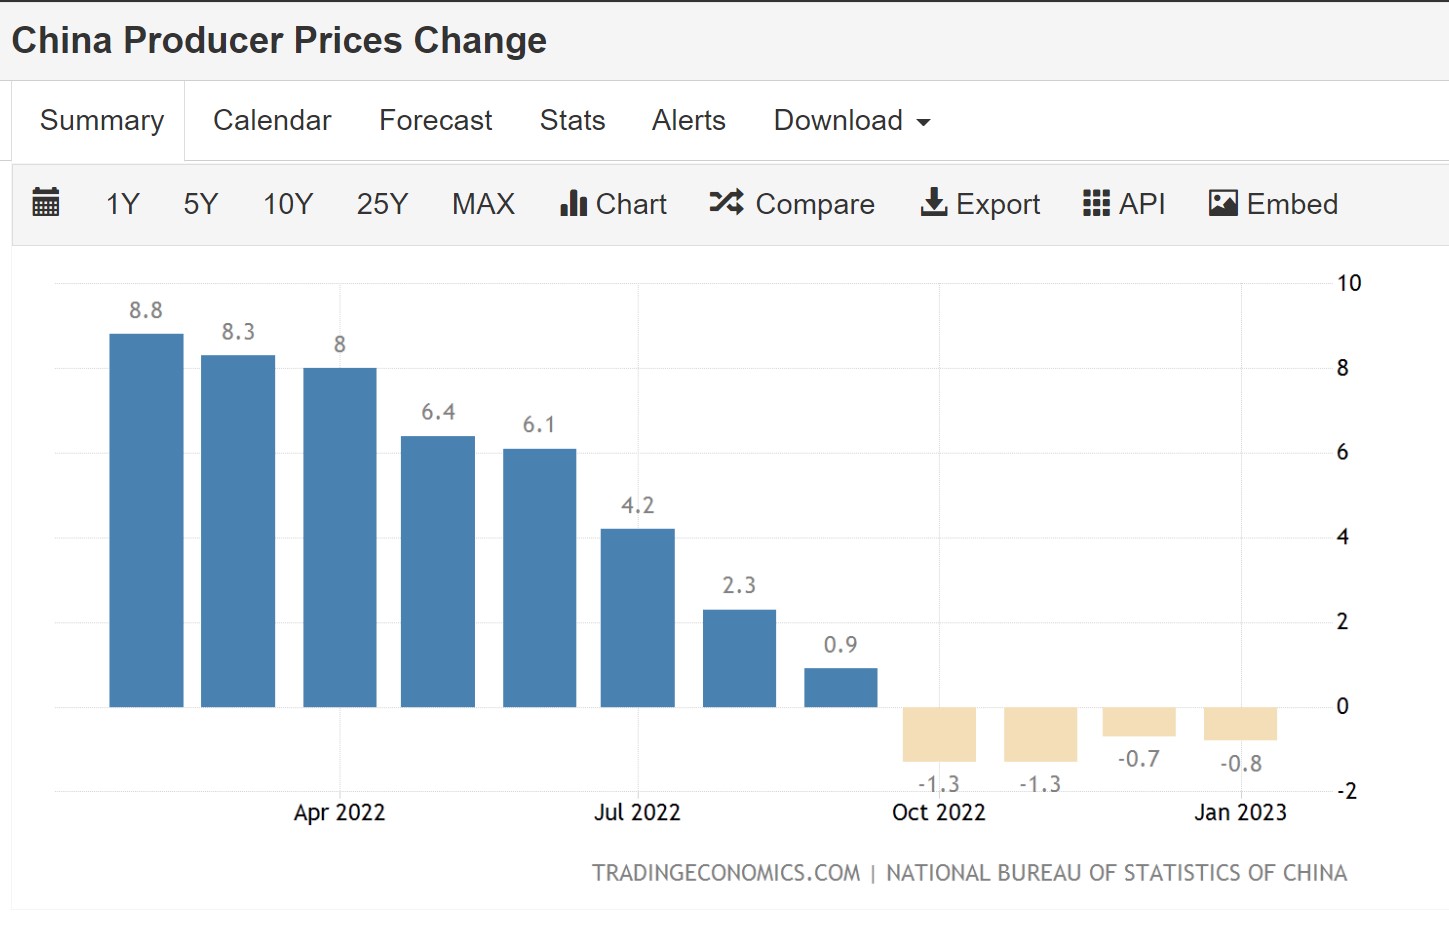 Source: Tradingeconomics
In fact, the question over whether China's recovery journey could meet the lofty expectation is poised to be a key discussion for the rest of the month. On March 5th, China will reveal its draft plan on national economic and social development, which will be the first time for China's new leadership team to demonstrate its economic strategy to the rest of the world.
Although China's economy is anticipated to expand 5% this year, according to IMF's latest projections, versus 3% last year, there won't be a lack of economic challenges for the nation. The vision from China's top policymakers, especially President Xi, will undoubtedly impact the market's confidence in China-related equities broadly.
Hang Seng Technical Analysis
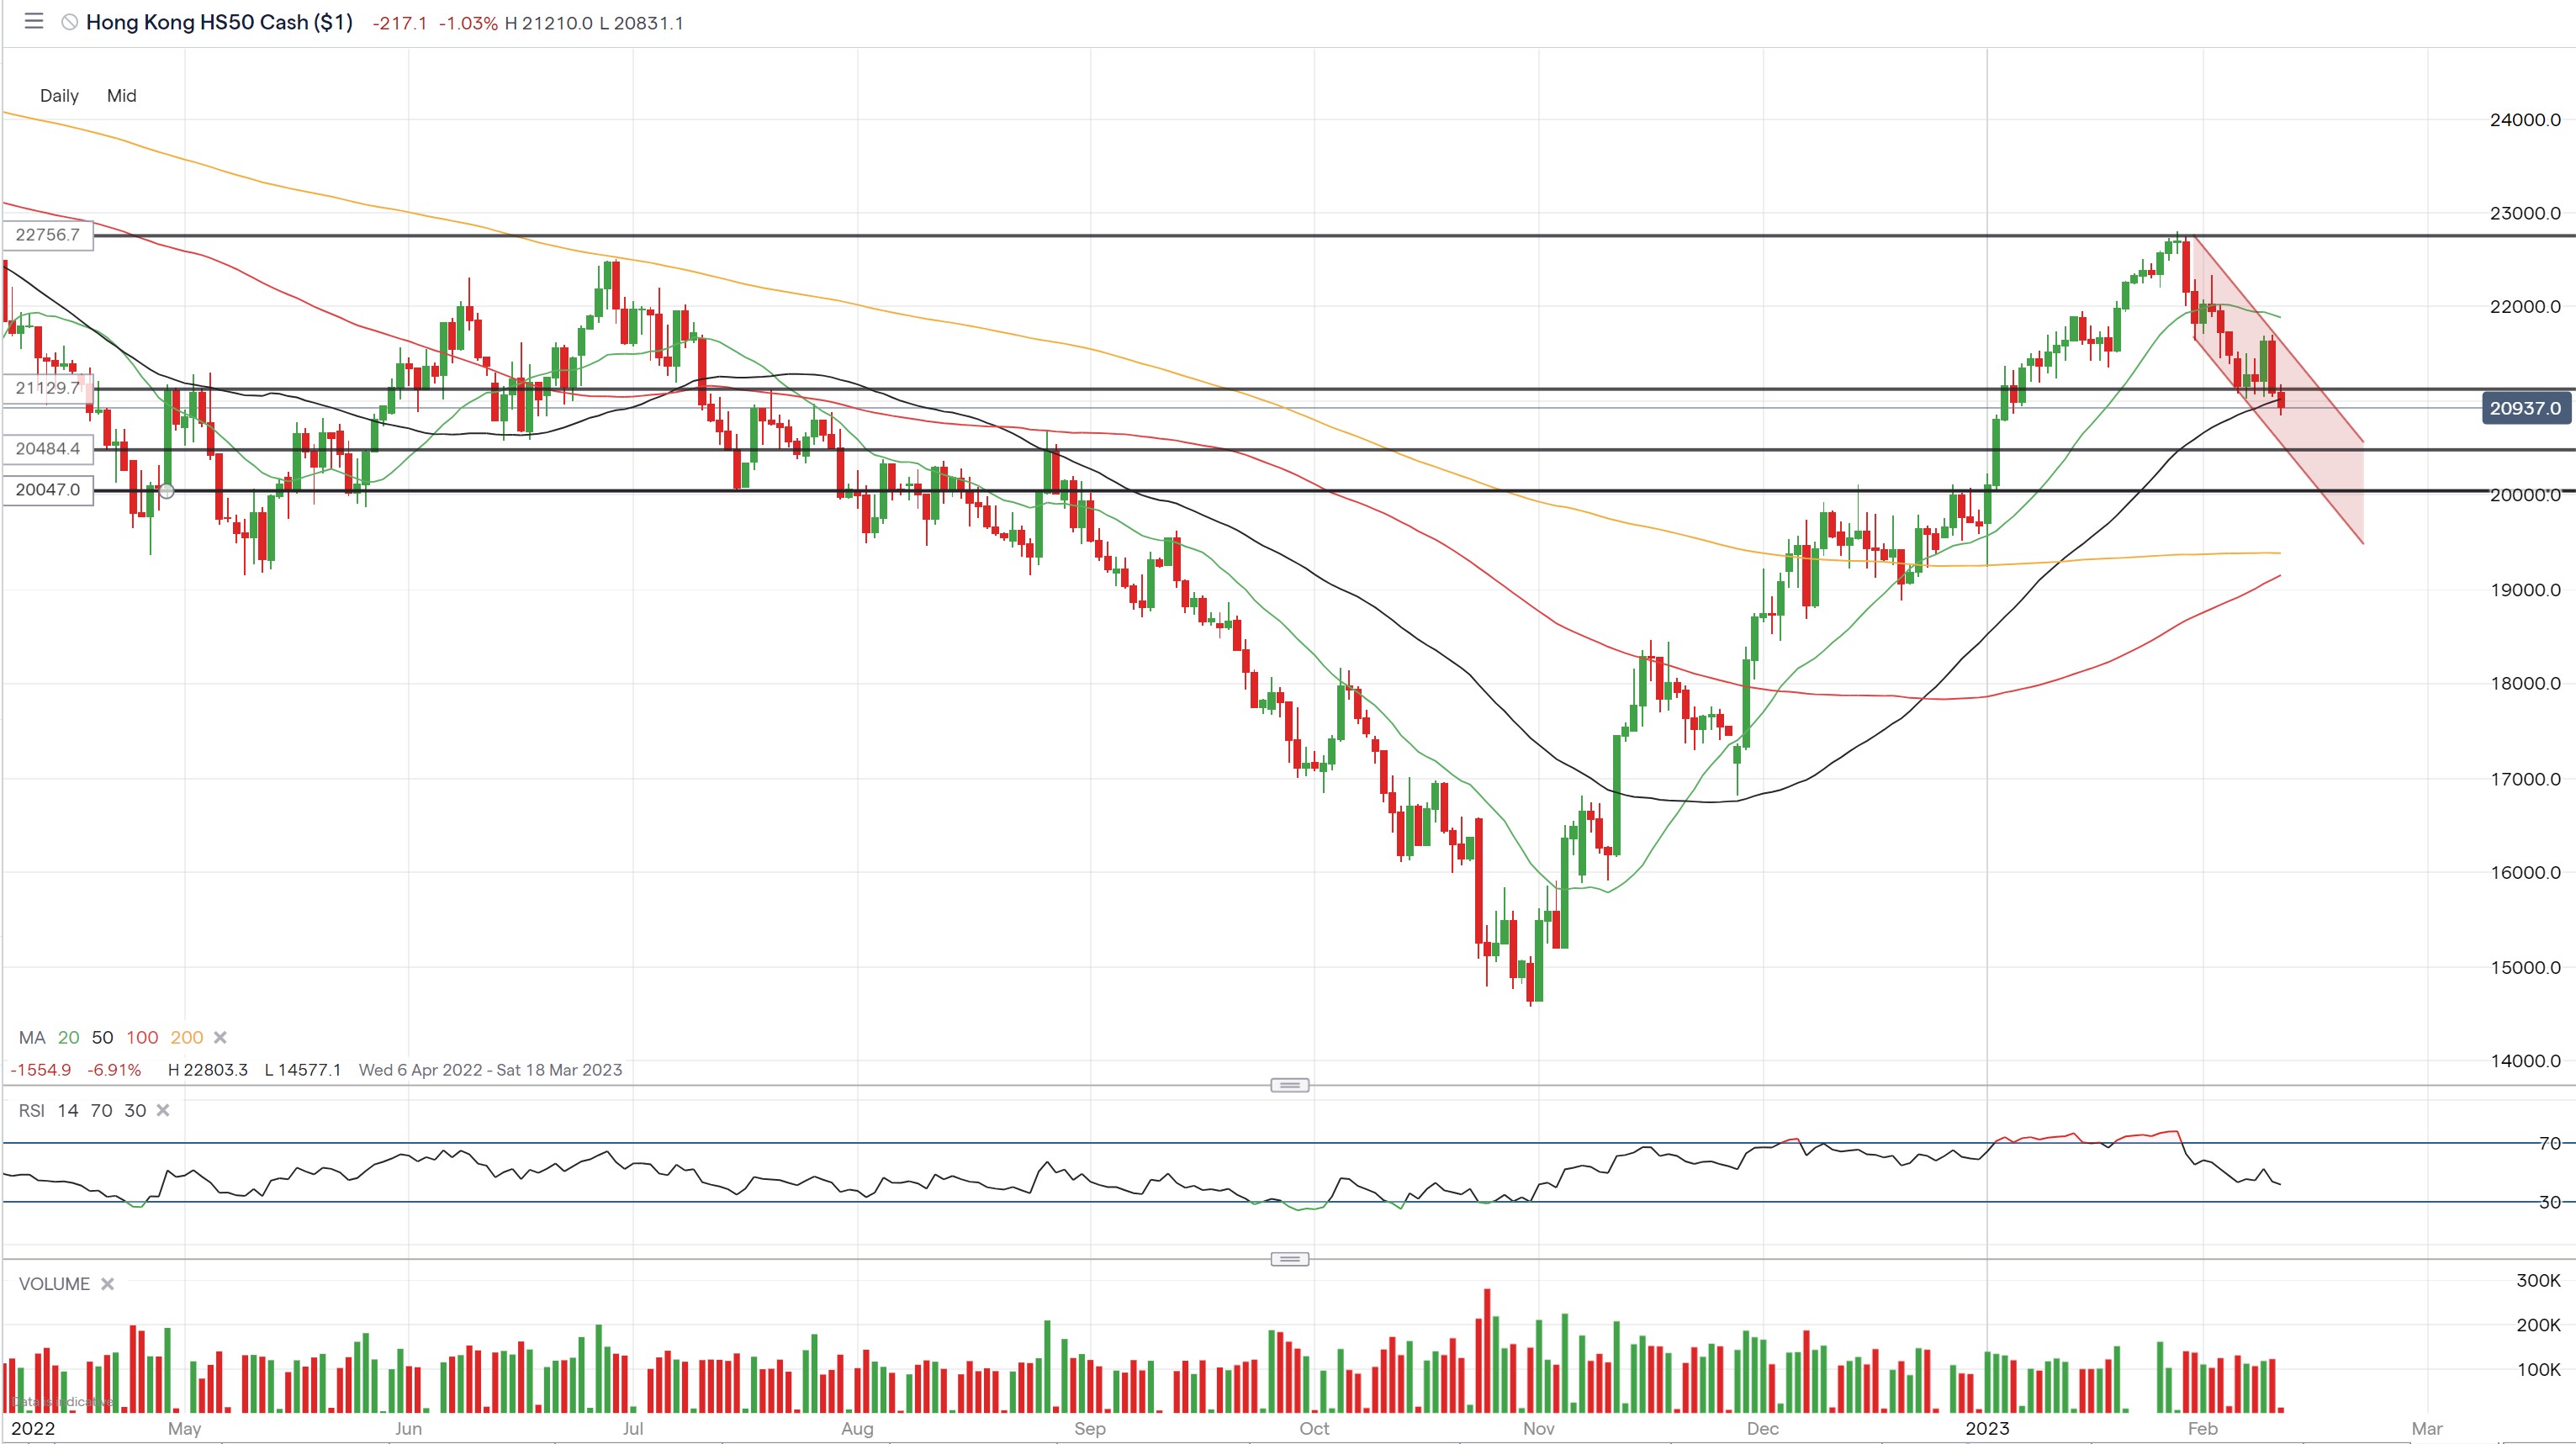
From a technical point of view, the Hang Seng index has followed a descending trajectory for the past two weeks. By the end of last week, the price of Hang Seng Index touched on the key support from 50-day MA. This could mean that the declines could take a near-term breather and turn into a brief consolidation in the new week.
Down below, the September 2022 high of 20484 should slow or stop the further decline. However, a break below that point would open the floor to the critical psychological level at 20000. From the momentum point of view, it appears that the buyers’ appetite has faded substantially as the RSI is moving toward its lowest level since November.
Hang Seng Daily Chart


.jpeg.98f0cfe51803b4af23bc6b06b29ba6ff.jpeg)

0 Comments
Recommended Comments
There are no comments to display.
Create an account or sign in to comment
You need to be a member in order to leave a comment
Create an account
Sign up for a new account in our community. It's easy!
Register a new accountSign in
Already have an account? Sign in here.
Sign In Now