S&P 500, Nasdaq back to retest their respective 200-day MA: Nasdaq 100, Hang Seng Index, US dollar

Entry posted by MongiIG in Market News
275 views
Another blowout reading in the US core PCE price index kept the pressure on the risk environment to end last week, as rate hike expectations saw another round of hawkish recalibration in its aftermath.
 Source: Bloomberg
Market Recap
Another blowout reading in the US core Personal Consumption Expenditure (PCE) price index kept the pressure on the risk environment to end last week, as rate hike expectations saw another round of hawkish recalibration in its aftermath. A bump higher in the core pricing pressures to 4.7% year-on-year from the previous 4.4% went head-on with expectations for the ‘disinflation process’ and provided some validation for a higher-than-before peak rate at the 5.5%-5.75% range. The sharp rebound in US consumer spending on stronger wage gains did not help matters as well when inflation persistence is the story, with the pressure for the Federal Reserve (Fed) to do more in policy tightening outweighing optimism of a ‘soft landing’ for now.
US Treasury yields continued their ascent, providing some support for the US dollar, which is just 1.2% away from retesting its key 200-day moving average (MA). That has translated into further pressure on gold and silver prices, both pushing to their multi-month lows as expectations for a ‘dovish pivot’ fade. This week, a series of Purchasing Managers' Index (PMI) figures out of the US and China will be in focus. With recent upside surprise in US inflation, market sentiments could seem to react positively to weaker economic conditions, particularly for services prices which has been the focus from the Fed lately.
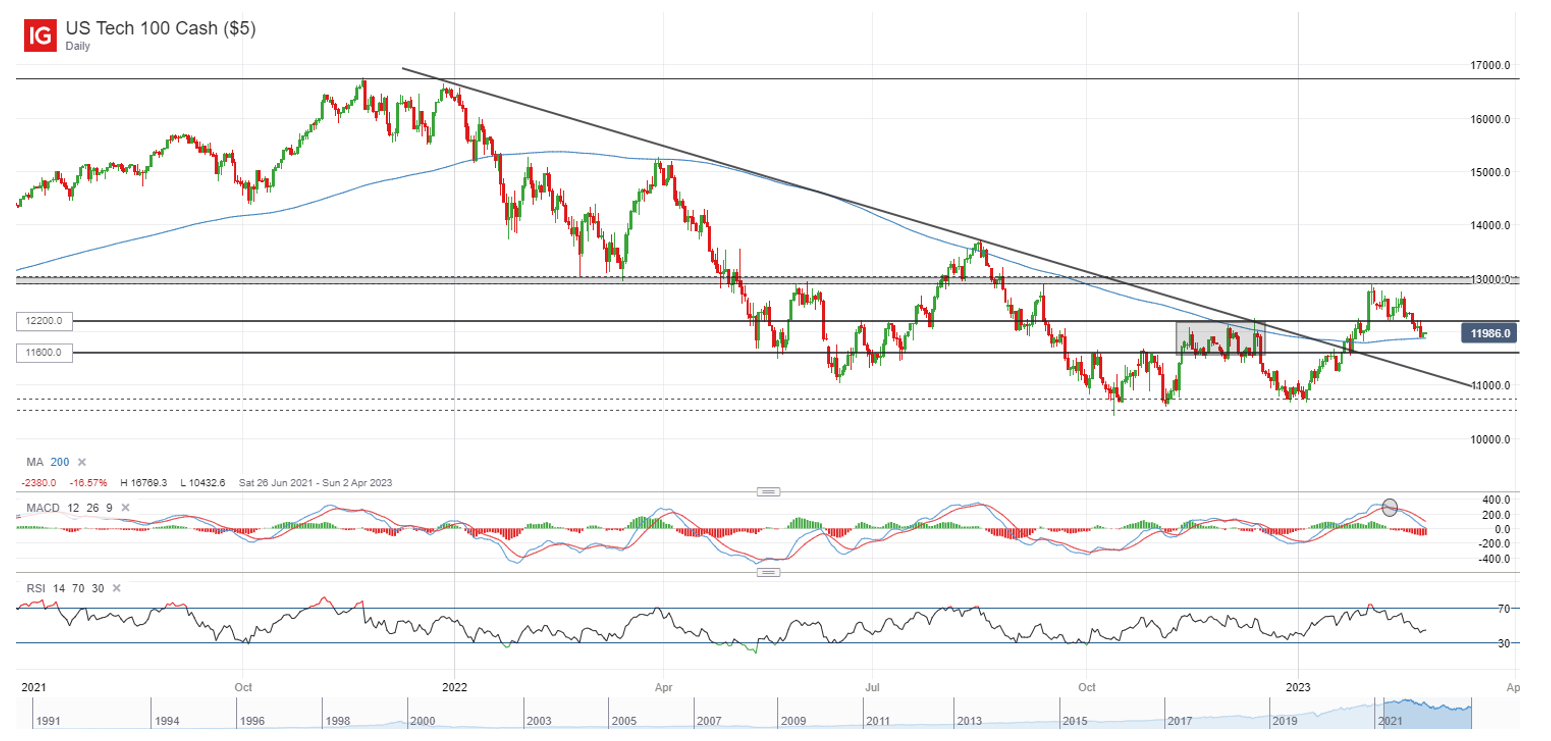
After recent downside, both the S&P 500 and Nasdaq 100 index are back to retest their respective key 200-day MAs, where previous dip-buying was spotted in late-January this year. Defending the MA-line could be key in retaining its longer-term upward bias. For the Nasdaq 100, the chances for the formation of a higher low remains intact for now, but a move back above the 12,200 level could have to play out over the coming days to support this narrative.
 Source: IG charts
Asia Open
Asian stocks look set for a negative open, with Nikkei -0.36%, ASX -1.40% and KOSPI -1.43% at the time of writing, largely following through the negative momentum in Wall Street to end last week. The Nikkei continues to see some holding-up in today’s session, potentially still riding on the previous dovish tone from the incoming head of the Bank of Japan (BoJ) in maintaining its ultra-loose policies. While his words provided some reassurances of a no-change in supportive policies for the near term, a rate hike in the July meeting remains the consensus, as an eventual shift away from its dovish policies is a question of when and not if.
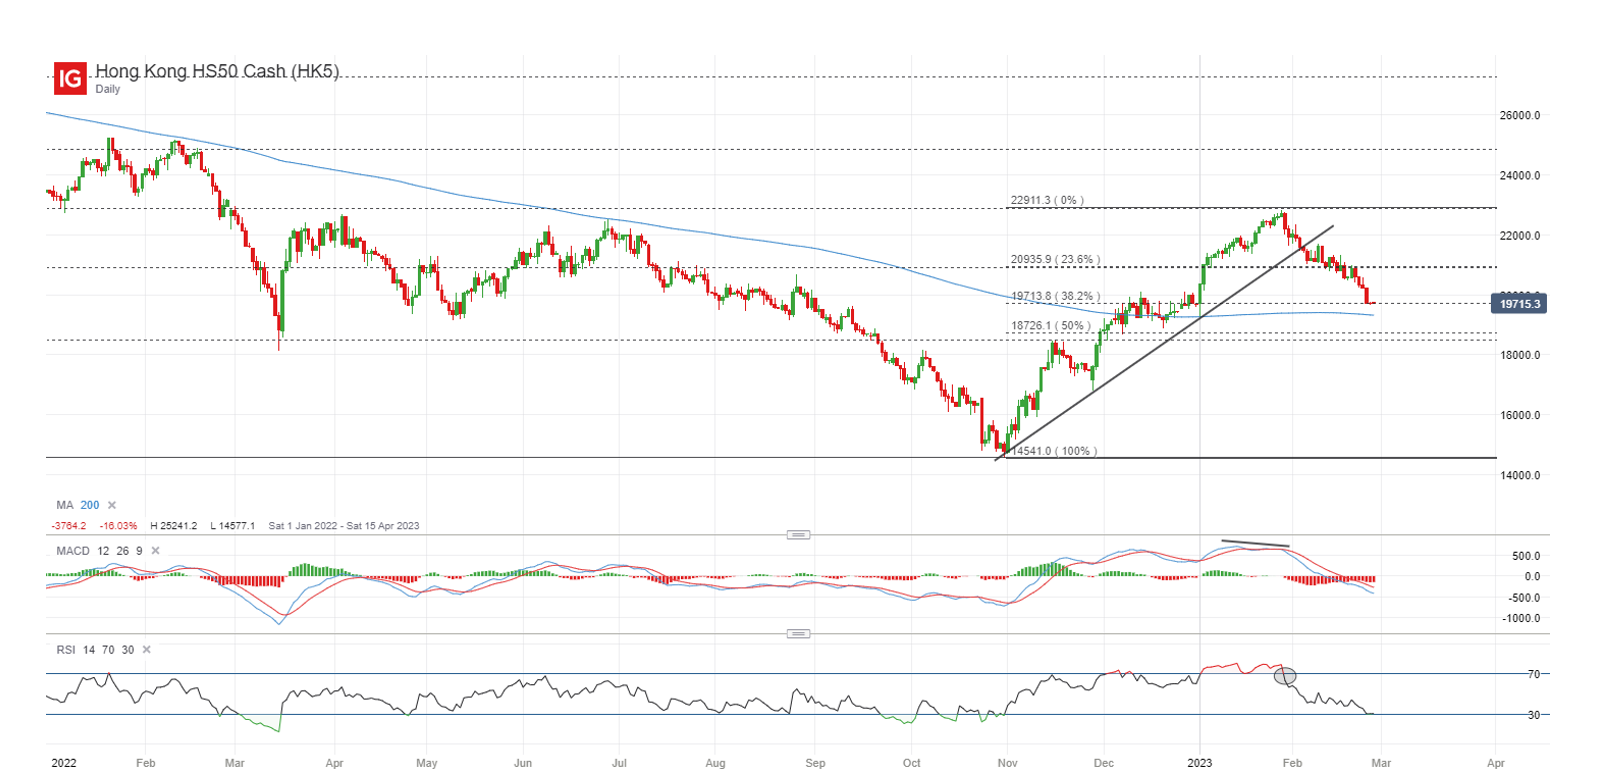
For the Hang Seng Index, after having retraced more than 13% over the past one month, a series of support lines seems to stand ahead. The index is currently hovering at a key 38.2% Fibonacci retracement level, with its 200-day MA just hanging slightly underneath. Any formation of a higher low could still be on watch, but the 200-day MA will have to see some holding-up at the 19,300 level over the coming days. China’s PMI figures will be released this week, which could be looked upon to further validate the promising recovery in China’s economic conditions with its economic reopening.
 Source: IG charts
On the watchlist: US dollar index heading for near-term resistance
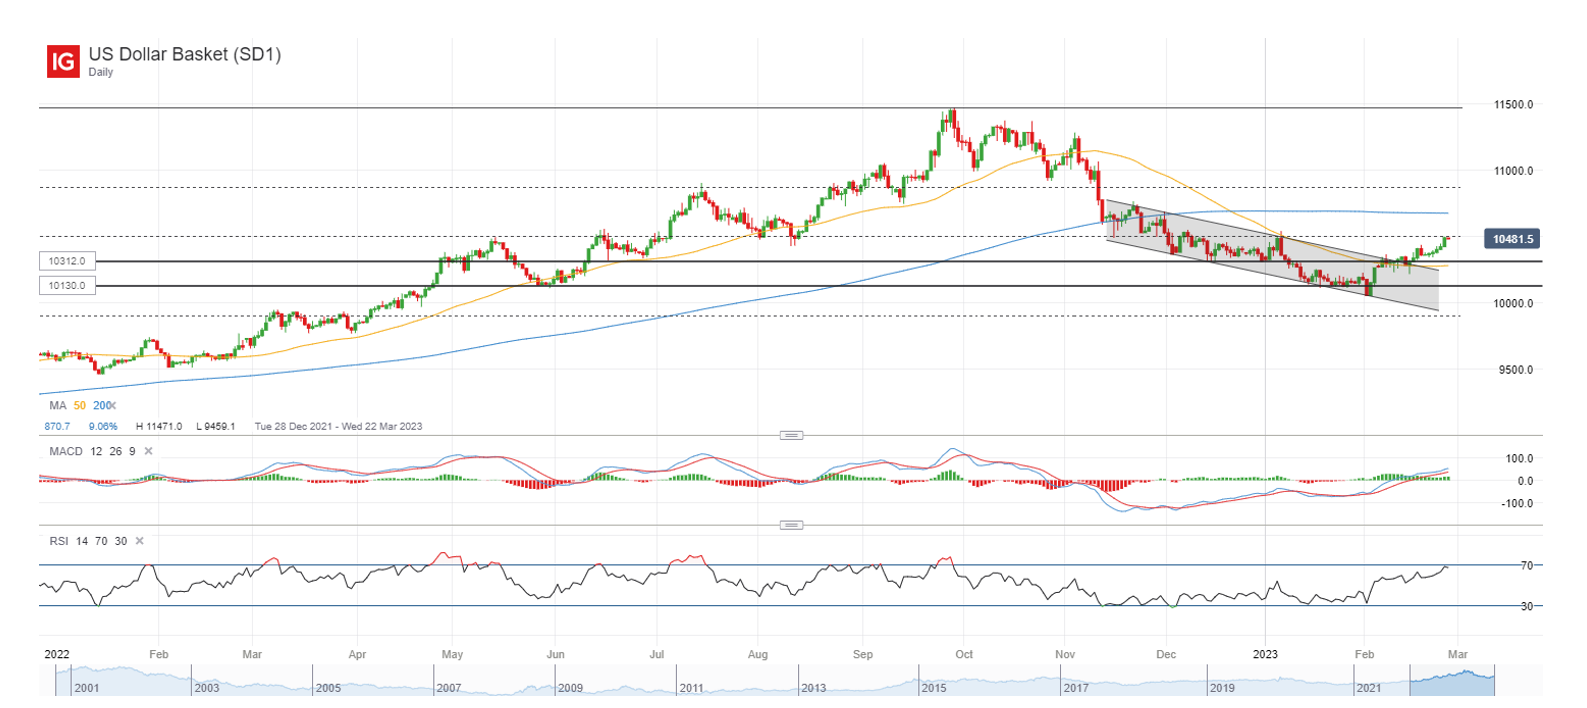
Rising US Treasury yields on the back of more hawkish rate expectations have been supportive of the US dollar since the start of the month, underpinning its fourth consecutive week of gains. That said, recent upside has brought the US dollar to a near-term resistance at the 105.00-105.37 level, where a 38.2% Fibonacci level stands. On the weekly chart, previous formation of a bearish pin bar at this level also suggests the presence of strong sellers. A push above the level could pave the way to retest its key 200-day MA at the 106.72 level, while on the downside, near-term support could leave the 103.12 level on watch for any formation of a higher low with recent upward bias.
 Source: IG charts
Friday: DJIA -1.02%; S&P 500 -1.05%; Nasdaq -1.69%, DAX -1.72%, FTSE -0.37%


.jpeg.98f0cfe51803b4af23bc6b06b29ba6ff.jpeg)

0 Comments
Recommended Comments
There are no comments to display.
Create an account or sign in to comment
You need to be a member in order to leave a comment
Create an account
Sign up for a new account in our community. It's easy!
Register a new accountSign in
Already have an account? Sign in here.
Sign In Now