FTSE 100: Where to next for the Tesco share price?

Entry posted by MongiIG in Market News
271 views
Fundamental and technical outlook on the Tesco share price.
 Source: Bloomberg
Tesco share price recovery to continue
The recovery in Tesco PLC shares continues, and is backed by signs that UK consumers continue to increase their purchases of supermarket own brand products.
As the dominant player in the UK supermarket space, with market share of 27%, Tesco is well-placed to benefit from a recovery in consumer spending if energy prices fall back as expected.
While currently trading at 26 times earnings, Tesco’s net income has recovered in recent quarters, and the solid 4% dividend provides an additional attraction.
A push towards cost savings will help support margins in the near-term, with hopes rising that the cost of living squeeze may ease in the second half of the year.
Tesco shares have held steady since the resignation of their chairman, with the overall strategy of the group unaffected.
How to trade Tesco’s Q1 trading statement
Tesco, the United Kingdom-based multinational groceries and general merchandise retailer, is set to release its first quarter (Q1) 2023 trading statement on 16 June 2023.
 Source: Refinitiv
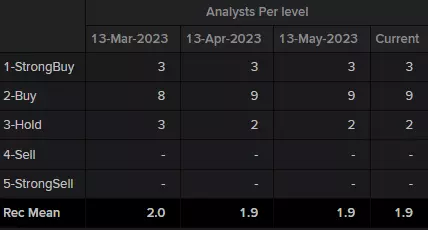
Refinitiv data shows a consensus analyst rating of ‘buy’ for Tesco – 3 strong buy, 9 buy and 2 hold - with the median of estimates suggesting a long-term price target of 304.50 pence for the share, roughly 16% higher than the current price (as of 13 June 2023).
 Source: IG
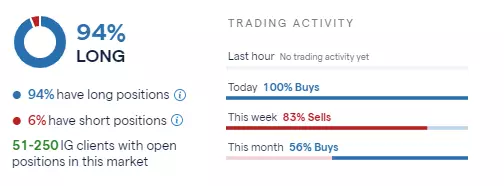
IG sentiment data shows that 94% of clients with open positions on the share (as of 13 June 2023) expect the price to rise over the near term, while 6% of clients expect the price to fall whereas trading activity over this week shows 83% of sells and this month 56% of buys respectively.
Tesco technical outlook
The Tesco share price has greatly outperformed that of the FTSE 100 by rising by nearly 15% year-to-date.
Even though the Tesco share slipped through its October-to-May uptrend line and has been trading in a low volatility sideways trading range over the past three weeks, this isn’t overly concerning for the bulls.
The reason is that the uptrend may simply flatten out, as is often the case, before resuming its ascent.
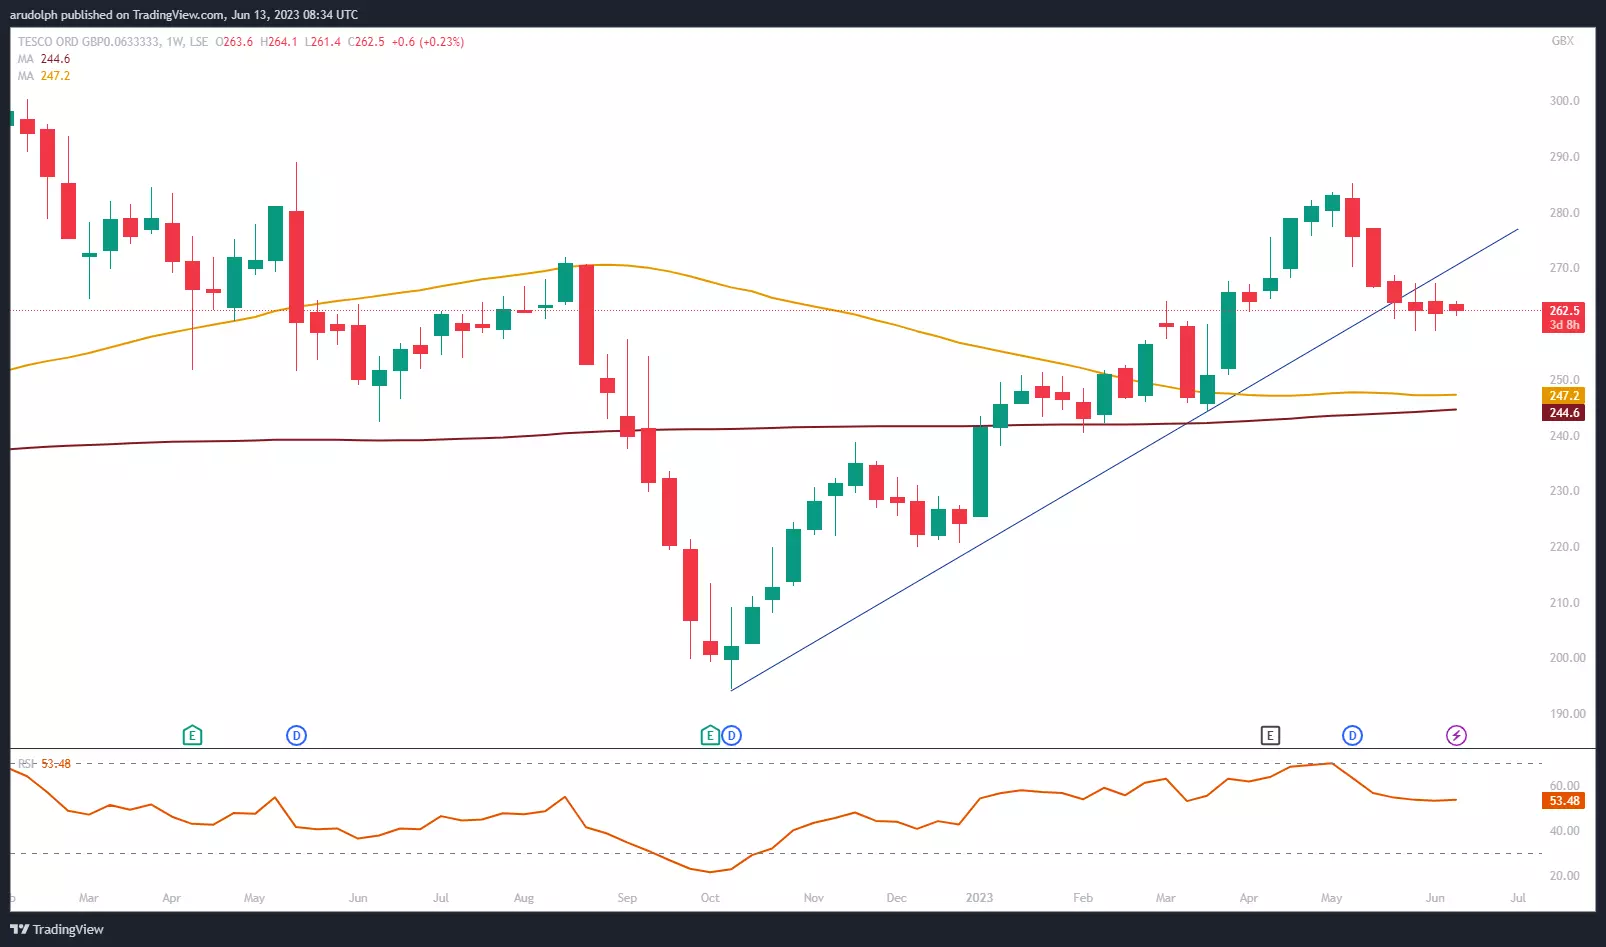
Tesco Weekly Chart
 Source: Tradingview
From a medium-term perspective, as long as the Tesco share price stays above its 200-week simple moving average (SMA) and its February low at 244.60 to 240.40 pence zone on a weekly chart closing basis, the overall uptrend remains intact.
Tesco Daily Chart
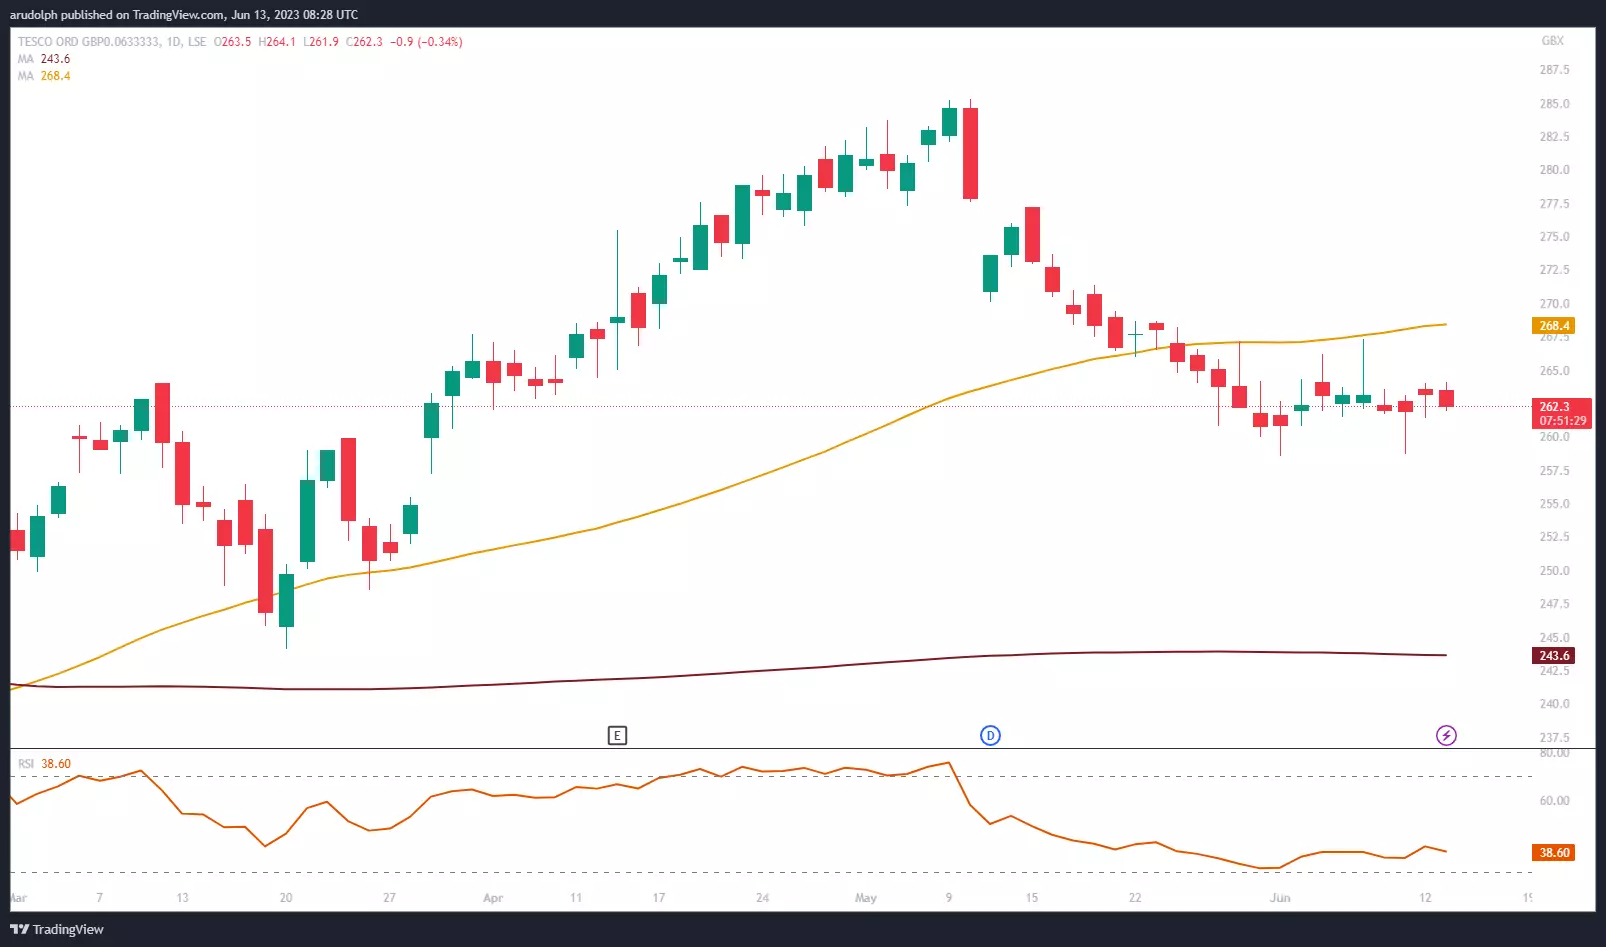 Source: Tradingview
The short-term technical picture also remains bullish while the current June lows at 258.7p to 258.6p hold on a daily chart closing basis. While this is the case, the current sideways trading range can run its course before another up leg is eventually being made.
For this to happen, the late May and current June highs and 55-day simple moving average (SMA) at 267.2p to 268.4p would need to be bettered. If so, the May peak at 285.3p would be back in the frame.
A fall through and daily chart close below the current June low at 258.6p would probably lead to the late March price gap at 257.3p to 255.5p to get filled.


0 Comments
Recommended Comments
There are no comments to display.
Create an account or sign in to comment
You need to be a member in order to leave a comment
Create an account
Sign up for a new account in our community. It's easy!
Register a new accountSign in
Already have an account? Sign in here.
Sign In Now