FOMC takeaways: What’s in it for US dollar, Gold, Russell 2000?

Entry posted by MongiIG in Market News
507 views
Heading into the meeting, the key focus had been on whether US policymakers’ views will be more aligned on the series of rate cuts priced in 2024 and the Fed has clearly delivered.
 Source: Bloomberg
FOMC takeaways
As broadly expected, the Federal Reserve (Fed) has kept rates unchanged at 5.25%-5.5% for the third straight meeting overnight. In the policy statement, acknowledgement of slowing economic growth and easing inflation in the third quarter, alongside a wording change to indicate a softer tightening bias, further confirmed views that the Fed’s hiking cycle has reached its end.
Heading into the meeting, the key focus had been on whether US policymakers’ views will be more aligned on the series of rate cuts priced in 2024 and the Fed has clearly delivered. The median dot plot has priced out any additional hike and now sees 75 basis point (bp) worth of rate cuts in 2024, versus the 50 bp cut in September. While that is still less aggressive than the 100-125 bp cuts priced by markets before the meeting, market participants viewed the shift in stance as sufficiently dovish and the lack of a pushback on rate cuts may caught some by surprise, given the hawkish tone coming from policymakers just last month.
In the economic projections, the core Personal Consumption Expenditures (PCE) inflation forecasts were revised downwards through 2025. Unemployment rate were kept unchanged from the September projection (4.1% in 2024 and 2025), while gross domestic product (GDP) forecasts saw a slight revision to 1.4% in 2024 from previous 1.5%. Overall, the soft-landing narrative is still broadly intact and along with rate-cuts validation from the Fed, there seems to be little in the way to stop the risk rally.
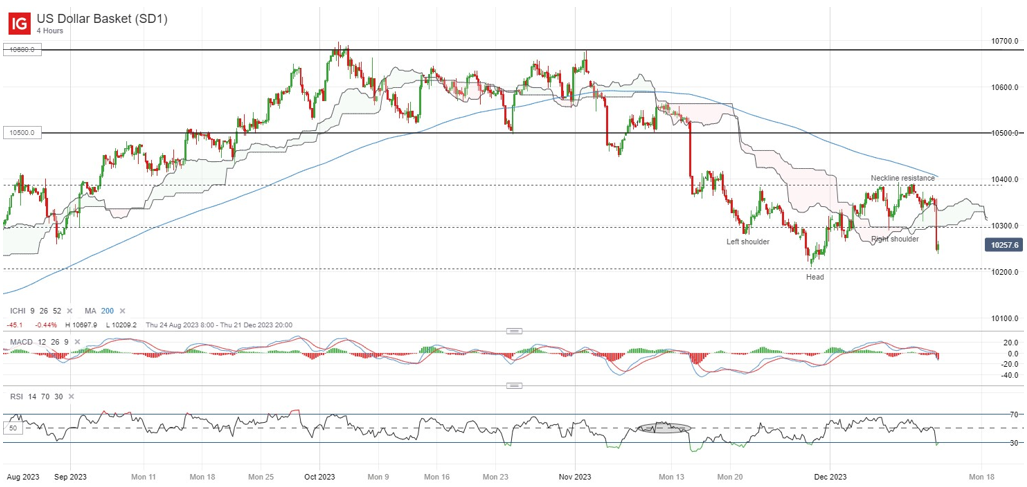
US dollar pared all month-to-date gains on Fed’s dovish rhetoric
Having earlier formed an inverse head-and-shoulder formation on the four-hour chart, the dovish rhetoric from the Fed has not been supportive for a neckline breakout at the 103.86 level. The US dollar index has since pared back all of its month-to-date gains, crashing back below its key 200-day moving average (MA) on the daily chart. Its daily relative strength index (RSI) has also failed to cross above the 50 level lately, leaving its near-term downward trend intact.
Further downside will leave the 102.00 level on watch, which marks its November 2023 low. Failure for the level to hold could see the 100.50 level next. On the upside, buyers may face an arduous task with several resistance overhead in place, which includes its 200-day MA and the 103.86 level.
 Source: IG charts
Gold prices eyeing for a move back to retest key resistance
After failing to sustain a breakout above the US$2,074 level back on 4 December 2023, the yellow metal has found new signs of life overnight, with the green light on the rate-cuts narrative from the Fed. The overnight upmove has pared all of this week’s losses, with prices seemingly setting its sight for another retest of the US$2,074 level of resistance, which marked a crucial overhead resistance on multiple previous occasions (May 2023, March 2022 and August 2020).
For now, the broader upward trend remains intact, with prices trading after its Ichimoku cloud zone on the daily chart after an upward break in October 2023, alongside various MAs. A successful move above the US$2,074 level may pave the way towards the all-time high at the US$2,146 level next. On the downside, the daily Ichimoku cloud zone will serve as an area of support for buyers to defend.
 Source: IG charts
Can Russell 2000 deliver a breakout from its broad ranging pattern?
Small-cap stocks have been playing catch-up lately, with the Russell 2000 surging 8.3% over the past month, outperforming the Nasdaq’s and S&P 500’s 4.7%. A reclaim of its 200-day MA in early-December this year has been encouraging, with the index standing just less than 3% away from a crucial resistance at the key psychological 2,000 level.
Having largely traded in a broad ranging pattern since May 2022, the 2,000 level marked the upper bound of the range, which has weighed on the index on multiple occasions. Any successful breakout above the range will be significant, potentially paving the way towards the 2,108 level next. On the downside, immediate support may stand at the 1,900 level.
 Source: IG charts
Wednesday: DJIA +1.40%; S&P 500 +1.37%; Nasdaq +1.38%, DAX -0.15%, FTSE +0.08%
IGA, may distribute information/research produced by its respective foreign affiliates within the IG Group of companies pursuant to an arrangement under Regulation 32C of the Financial Advisers Regulations. Where the research is distributed in Singapore to a person who is not an Accredited Investor, Expert Investor or an Institutional Investor, IGA accepts legal responsibility for the contents of the report to such persons only to the extent required by law. Singapore recipients should contact IGA at 6390 5118 for matters arising from, or in connection with the information distributed.
The information/research herein is prepared by IG Asia Pte Ltd (IGA) and its foreign affiliated companies (collectively known as the IG Group) and is intended for general circulation only. It does not take into account the specific investment objectives, financial situation, or particular needs of any particular person. You should take into account your specific investment objectives, financial situation, and particular needs before making a commitment to trade, including seeking advice from an independent financial adviser regarding the suitability of the investment, under a separate engagement, as you deem fit.
No representation or warranty is given as to the accuracy or completeness of this information. Consequently, any person acting on it does so entirely at their own risk. Please see important Research Disclaimer.
Please also note that the information does not contain a record of our trading prices, or an offer of, or solicitation for, a transaction in any financial instrument. Any views and opinions expressed may be changed without an update.


1 Comment
Recommended Comments
Create an account or sign in to comment
You need to be a member in order to leave a comment
Create an account
Sign up for a new account in our community. It's easy!
Register a new accountSign in
Already have an account? Sign in here.
Sign In Now