Jackson Hole preview: tapering uncertainty expected to ensure market volatility

Entry posted by MongiIG in Market News
914 views
Tapering talk looks likely to dominate the Jackson Hole Symposium, but recent FOMC minutes highlight the potential for volatility given growing uncertainty.
What to watch at Jackson Hole.

What is the Jackson Hole Symposium?
This week sees central bankers head online as the annual Jackson Hole Symposium is once again disrupted by the Covid-19 pandemic.
The Kansas Federal Reserve has hosted this annual event since 1978, with prominent central bankers, finance ministers, academics, and financial market participants convening to discuss the economic issues, implications, and policy options in relation to the symposium topic. This year’s meeting is titled 'Macroeconomic Policy in an Uneven Economy.'
We have seen many occasions where central bankers have made key decisions and announcements at this event, with each meeting typically seeing the focus shift onto one key speech given how each central bank is set up to adjust or maintain stimulus around that time. With that in mind, traders typically approach this as a key event in the calendar, with commentary bringing potential volatility for financial markets.
What the main event?
This year’s meeting sees the main focus shift onto the Federal Reserve (Fed), with many believing we could see Jerome Powell lay the groundwork for a tapering programme given the rise in inflation.
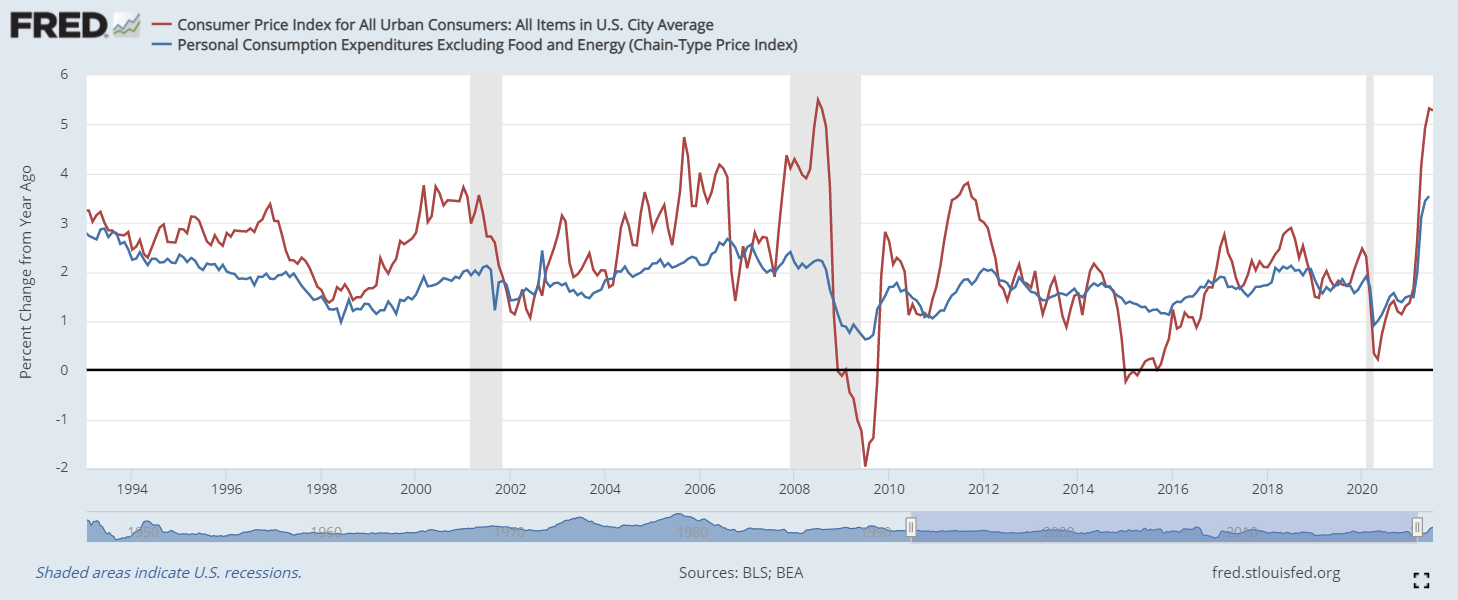
That surge in both core personal consumption expenditures (PCE) and consumer price index (CPI) inflation has brought forward expectations for tightening at the Fed, although there are still some who hope that we could see price pressures ease as things normalise.
The idea is to utilise monetary policy to drive down unemployment, with inflation allowed to overshoot the 2% target for a period of time. It is worthwhile noting that the US economy remains 5.7 million jobs short of where it was before the Covid-19 pandemic.
 Source: Federal Reserve
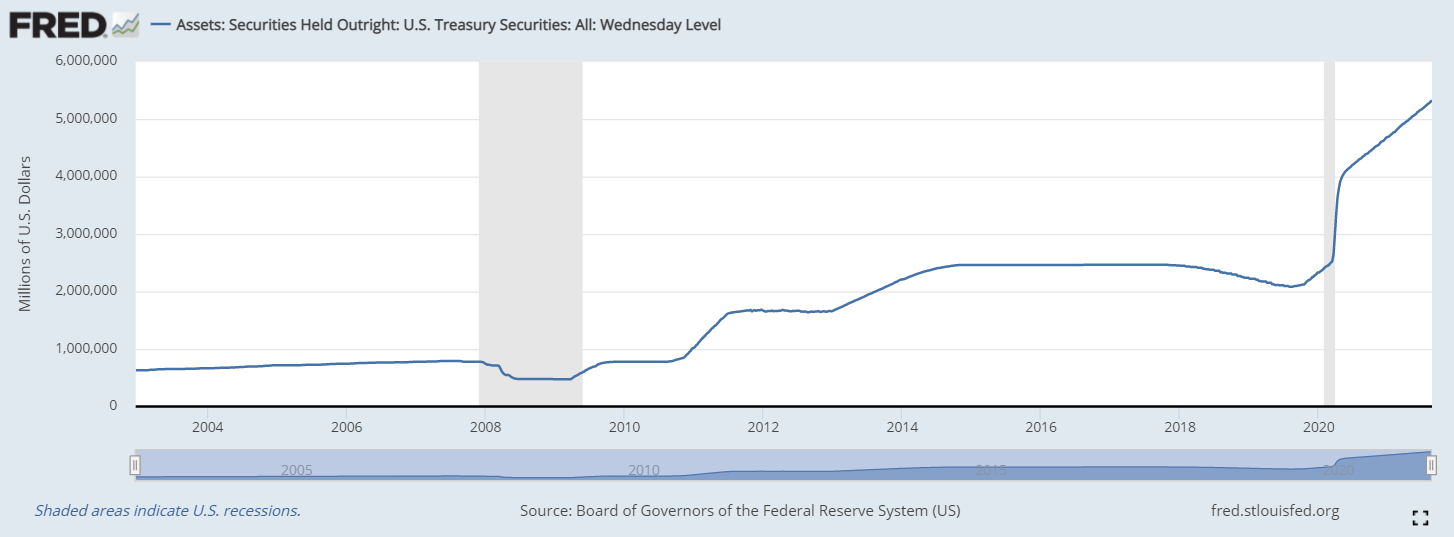
The Fed have employed a policy of rock-bottom interest rates and a lofty $120 billion worth of monthly purchases of Treasuries and mortgage-backed securities (MBS).
The chart below highlights the unprecedented rate of asset purchases undertaken over the course of this crisis, with the sharp rise in Treasury securities in stark contrast to the gradual efforts in the wake of the 2007 financial crisis.
That highlights how the Fed will want to start to trim back on the size of monthly purchases before long, with the rise in inflation giving one cause to start tightening monetary policy.
 Source: fred.stlouisfed.org
However, while it has been commonly accepted that Powell will look towards the Jackson Hole Symposium as a perfect platform to outline the timing and size of their tapering, we have started to see some uncertainty creep in of late.
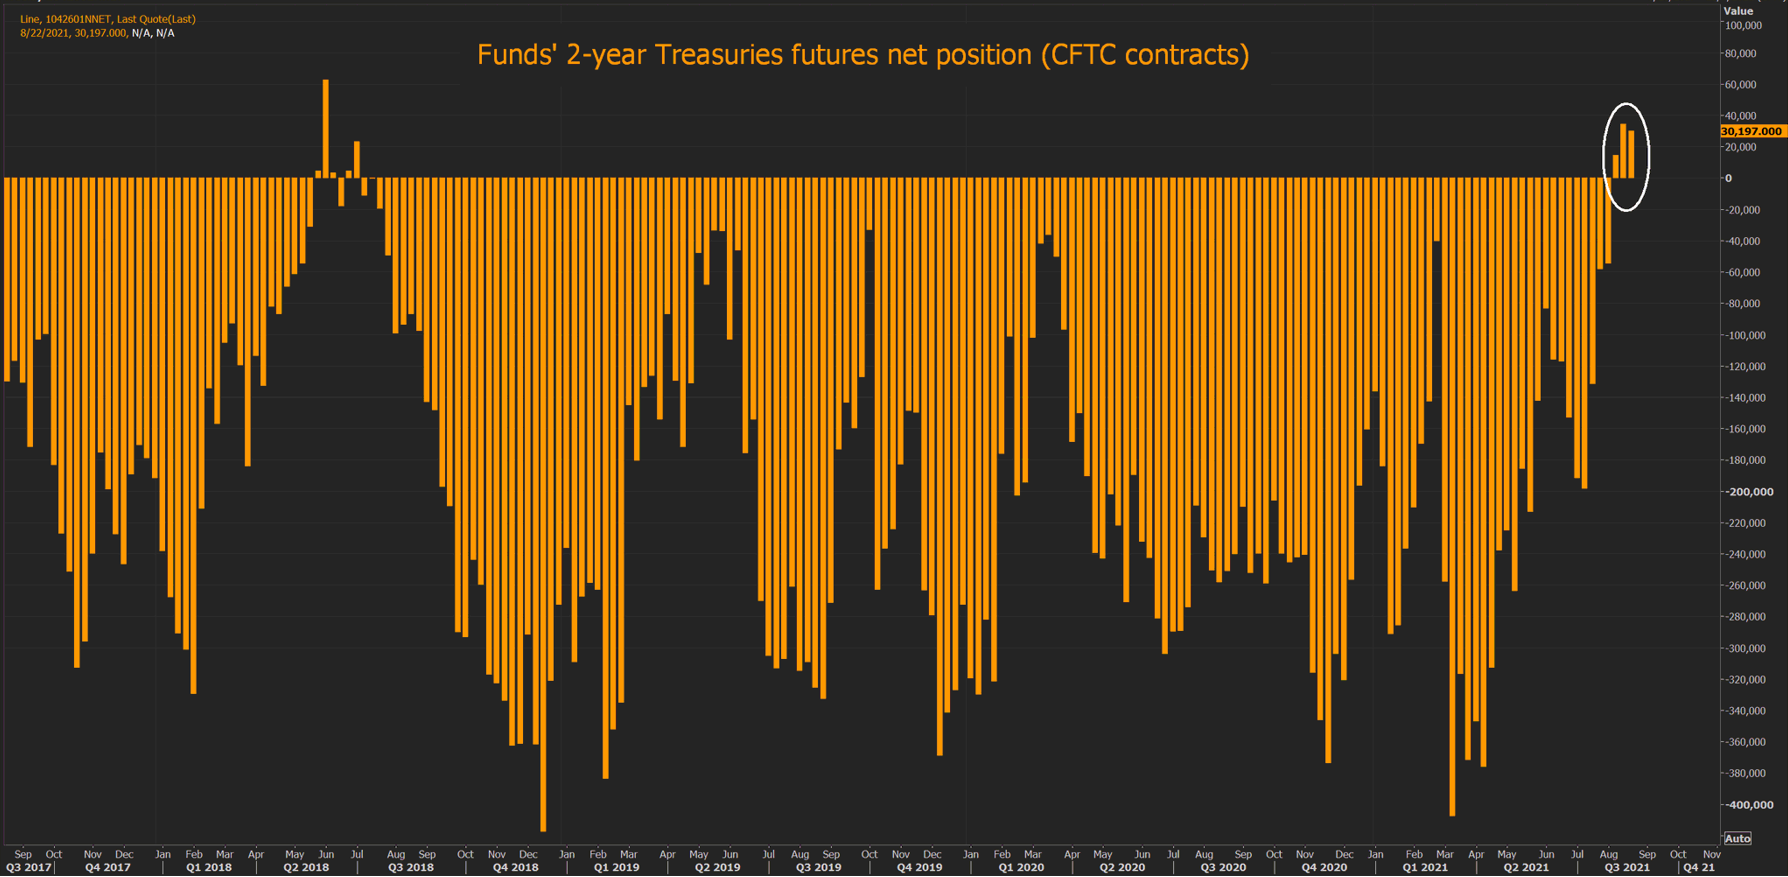
Interestingly, while markets have long been confident of an economic recovery and tightening of monetary policy, the CFTC positioning in the two-year treasury notes does highlight a potential shift in that tone.
The move back into positive territory this month marks the first time in three-years that the market has betted against higher yields and tighter Fed policy. That is notable given the fact that we had been looking towards this meeting as a basis for tighter monetary policy.
 Source: Eikon
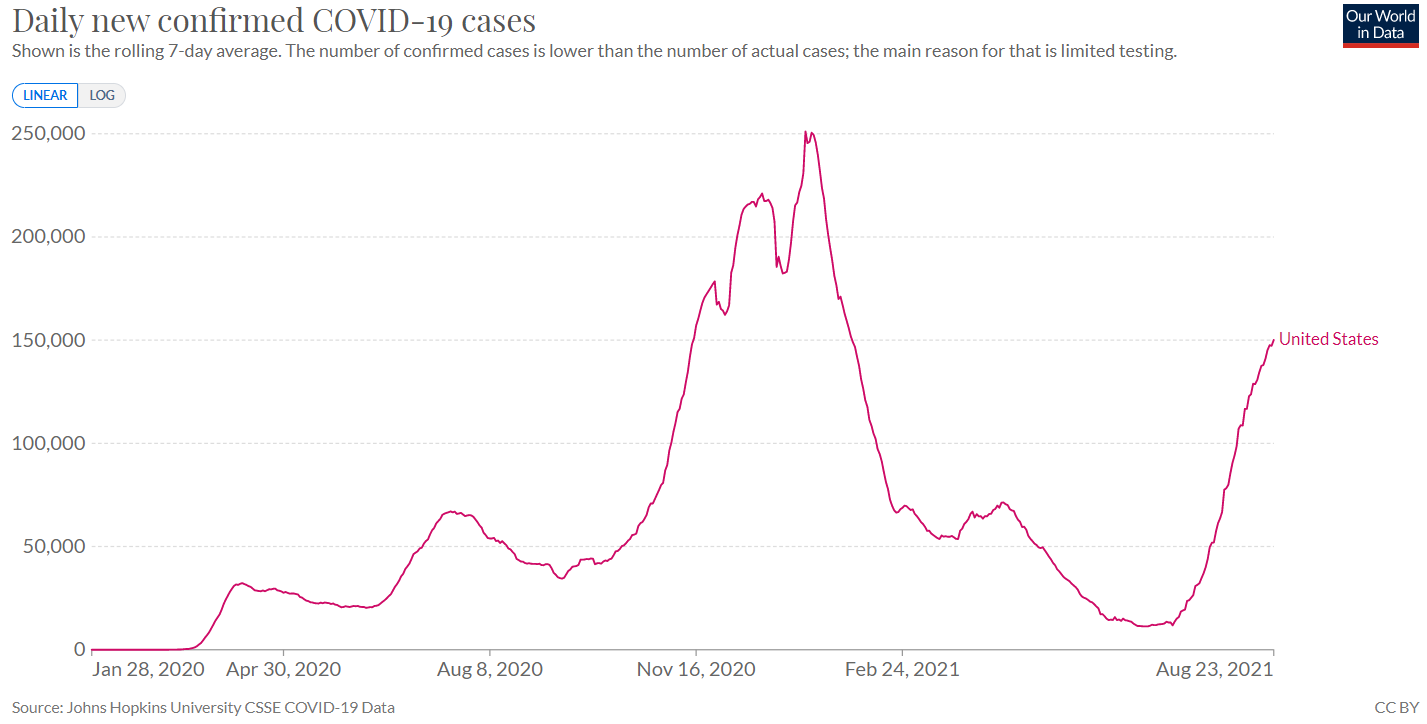
Part of the reason for this recent uncertainty is the rise of the Delta variant, with the country exhibiting a sharp increase in cases over the course of the past two-months.
While US President Joe Biden will be unwilling to establish fresh restrictions, there are concerns that a lack of controls could see the health care system under pressure.
 Source: OurWorldinData
That rise tallies up perfectly with the increase in the Delta variant as a share of the cases in the country. Unfortunately, there is no guarantee that the Delta variant is the worst iteration of the virus.
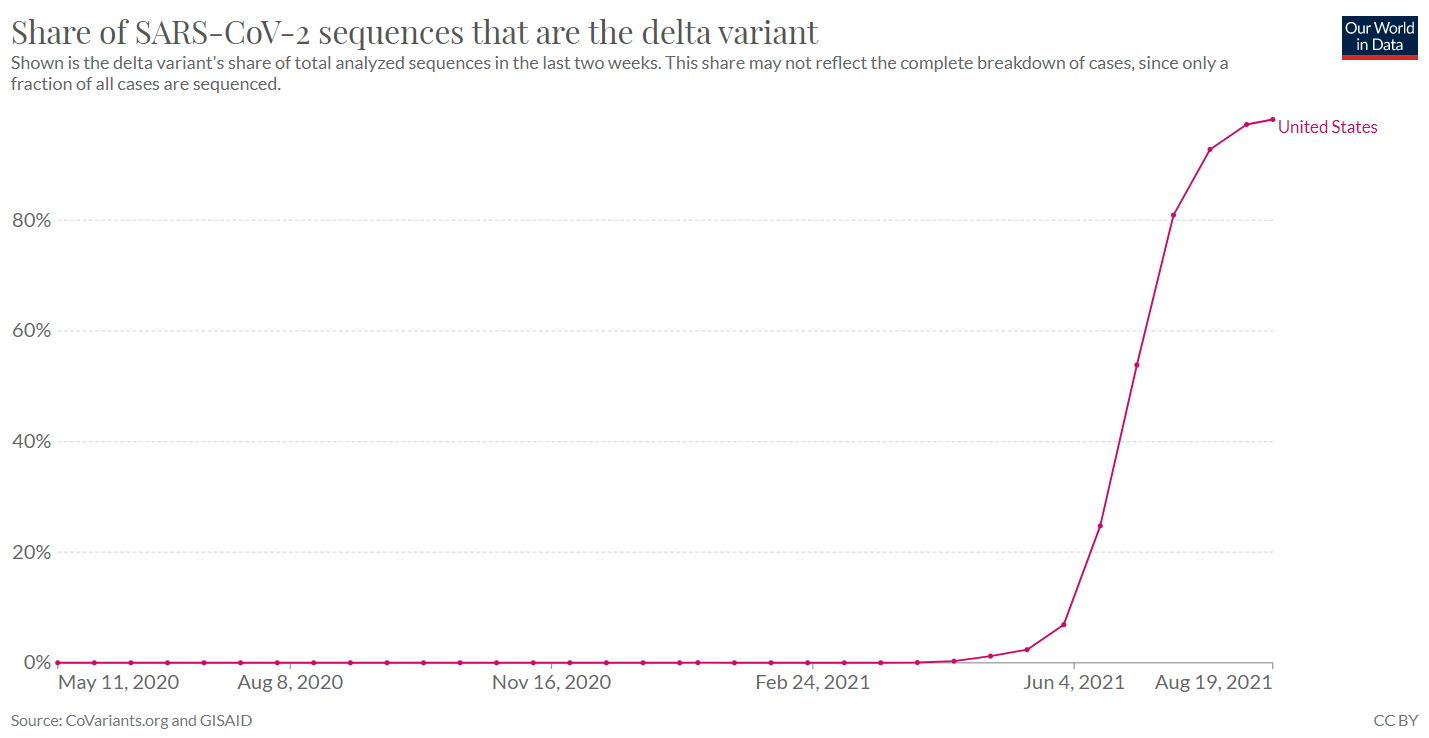 Source: OurWorldinData
FOMC minutes highlight lack of consensus
Last week saw the release of the minutes from the Federal Open Market Committee (FOMC), with the group striking a somewhat mixed tone. On one hand, members appeared to be confident that their employment targets could be achieved this year, laying the basis for a potential tightening of policy. The minutes highlighted that the Fed do expect to taper at some point this year, as they seek to trim the monthly purchases of $120 billion of Treasury bonds and mortgage-backed securities.
However, timing remains a key concern that appears to divide opinion. With differing opinions on whether to prioritise unemployment, inflation, or Covid-19 cases as a key concern, it seems the group are finding it more difficult to find a consensus than many had thought.
With that in mind, we head into this Jackson Hole Symposium with far less confidence that Powell will lay out a definitive blueprint of how and when the Fed will starting trimming their asset purchase programme.
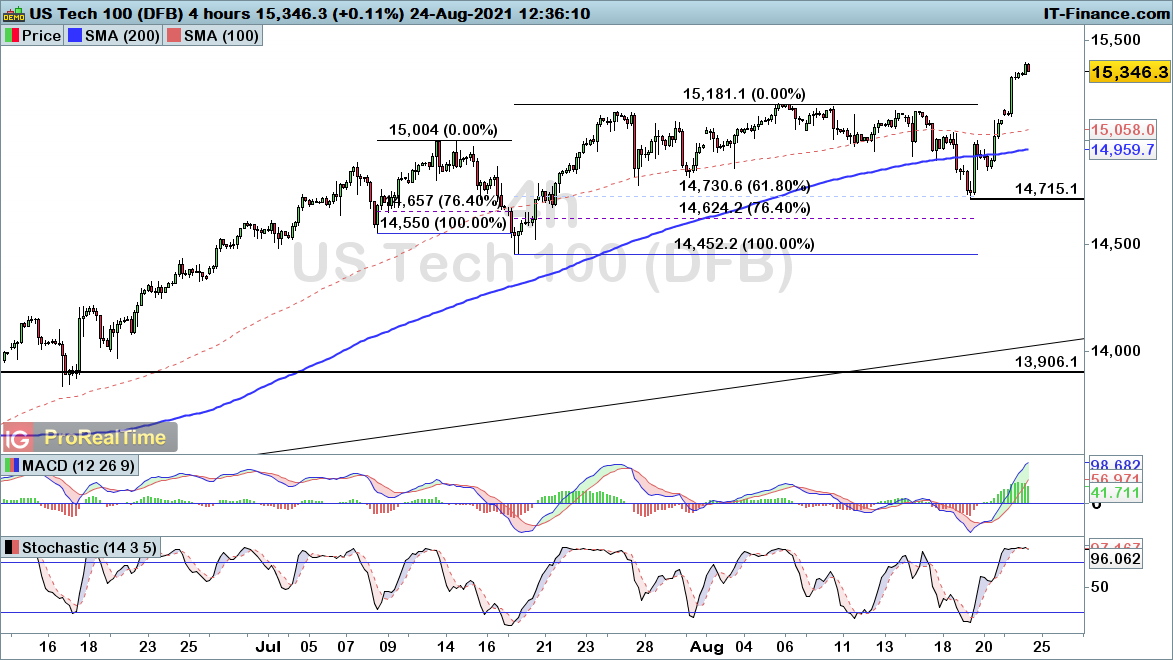
Nasdaq (Tech 100) technical analysis
The Nasdaq has been one of the biggest benefactors from the ongoing loose monetary policy stance from the Fed. That is reflected in the fact that assets typically flow towards value stocks and out of the Nasdaq when treasury yields rise and central banks tighten policy.
With that in mind, this index looks to be a major benefactor if Powell decides to hold off on explicitly laying out a tapering plan. The longer the Fed holds off, the longer the Nasdaq will likely outperform. With that in mind, last week’s FOMC minutes have led to a swift record high for the index after a 61.8% retracement. Those gains are likely to be heightened if we are to see a continued dovish stance from Powell.
On the flip-side, a hawkish stance and clear roadmap for tapering this year would likely see this index fall back as traders become fearful that the huge stimulus package could soon be unwould.
 Source: ProRealTime

See opportunity on an index?


.jpeg.98f0cfe51803b4af23bc6b06b29ba6ff.jpeg)

0 Comments
Recommended Comments
There are no comments to display.
Create an account or sign in to comment
You need to be a member in order to leave a comment
Create an account
Sign up for a new account in our community. It's easy!
Register a new accountSign in
Already have an account? Sign in here.
Sign In Now