EUR/USD Outlook – Steered by the US Dollar as Notable ECB Meeting Nears

Entry posted by MongiIG in Market News
1,264 views
EUR/USD PRICE, CHART, AND ANALYSIS
- US dollar short-term strength weighs down on EUR/USD.
- The ECB meeting will include the latest growth and inflation forecasts.

The US dollar keeps pushing higher with the greenback now on course to challenge short-term resistance just 10 ticks away. The double top around 92.80 on the daily DXY is unlikely to stop further upside in the dollar basket but may act as a short-term brake in the coming sessions. The US dollar’s rebound post last Friday’s US Jobs Report has been strong although the move was helped by the oversold nature of the US dollar going into the release. This dollar strength is currently seen across a variety of USD-pairs, including EUR/USD.
US DOLLAR INDEX (DXY) DAILY PRICE CHARTSEPTEMBER 7, 2021

Thursday’s ECB monetary policy meeting will also include the closely-watched quarterly growth and inflation projections for the months ahead. It is thought that GDP projections may be nudged higher while the inflation outlook will stay around current forecasts, despite price pressures hitting a 10-year high recently. The central bank is set to look through current inflation levels, deeming them transitory, although fears that they soon may roll over into higher wage demands may see the ECB issue a note of caution.
The staff projections aside, the main area of interest tomorrow will be on the central bank’s various bond-buying programs and if any adjustments will be made. The Asset Purchase Program (APP) is set to be left untouched, while the Pandemic Emergency Purchase Program (PEPP) may see the rate of bond buying lowered via a technical adjustment. Recent commentary from several ECB members has suggested that if growth and inflation remain pointing higher, a gradual normalization to the program, set to end in March 2022, may be seen with the number of bonds purchased every month lowered to EUR60-70 billion from EUR80 billion.
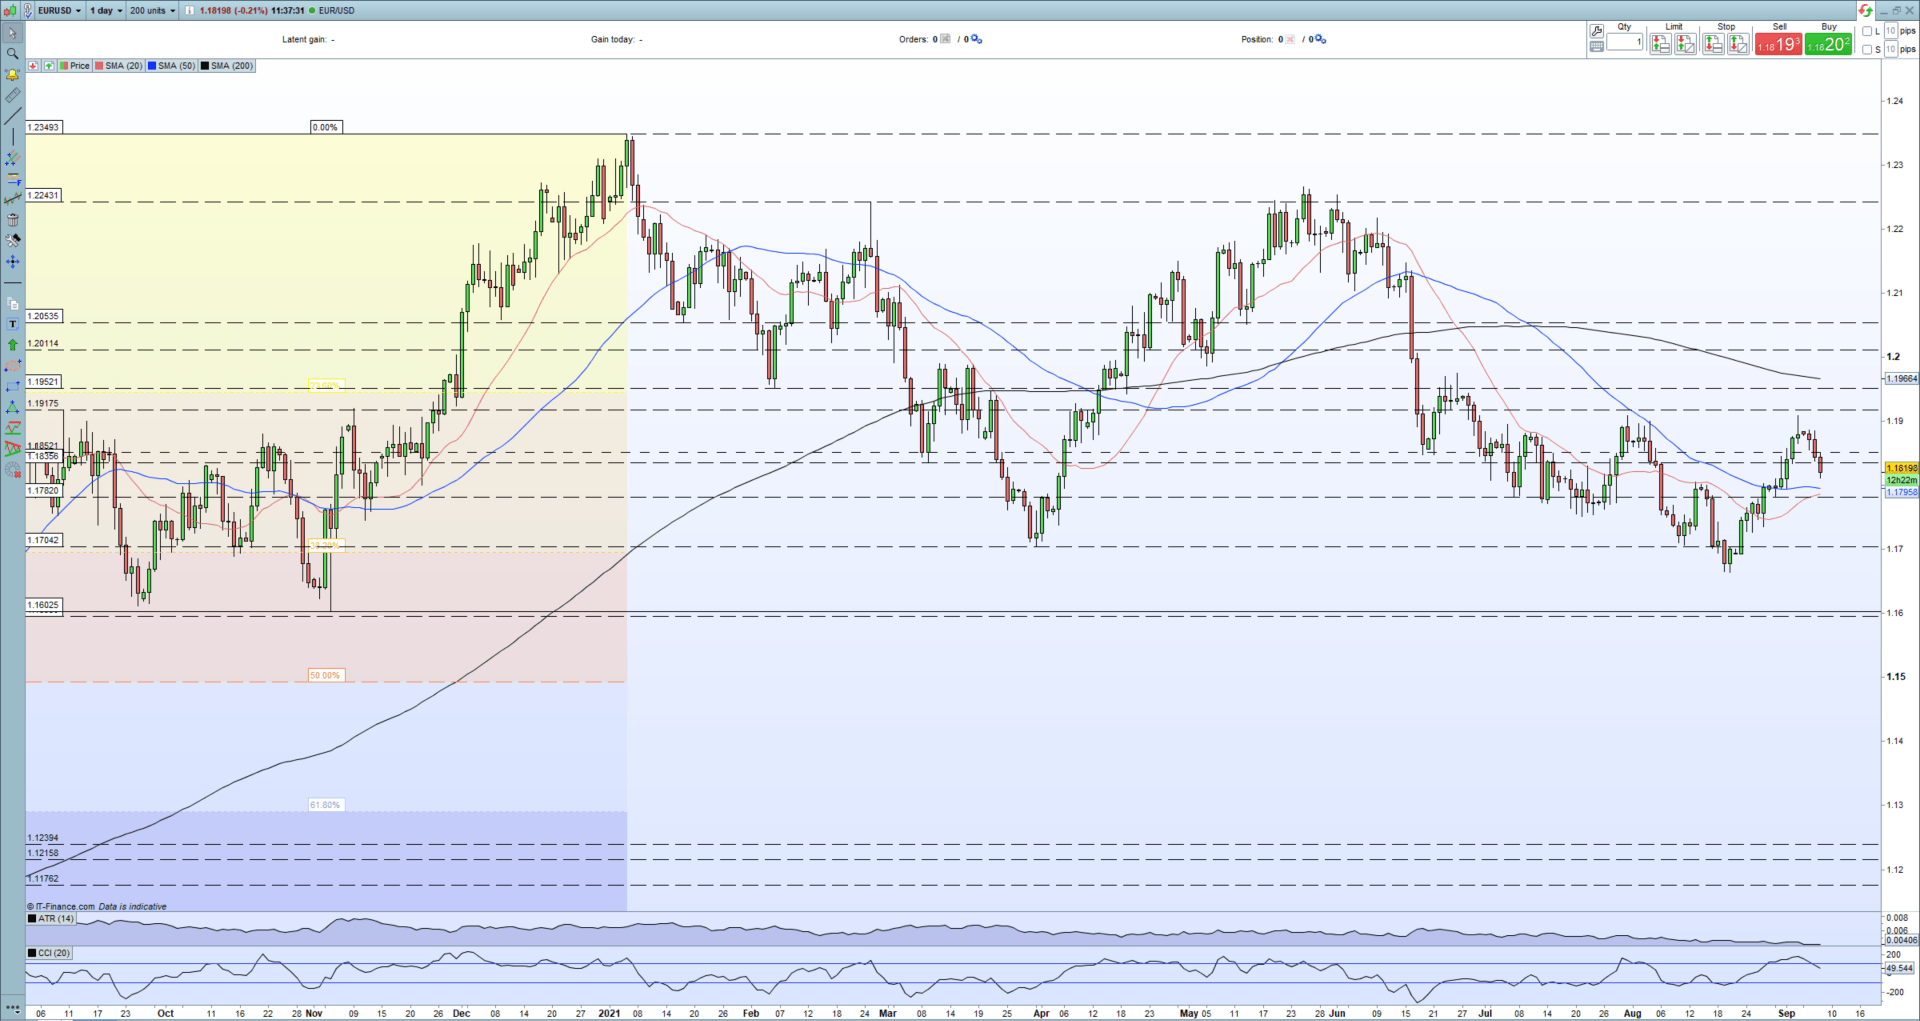
The Euro remains on the backfoot against the US dollar at present although any hawkish hints at tomorrow’s post-announcement press conference may see the pair begin to pull back some of the recent weakness. On the flip side, ongoing loose monetary policy is likely to see EUR/USD break back below 1.1800, leaving 1.1782 and 1.1704 (38.2% Fibonacci retracement) as the next levels of support.
EURO (EUR/USD) DAILY PRICE CHART SEPTEMBER 8, 2021
Retail trader data show41.20% of traders are net-long with the ratio of traders short to long at 1.43 to 1.The number of traders net-long is 1.32% lower than yesterday and 14.15% lower from last week, while the number of traders net-short is 2.37% lower than yesterday and 14.99% higher from last week.
We typically take a contrarian view to crowd sentiment, and the fact traders are net-short suggests EUR/USD prices may continue to rise. Positioning is less net-short than yesterday but more net-short from last week. The combination of current sentiment and recent changes gives us a further mixed EUR/USD trading bias.

What is your view on EUR/USD – bullish or bearish?
By Nick Cawley, Strategist, 8 September 2021. DailyFX


.jpeg.98f0cfe51803b4af23bc6b06b29ba6ff.jpeg)

0 Comments
Recommended Comments
There are no comments to display.
Create an account or sign in to comment
You need to be a member in order to leave a comment
Create an account
Sign up for a new account in our community. It's easy!
Register a new accountSign in
Already have an account? Sign in here.
Sign In Now