Jump to content

Breaking: ECB to Slow PEPP Purchase Pace, EUR/USD and Bund Yields Muted


MongiIG

671 views

EUR/USD, ECB Price Analysis & News:

  • ECB Slows PEPP Purchases as Expected.
  • Euro Muted Following Expected Decision.

Lagarde_signature-800x450.jpg

ECB Slows PEPP Purchases as Expected

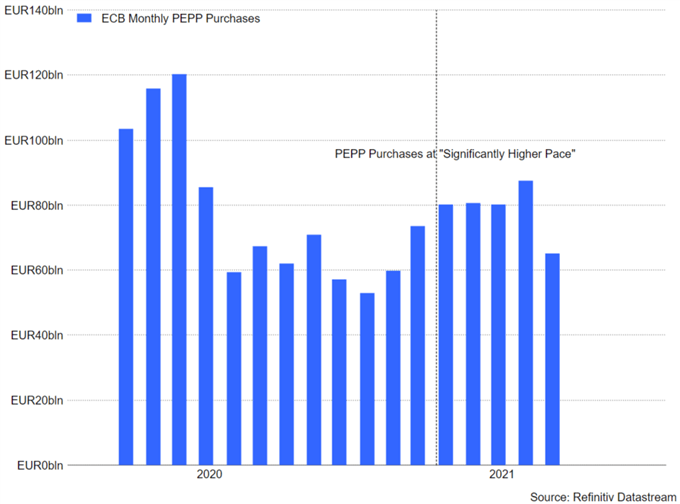
The ECB announced that they will slow the pace of PEPP purchases from the current EUR 80bln/month with the change being called a “moderately” slower pace. A reminder, that this is an alteration of the prior guidance of “significantly higher pace” of purchases used over the past two quarters. Details are on the light side for now with Chief Lagarde expected to announce what the new pace is, alongside the latest staff projections. The Bank noted that inflation may moderately exceed goal for transitory period, which comes on the back of the recent inflation readings hitting a 10yr high.

Market reaction muted thus far in the Euro and Bund yields, given that the move to slow the pace of PEPP purchases had been largely priced in. That being said, in light of the hawkish expectations heading into the meeting, there is a risk of a disappointment after Lagarde’s presser.

ECB PEPP Purchases

Breaking: ECB to Slow PEPP Purchase Pace, EUR/USD and Bund Yields Muted

Looking ahead, ECB Lagarde’s press conference is scheduled for 13:30BST.

For the full commentary of the ECB Press Conference check out the @DailyFXTeam Twitter Handle.

The European Central Bank: A Forex Trader’s Guide

EURUSD, German Bund Instant Reaction
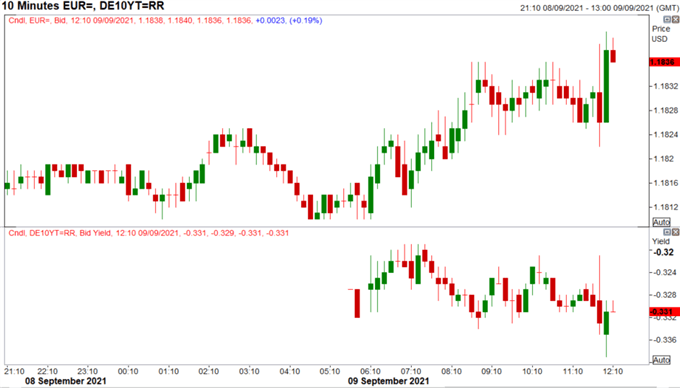
Breaking: ECB to Slow PEPP Purchase Pace, EUR/USD and Bund Yields Muted

Source: Refinitiv


By Justin McQueen, Strategist, 9 September 2021. DailyFX

0 Comments


Recommended Comments

There are no comments to display.

Create an account or sign in to comment

You need to be a member in order to leave a comment

Create an account

Sign up for a new account in our community. It's easy!

Register a new account

Sign in

Already have an account? Sign in here.

Sign In Now
  • Blog Statistics

    • Total Blogs
      3
    • Total Entries
      2,822
  • Latest Forum Topics

  • Our picks

    • International Workers' Day & Early May Trading Hours
      Please be advised that our opening hours will be adjusted on 1 May 2024 for International Workers’ Day and 6 May 2024 for the UK Early May Bank Holiday. Where appropriate, the times listed are in GMT.
        • Like
    • Are these the best AI stocks to watch in May 2024?
      Microsoft, Apple, Nvidia, Amazon and Meta could be the best AI stocks to watch next month. These stocks are the largest AI stocks in the US based on market capitalisation.
    • Natural Gas Commodity Elliottwave Technical Analysis
      Natural Gas


      Mode - Impulsive 


      Structure - Impulse Wave 


      Position - Wave (iii) of 5


      Direction - Wave (iii) of 5 still in play


      Details:  Price now in wave iii as it attempts to breach 1.65 wave i low. Wave (iii) is still expected to extend lower in an impulse.


      Natural Gas is currently breaching the previous April low, marking a decisive move as the impulse initiated on 5th March continues its downward trajectory, further extending the overarching impulse wave sequence that commenced back in August 2022. This decline is anticipated to persist as long as the price remains below the critical resistance level of 2.012.


      Zooming in on the daily chart, we observe the medium-term impulse wave originating from August 2022, which is persisting in its downward trend after completing its 4th wave - delineated as primary wave 4 in blue (circled) - at 3.666 in October 2023. Presently, the 5th wave, identified as primary blue wave 5, is underway, manifesting as an impulse at the intermediate degree in red. It is envisaged that the price will breach the February 2024 low of 1.533 as wave 5 of (3) seeks culmination before an anticipated rebound in wave (4). This confluence of price movements underscores the bearish sentiment prevailing over Natural Gas in the medium term.


      Analyzing the H4 chart, we initiated the impulse wave count for wave (3) from the level of 2.012, which marks the termination point of wave 4. Notably, price action formed a 1-2-1-2 structure, with confirmation established at 1.65 and invalidation set at 2.012. The confirmation of our anticipated direction materialized as price breached the 1.65 mark, signifying a resumption of bearish momentum. Presently, there appears to be minimal resistance hindering the bears, thereby reinstating their dominance in the market. It is projected that wave iii of (iii) of 5 will manifest around 1.43, indicative of the potential for the wave 5 low to extend to 1.3 or even lower. This comprehensive analysis underscores the prevailing bearish outlook for Natural Gas in the immediate future.


      Technical Analyst : Sanmi Adeagbo
       
        • Like
×
×
  • Create New...
us