

MongiIG
-
Posts
9,858 -
Joined
-
Last visited
-
Days Won
41
Content Type
Profiles
Forums
Blogs
Events
Community Tutorials
Store
Posts posted by MongiIG
-
-
6 hours ago, Ryan_Anderson said:
Ryan Anderson's approach to the stock market is shaped by his "Global Opportunity Interpretation Method," a strategy that integrates global economic, political, and market trends to identify investment opportunities. As markets experience heightened volatility, particularly within sectors like technology and commodities, Anderson's insights are particularly valuable. He discusses the recent downturn in indices such as the ASX 200 and All Tech, highlighting the broader impacts of economic shifts on these sectors.

Anderson emphasizes the strategic importance of future-facing commodities like lithium, nickel, and cobalt, essential for the energy transition and increasingly influenced by electric vehicle (EV) adoption globally. With a predicted surge in demand for these commodities, Anderson points out the potential for significant market shifts, offering both challenges and opportunities for informed investors.
Analyzing the Current Commodity Trends
Delving deeper into the commodities market, Ryan Anderson provides an analysis that underscores the critical role of strategic metals in the global shift towards renewable energy. He references expert forecasts, such as those from Deloitte, which anticipate a dramatic rise in the demand for lithium and cobalt driven by the EV sector. These insights are crucial for investors looking to position themselves in markets that are at the cusp of transformation.Furthermore, Anderson critiques the market's response to these commodities, noting the volatility and the speculative nature of investments in sectors like lithium mining. He warns of the risks associated with technically challenging projects, suggesting that while the reward can be high, the path to profitability is fraught with potential setbacks. This nuanced understanding of risk versus reward, underpinned by rigorous analysis and global market trends, is a hallmark of Anderson’s advisory approach.
Thanks for sharing @Ryan_Anderson
-
2 hours ago, CryptoSaint said:Bitcoin (BTC/USD) shows strong upward momentum, hitting $66,270, up 2.50%. Breaking past $64,853, it faces resistance at $66,910, $69,232, and $71,425. Supports are at $63,045, $61,387, and $59,686, indicating a critical juncture for investors.
Thanks for sharing @CryptoSaint
-
Now that the Bitcoin halving event is over, investors are keen to know how this will impact the cryptocurrency’s price and dynamics in the coming months.
Publication date:ByteTree CIO Charlie Morris speaks to IGTV’s Angeline Ong to explain why this event was the ‘great anti-climax’ in the crypto world, and why this event perhaps presents a long awaited entry point for those wanting to gain exposure to Bitcoin.
(AI Video Summary)
Impact of the Bitcoin halving event
In this exclusive IGTV interview, Angeline Ong and ByteTree CIO Charles Morris analyse the Bitcoin halving, emphasising its reduced supply effect and potential for price increases due to decreased miner selling pressure. Morris suggests the halving's aftermath offers a promising entry point for investors, citing historical post-halving strengths.
Bitcoin's correlation with tech stocks
He also discusses Bitcoin's correlation with tech stocks, regulatory perspectives, and its inevitability as a sustainable asset class, akin to "the gold of the Internet." Morris concludes by highlighting Bitcoin's necessity for fast, round-the-clock financial systems, contrasting traditional banking.
This information has been prepared by IG, a trading name of IG Markets Limited. In addition to the disclaimer below, the material on this page does not contain a record of our trading prices, or an offer of, or solicitation for, a transaction in any financial instrument. IG accepts no responsibility for any use that may be made of these comments and for any consequences that result. No representation or warranty is given as to the accuracy or completeness of this information. Consequently any person acting on it does so entirely at their own risk. Any research provided does not have regard to the specific investment objectives, financial situation and needs of any specific person who may receive it. It has not been prepared in accordance with legal requirements designed to promote the independence of investment research and as such is considered to be a marketing communication. Although we are not specifically constrained from dealing ahead of our recommendations we do not seek to take advantage of them before they are provided to our clients. See full non-independent research disclaimer and quarterly summary.
-
EUR/USD stabilizes while EUR/GBP rallies and GBP/USD tumbles on dovish BoE comments regarding rapidly falling inflation.
 Source: Getty Images
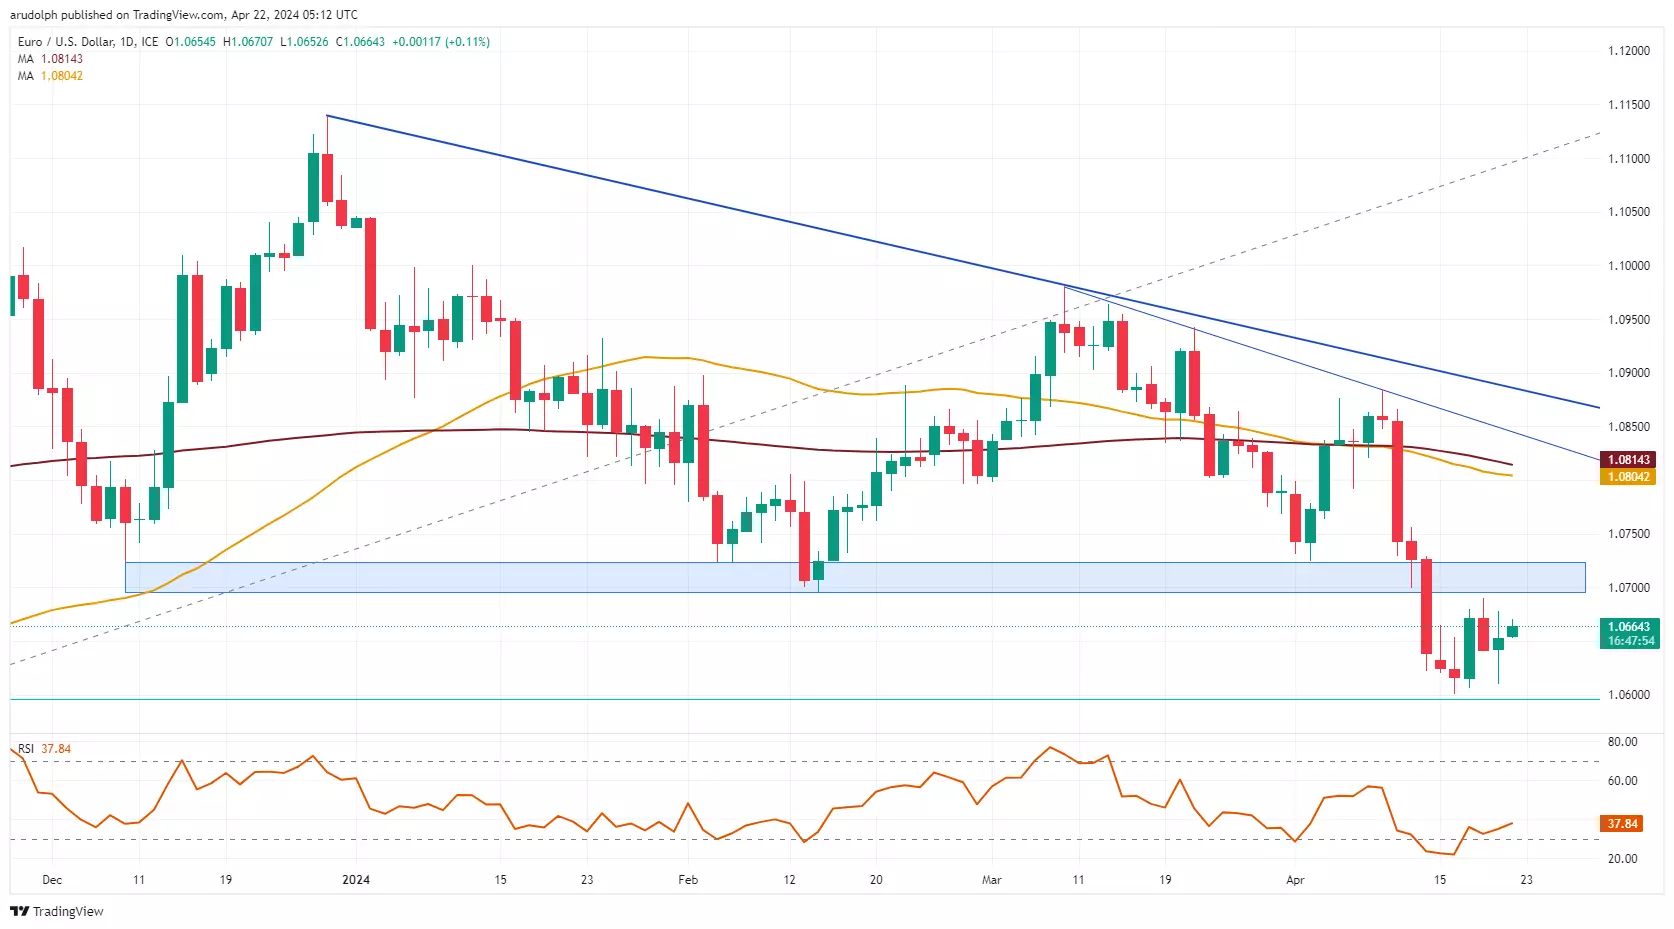
EUR/USD stabilizes
EUR/USD is now range trading between its key $1.069 to $1.0725 resistance zone and last week's $1.0601 low. Below it lies the 78.6% Fibonacci retracement of the October-to-December advance at $1.0596 and further down the late October lows at $1.0522 to $1.0517 as well as the $1.0449 October low. All of these remain medium-term in sight.
 Source: TradingView.com
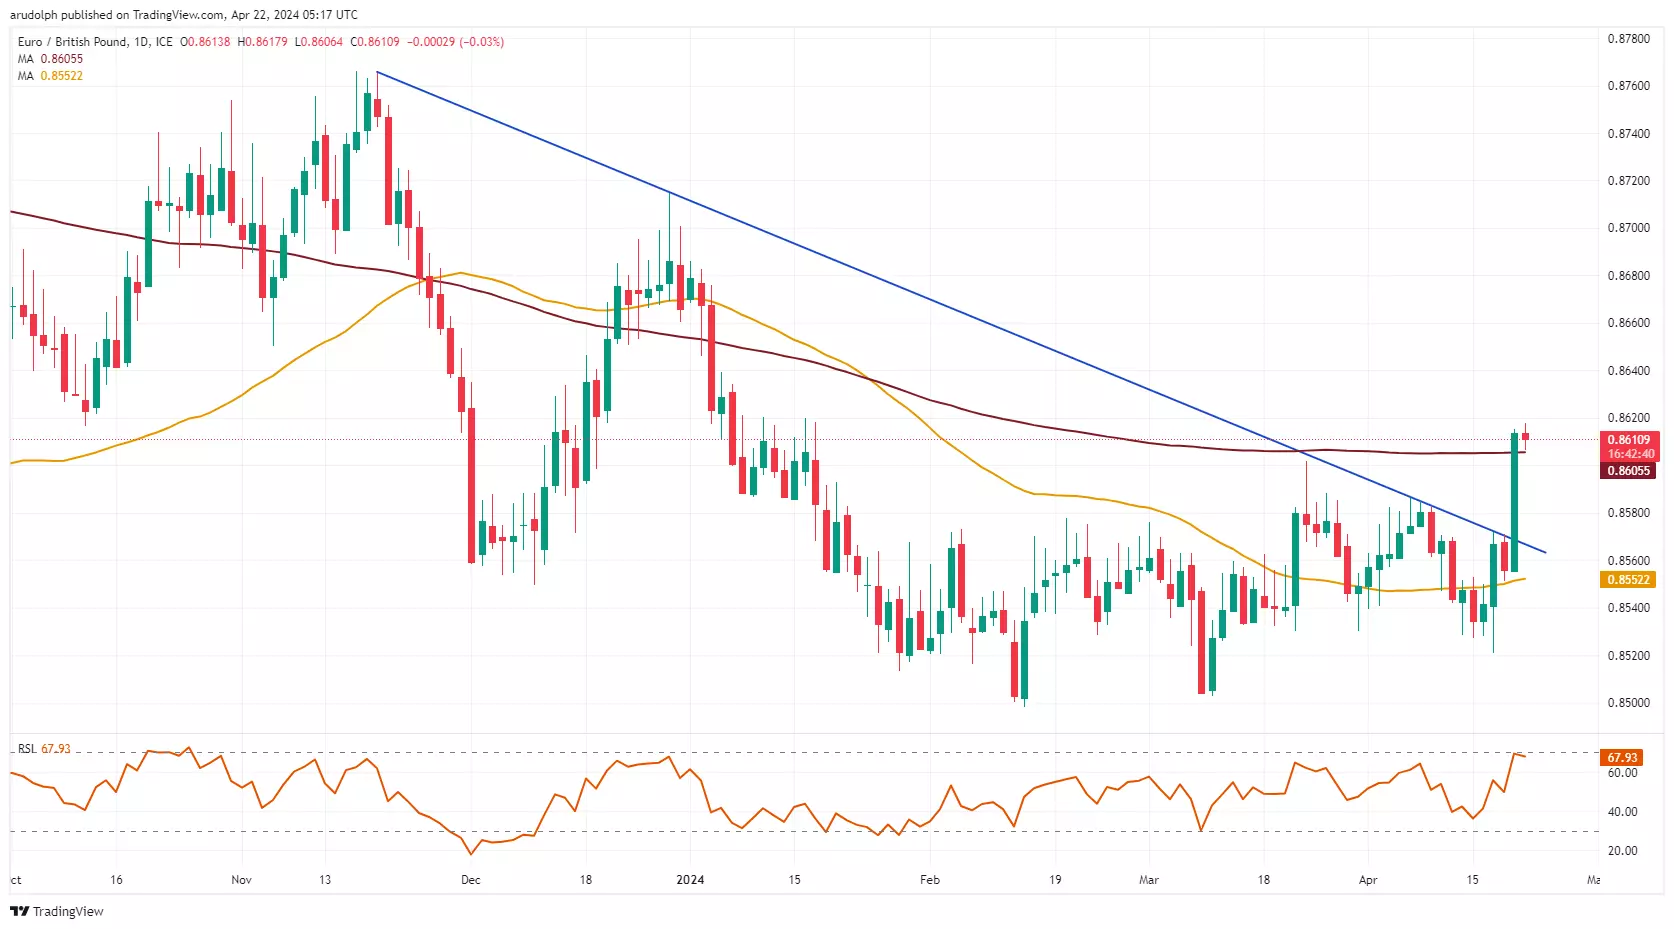
EUR/GBP sees sharp rally
EUR/GBP has swiftly risen above the 200-day simple moving average (SMA) at £0.8605 and reached the October low at £0.8617 which acts as resistance. If bettered, the £0.8630-31 mid-September high and late September low will be in focus. Slips to below the 200-day SMA should find support around the March high at £0.8602. Below it lie the 5 to 9 April highs at £0.8586-82.
 Source: TradingView.com
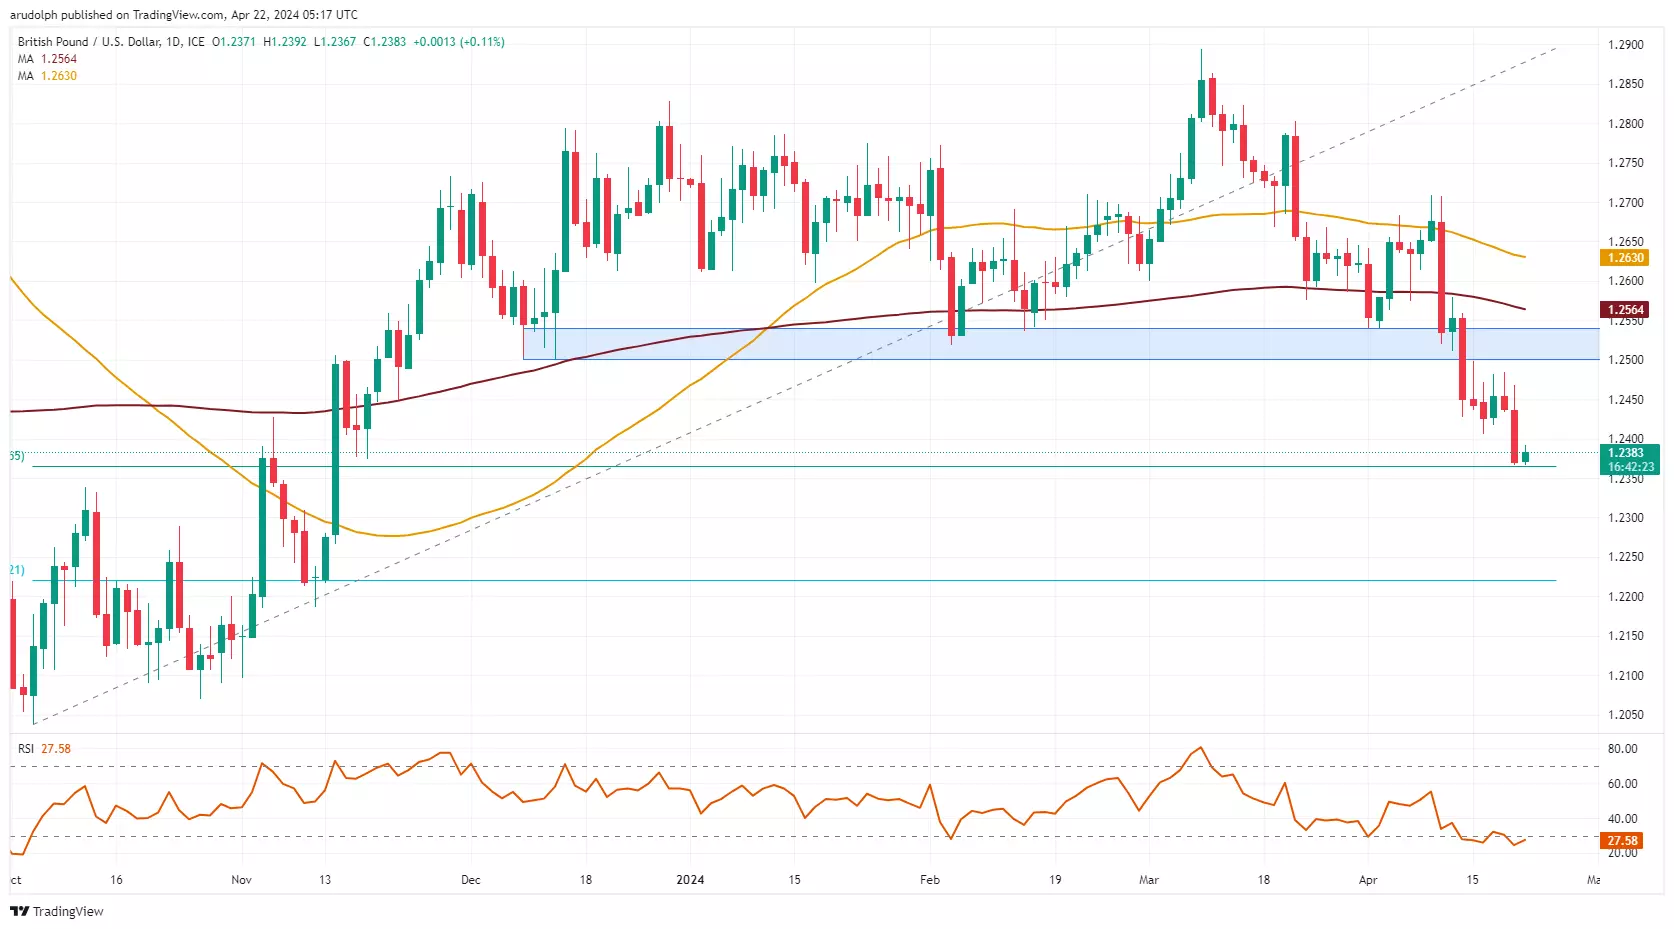
GBP/USD tumbles further
GBP/USD resumed its descent and nears the 61.8% Fibonacci retracement of the October-to-March rise at $1.2365. Further down sits the mid-October high at $1.2338. Minor resistance can be spotted at last Tuesday's $1.2406 low.
 Source: TradingView.com
This information has been prepared by IG, a trading name of IG Markets Limited. In addition to the disclaimer below, the material on this page does not contain a record of our trading prices, or an offer of, or solicitation for, a transaction in any financial instrument. IG accepts no responsibility for any use that may be made of these comments and for any consequences that result. No representation or warranty is given as to the accuracy or completeness of this information. Consequently any person acting on it does so entirely at their own risk. Any research provided does not have regard to the specific investment objectives, financial situation and needs of any specific person who may receive it. It has not been prepared in accordance with legal requirements designed to promote the independence of investment research and as such is considered to be a marketing communication. Although we are not specifically constrained from dealing ahead of our recommendations we do not seek to take advantage of them before they are provided to our clients. See full non-independent research disclaimer and quarterly summary.
-
1 hour ago, CryptoSaint said:
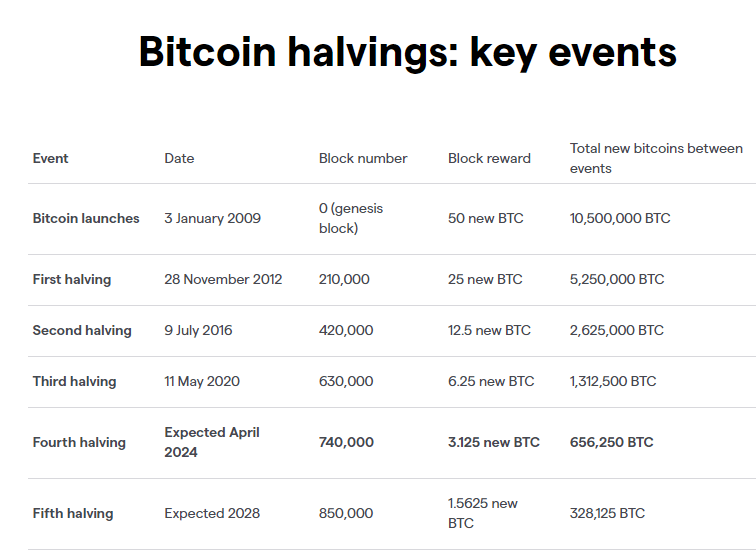
Bitcoin halving, a pivotal event in the cryptocurrency world, occurs roughly every four years, reducing the reward for mining new blocks by 50%. This mechanism is encoded in Bitcoin's blockchain software to regulate the issuance of new bitcoins and ensure the total supply does not exceed 21 million coins.

Thanks for sharing @CryptoSaint
-
-
Gold and oil prices volatile after Middle East news, while natural gas price moves higher for a fourth day
News of a possible Israeli counter-strike against Iran lifted oil and gold prices before both rapidly retreated, while natural gas is continuing to edge higher.
 Source: Bloomberg
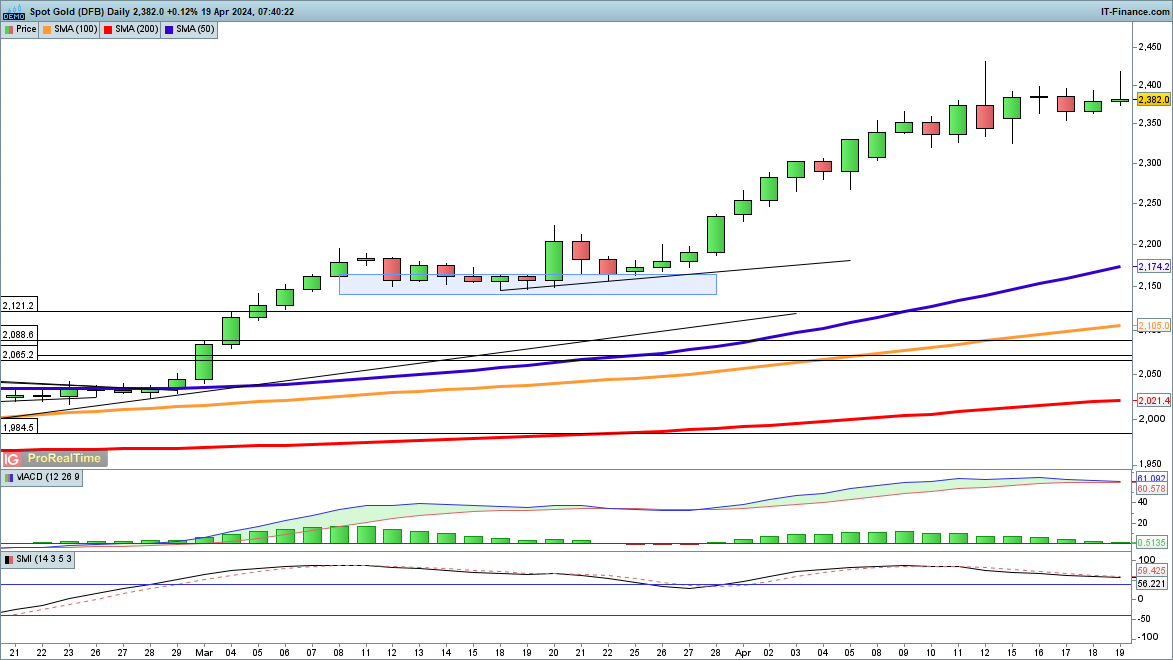
Gold knocked back from $2400 again
Gold prices once again attempted to clear $2400, but ran into selling pressure for the second time. This pause to upward progress might signal that some short-term weakness is at hand, though there is at present little sign of any renewed downside. Buyers need a a close above $2400 to open the way to additional upside.
 Source: ProRealTime
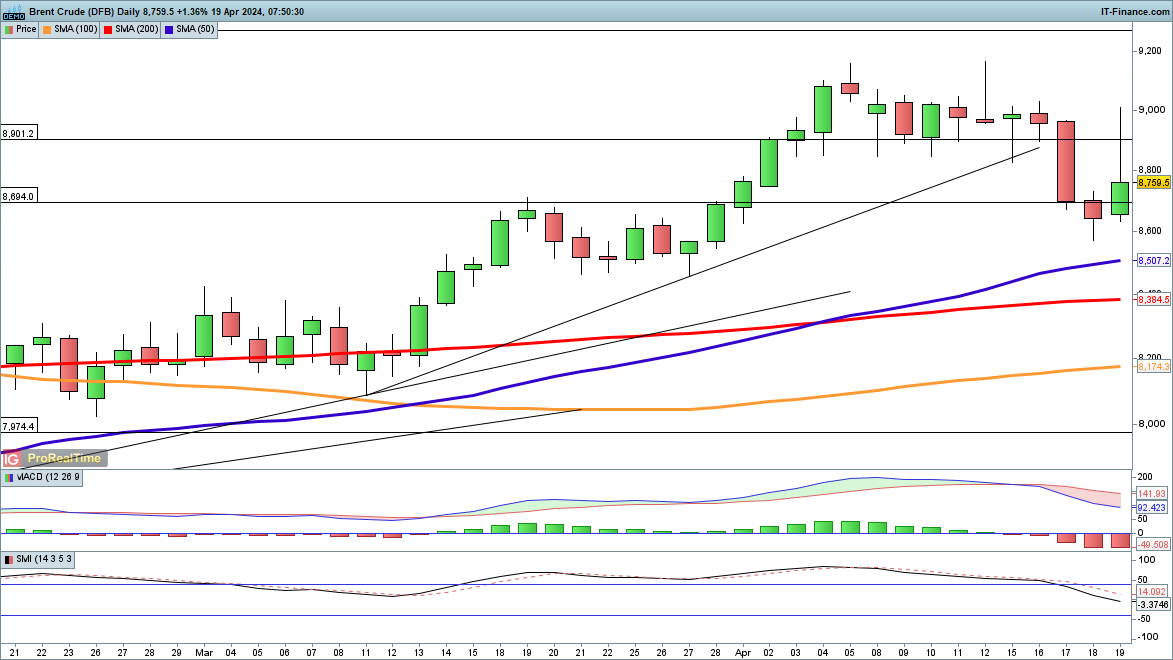
Brent spikes on Middle East tensions
Oil prices had been under firm pressure in the previous two days, but spiked higher on news of a possible Israeli strike in Iran. The limited nature of the strike, and the muted Iranian response, meant that the price could not sustain gains, and the price fell back from its highs. However, if the $86 low can hold from Thursday then a short-term move higher may develop, particularly if tensons in the Middle East continue to rise.
 Source: ProRealTime
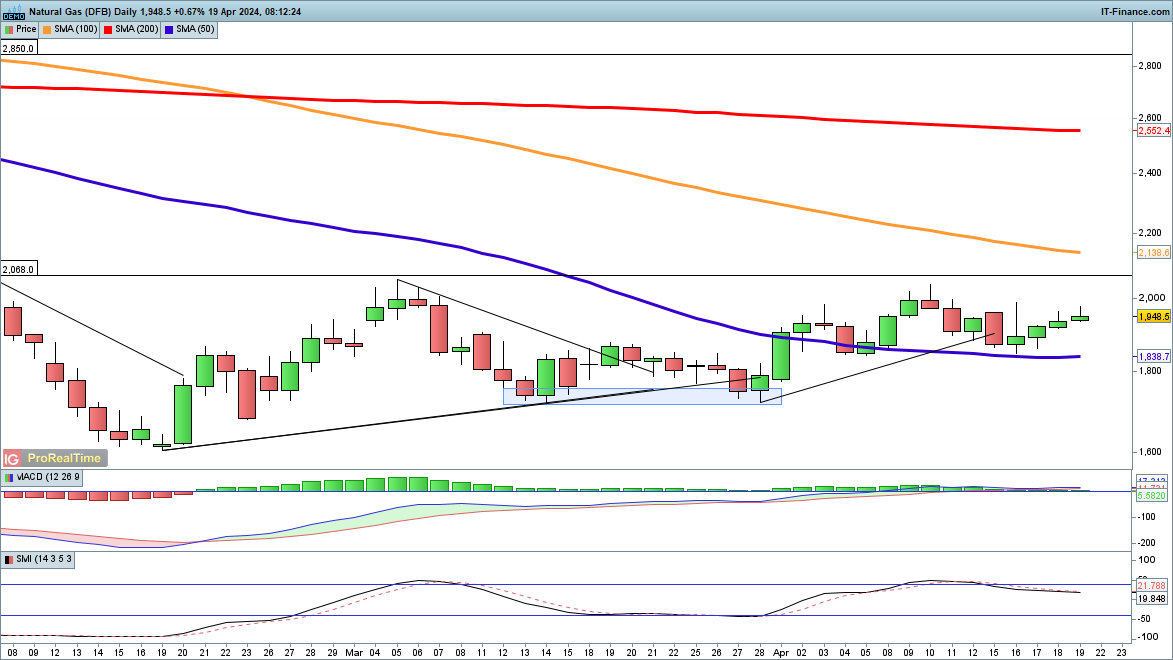
Natural Gas moves higher
Natural gas prices have edged higher over the past four sessions, rallying off the 50-day SMA. Further gains would target the $2000 level, and then on the 100-day SMA at $2138. A more bearish view would require a close back below the 50-day SMA.
 Source: ProRealTime
-
FTSE 100, DAX 40 and S&P 500 drop on Israel retaliatory strike on Iran
Outlook on FTSE 100, DAX 40 and S&P 500 as investors fret about escalating tensions in the Middle East.
 Source: Bloomberg
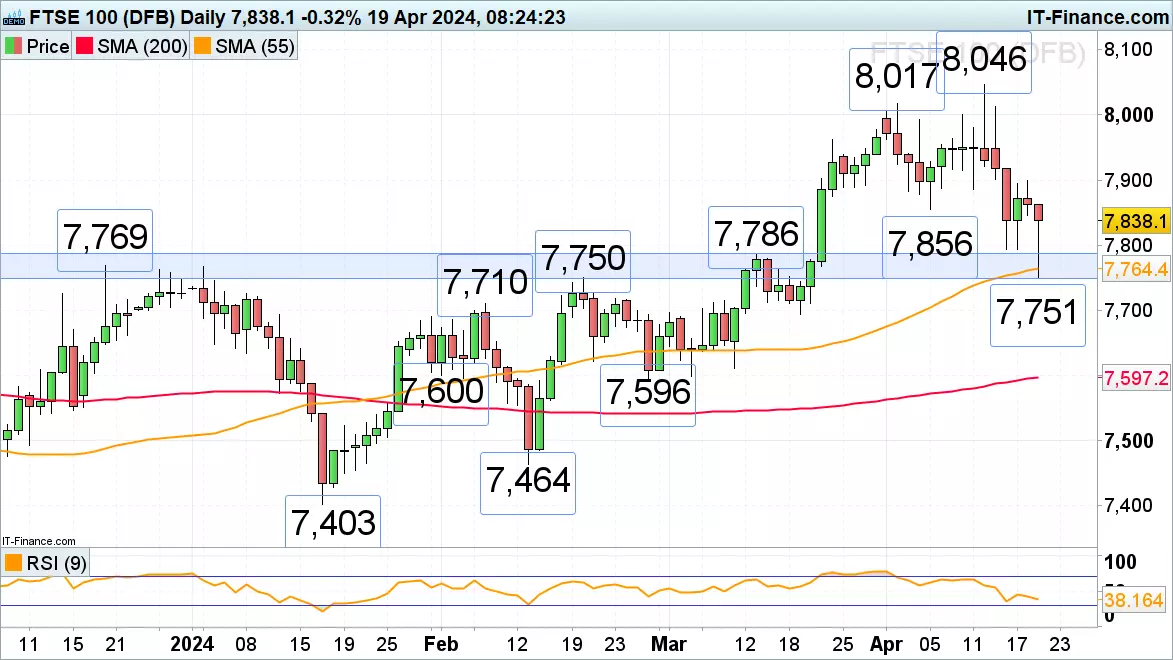
FTSE 100 stabilizes following sharp out-of-hours drop
The FTSE 100 dropped like a stone to its late February high at 7,751 as Israel fired missiles at Iran in a retaliatory attack in out-of-hours trading. Even though the index still opened lower, it has so far regained the majority of its intraday losses as hopes that further escalation will not take place become more prevalent. While no rise above Thursday’s high at 7,899 is seen, though, the FTSE 100 remains under pressure and may revisit Tuesday’s low at 7,794. Minor resistance sits at the early April 7,856 low.
 Source: ProRealTime
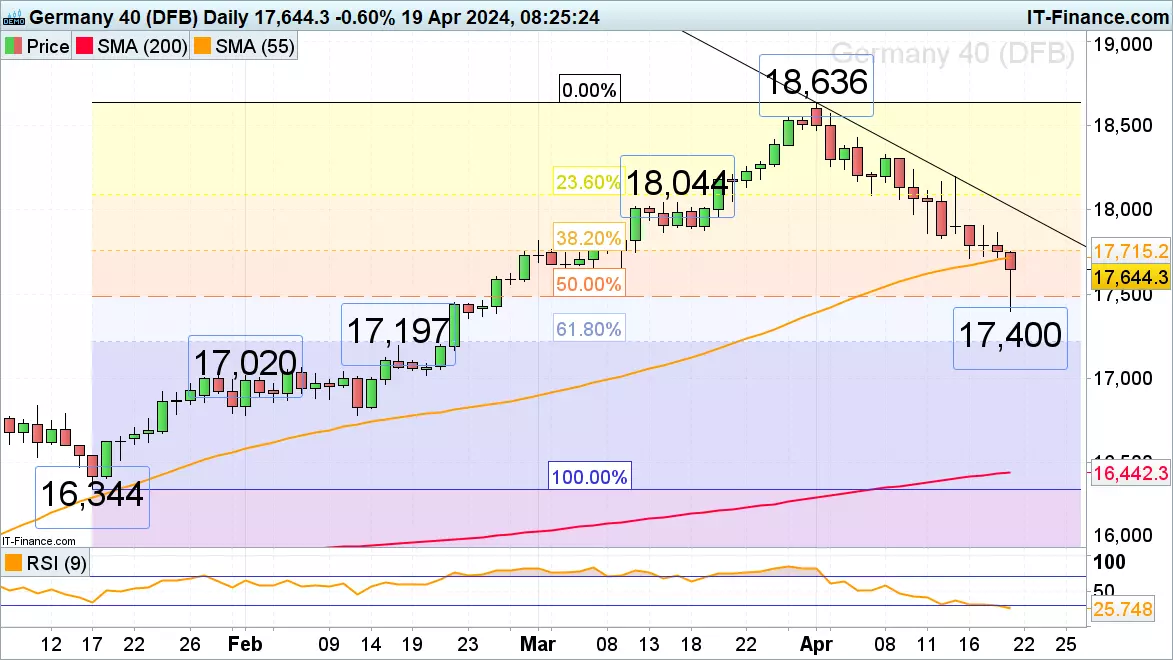
DAX 40 drops to levels last seen in February
The DAX 40 fell to levels last traded in late February when it hit the 17,400 mark on Middle East escalation as Israel launched missiles at Iran. The index is trying to heave itself above the 55-day simple moving average (SMA) at 17,715 which may act as resistance with the 17,711 low seen on Tuesday. Further resistance sits at last Friday’s 17,831 low. For the bulls to even short-term be in control again, a bullish reversal and rise above Tuesday’s high at 17,903 needs to ensue. Support is found at the 7 March 17,619 low and the 50% retracement of the mid-January to April advance.
 Source: ProRealTime
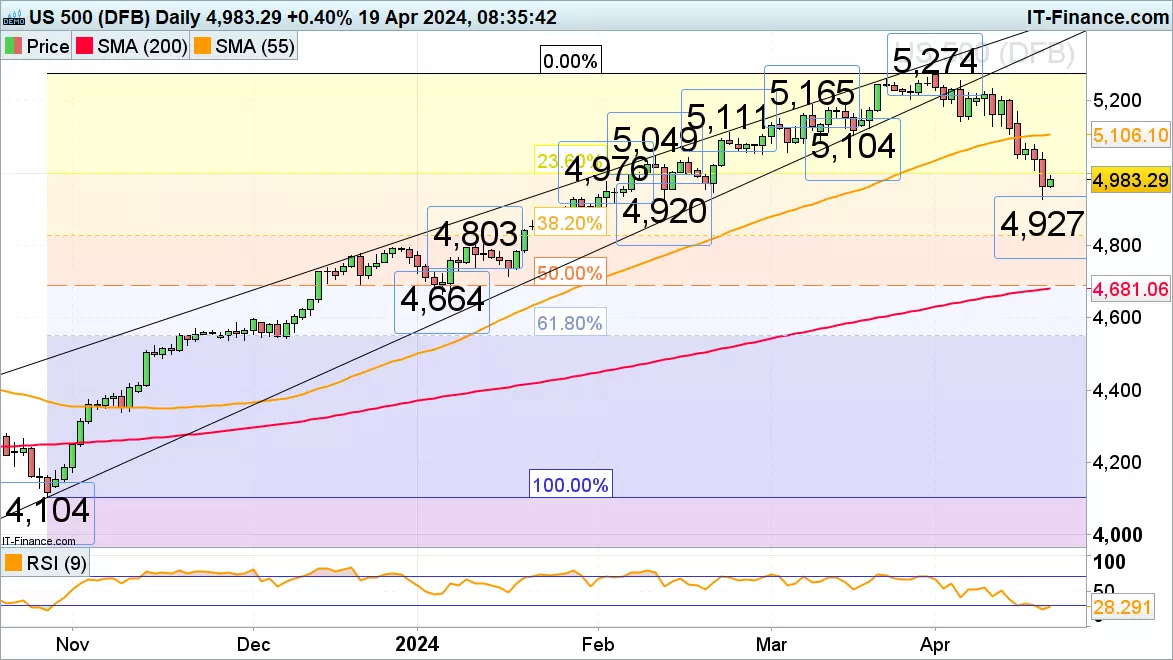
S&P 500 slips to two-month low
The S&P 500 is on track for its third consecutive week of losses as it hit levels last traded in mid-February at 4,927 amid a retaliatory missile strike by Israel on Iran. The index is trying to remain above this low but will now have the psychological 5,000 mark to contend with which should act as resistance. Further up the mid-February high at 5,049 may also act as resistance. Below today’s intraday low at 4,927 lies the 4,920 mid-February low.
 Source: ProRealTime
-
23 hours ago, phillo said:

Trading volatility: DXY on US Q1 GDP
With the US economy seemingly able to cope with relatively high US interest rates there’s the potential for this coming week's US GDP reading for Q1 to be strong.
If this comes to pass there will inevitably be a long trade to be had around the US dollar. IGTV’s Jeremy Naylor looks at likely levels which may be key. The data is out on Thursday 25 April.
(AI Video Summary)
U.S. GDP data
Anticipation of strong U.S. GDP data for the first quarter, expected to affirm the resilience of the U.S. economy amid high interest rates. This optimism is reflected in the forecast of the U.S. dollar's strength, particularly noted in the dollar basket's potential movement.
Traders are advised to watch for a break above 106.19 in the dollar basket, suggesting a move to 106.98 on a robust GDP outcome. This analysis is tied to expectations that the Federal Reserve may maintain its hawkish stance on interest rates to combat inflation, impacting dollar positions and providing key insights for financial enthusiasts interested in currency markets and economic indicators.
This information has been prepared by IG, a trading name of IG Markets Limited. In addition to the disclaimer below, the material on this page does not contain a record of our trading prices, or an offer of, or solicitation for, a transaction in any financial instrument. IG accepts no responsibility for any use that may be made of these comments and for any consequences that result. No representation or warranty is given as to the accuracy or completeness of this information. Consequently any person acting on it does so entirely at their own risk. Any research provided does not have regard to the specific investment objectives, financial situation and needs of any specific person who may receive it. It has not been prepared in accordance with legal requirements designed to promote the independence of investment research and as such is considered to be a marketing communication. Although we are not specifically constrained from dealing ahead of our recommendations we do not seek to take advantage of them before they are provided to our clients. See full non-independent research disclaimer and quarterly summary.
-
Alphabet's integration of generative Artificial Intelligence (AI) into search and ads services, as well capital expenditure will likely be a key focus for investors.
Key takeaways:
- Earnings Expectations: Alphabet Inc. will release its Q1 2024 earnings on April 25th, with analysts projecting revenues of $69.787 billion and earnings per share (EPS) of $1.89.
- Revenue Diversification and Challenges: Despite a flat performance of its services segment being expected, Alphabet is seeing significant growth in its cloud computing division
- Market Focus on AI: Markets are particularly keen on understanding Alphabet's strategy and progress in integrating generative Artificial Intelligence (AI) into its search and advertising services.
- Stock Price Analysis: Alphabet’s Class C shares have an average 12-month price target of $168.64 among analysts
- Technical Outlook: Alphabet’s stock remains in a long-term uptrend but is undergoing a short term correction thereof
When are the Alphabet results?
Alphabet Inc. is set to report Q1 2024 earnings on the 25th of April 2022.
What ‘the Street’ expects from Alphabet Q1 2024 results?
A Refinitiv poll of analyst estimates (as of the 18th of April 2024) arrives at the following:
- Revenue for the quarter of $69.787bn
- Earnings per share for the quarter of $1.89
Googles services segment remains the largest contributor to revenue ($61.961bn expected) and is expected to be roughly flat year on year.
Googles cloud segment is forecast to be the growth driver for the group adding around 28% y/y revenue growth reaching a figure of $7.546bn.
The groups ‘other bets’ division, is expected to see a 35% contraction in its revenue contribution to group at around $288m.
Markets will be looking for further news around the company’s involvement and integration of generative Artificial Intelligence (AI) into search and ads services. Capital expenditure will likely also be a key focus relative to investment into cloud and AI, and in lieu of recent cost cutting initiatives.
How to trade Alphabet results
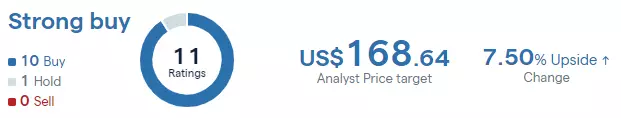 Source: IG TipRanks
Based on 11 Wall Street analysts offering 12 month price targets for Alphabet Class C in the last 3 months. The average price target is US$168.64 with a high forecast of US$185.00 and a low forecast of US$160.00. The average price target represents a 7.50% change from the last price of US$156.87.
 Source: IG
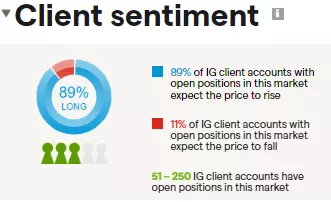
89% of IG client accounts with open positions on Alphabet as of the 18th of April 2024, expect the price to rise in the near term, while 11% expect the price to fall.
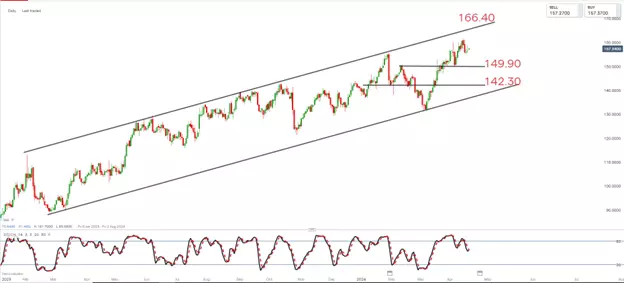
Alphabet (Class C) share price – technical view
 Source: IG
The share price of Alphabet Inc. remains in a long-term uptrend. In the near term we are seeing a correction of this uptrend from recent highs and overbought territory.
Trend followers might wait for weakness to play out before looking for long entry in line with the longer-term uptrend. Confirmation that the short-term correction has ended, and that the longer-term uptrend is resuming might be considered on a bullish price reversal closer towards either the 149.90 or 142.30 support levels. In this scenario channel resistance provides a longer-term upside target of around 166.40.
This information has been prepared by IG, a trading name of IG Markets Limited. In addition to the disclaimer below, the material on this page does not contain a record of our trading prices, or an offer of, or solicitation for, a transaction in any financial instrument. IG accepts no responsibility for any use that may be made of these comments and for any consequences that result. No representation or warranty is given as to the accuracy or completeness of this information. Consequently any person acting on it does so entirely at their own risk. Any research provided does not have regard to the specific investment objectives, financial situation and needs of any specific person who may receive it. It has not been prepared in accordance with legal requirements designed to promote the independence of investment research and as such is considered to be a marketing communication. Although we are not specifically constrained from dealing ahead of our recommendations we do not seek to take advantage of them before they are provided to our clients. See full non-independent research disclaimer and quarterly summary.
-
Mainland Chinese stock markets bucked the broader selloff trend in Asian markets on Wednesday. China's CSI 300 index rose 0.5%, while the CSI 2000 small-cap index surged 5.3%. This came after the Chinese securities regulator stated that companies not complying with calls to increase dividend payouts will not face mass delistings, providing relief. In contrast, Japan's Topix index fell 0.9% despite strong March trade data showing rising exports. UK inflation data showed consumer prices rose 3.2% annually in March, higher than expected at 3.1%, renewing debate on when the Bank of England may start cutting rates. Core UK inflation eased to 4.2% from 4.5% in February but was still above the 4.1% forecast. In the US, stocks closed lower for the third straight session on Tuesday. The S&P 500 slid 0.2% and Nasdaq lost 0.1% after Fed Chair Powell warned rates may need to stay higher for longer to tame inflation.

-
2 hours ago, capitulinagarage said:
This is like the Super Bowl for crypto folks, right?
Bitcoin halving is set for this week.
The cryptocurrency was hit hard over the weekend after Iran carried out a series of strikes against Israeli territory. The attack, in response to Israel’s attack on Iran’s consulate in Syria at the start of the month, saw in excess of 350 drones and missiles launched by Iran. According to the Israel Defence Force (IDF), ‘99%’ of these ‘threats’ were successfully intercepted. With the cryptocurrency sector being the only market open over the weekend, traders used the sector’s liquidity to hedge risk. Bitcoin hit a low of $60.6k as news of the impending strike filtered through, while Ethereum hit a multi-week low of $2,845. In the altcoin space, losses of 25% or more were seen, sparking multiple liquidation stories. Prices across the board are pushing higher today, but the weekend’s losses will take some time to fully recover.
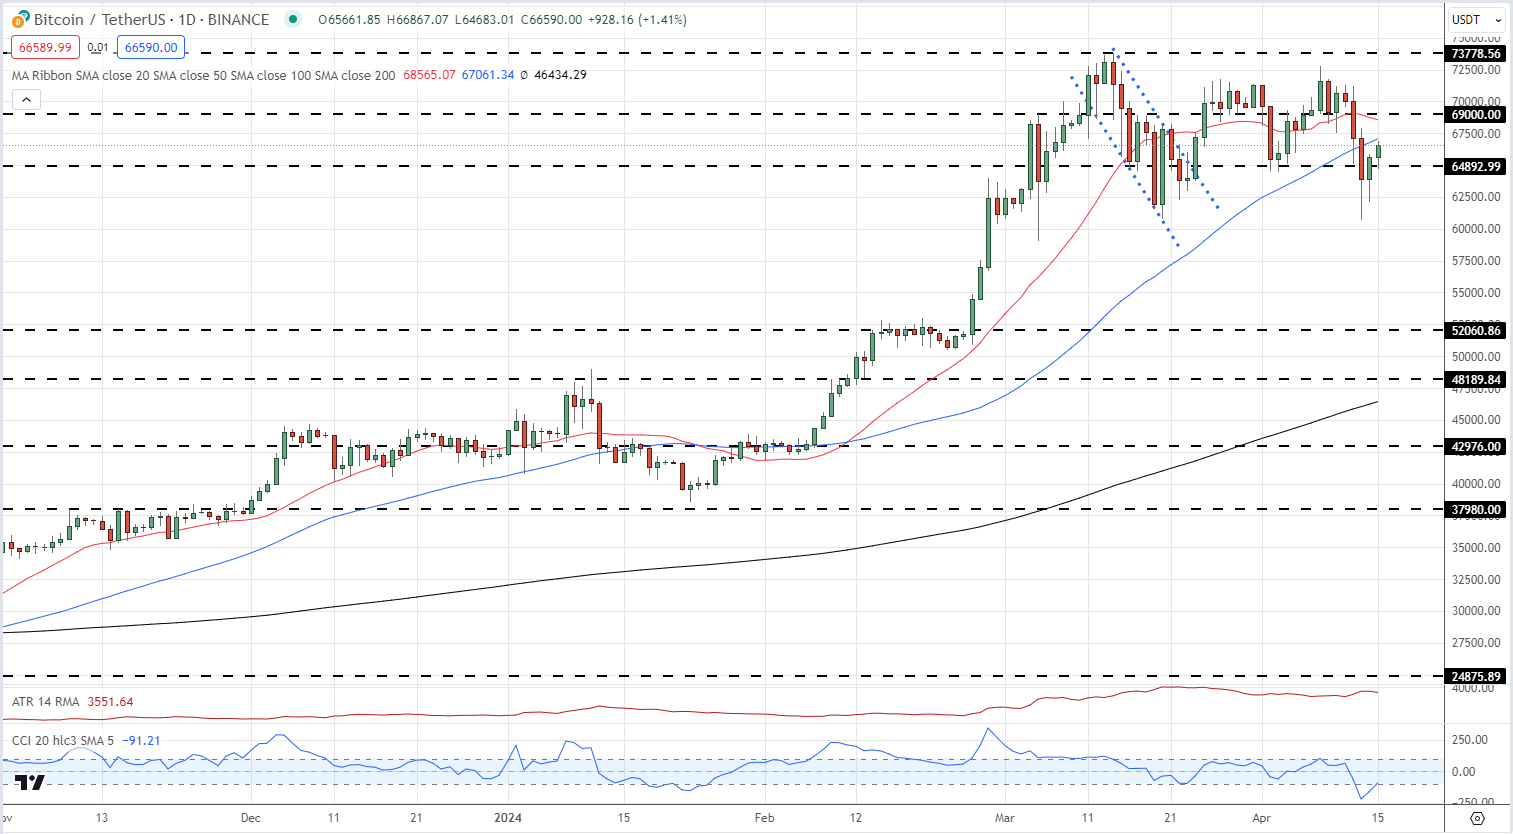
The weekend sell-off saw Bitcoin fall below both the 20- and 50-day simple moving averages for the first time since late January. Both of these will need to be recovered convincingly, along with a prior resistance-turned-support level at $69k, before Bitcoin can make a fresh attempt at the mid-March $73.78k all-time high.
BITCOIN DAILY PRICE CHART – APRIL 15TH, 2024
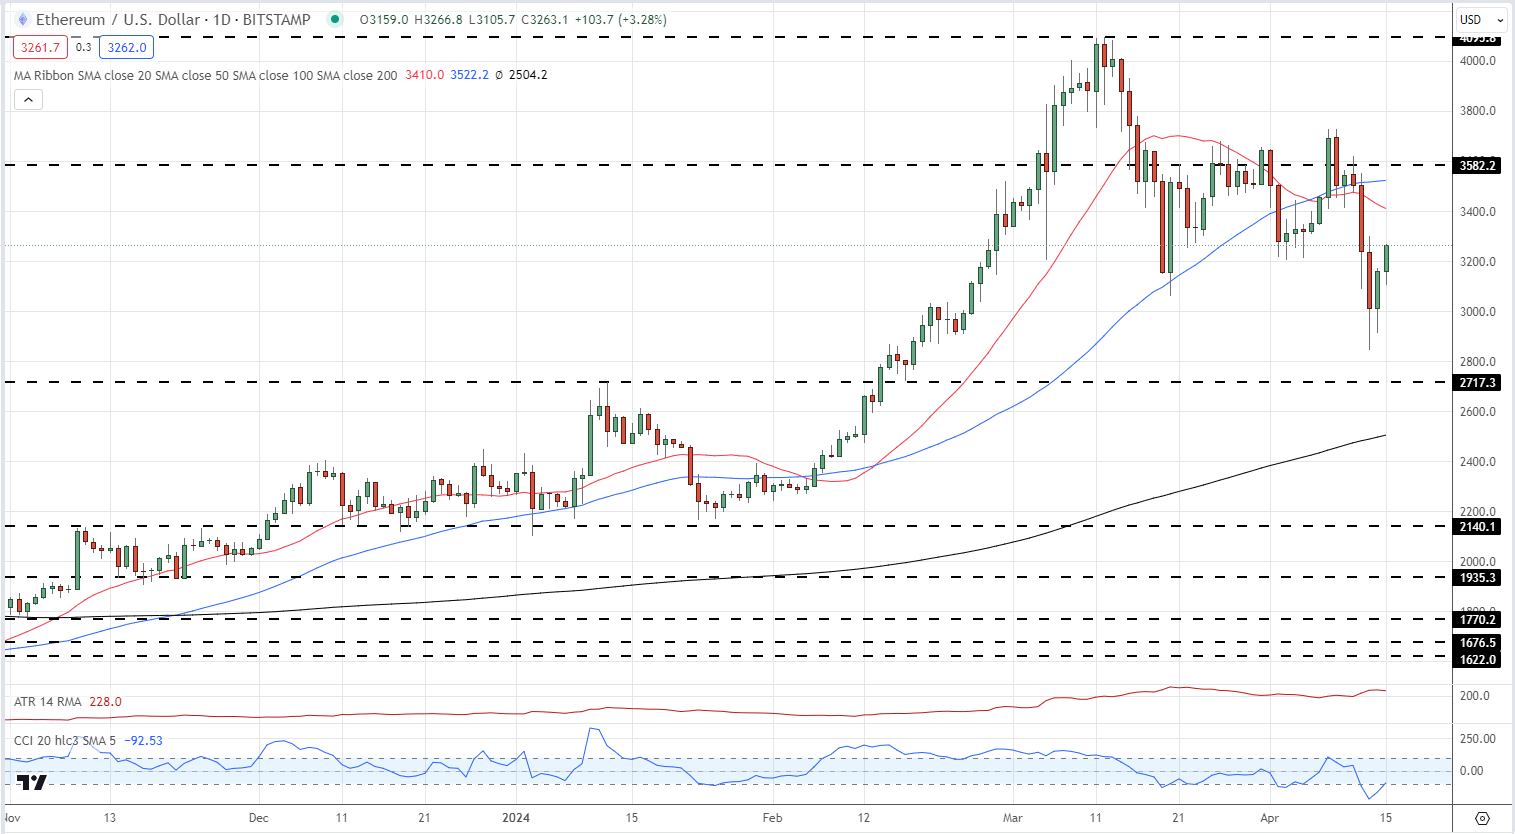
Ethereum is over 3% higher today after making a multi-month low of $2,845 on Saturday. Ethereum must reclaim both the 20- and 50-day moving averages before $ 3,582 comes back into play. Above here, the April 8th/9th double high at $3,728 comes into focus.
ETHEREUM DAILY PRICE CHART – APRIL 15TH, 2024
All charts via TradingView
What is your view on Bitcoin and Ethereum – bullish or bearish?
Apr 15, 2024 1:30 PM +02:00
Nick Cawley,
Senior Strategist DailyFX -
Rising geopolitical tensions in the Middle East and expectations of higher US interest rates for longer have dampened risk appetite in financial markets. This led to a sell-off in Asian stocks, a strengthening US dollar, and further weakness in the Japanese yen to levels not seen since the mid-1990s against the dollar. European markets are expected to open sharply lower, with a focus on UK labour and wage data for clues on when the Bank of England may start cutting rates. Markets see August as most likely for BoE rate cuts to begin. The Federal Reserve is seen as unlikely to rush rate cuts after strong US retail sales data. Market pricing now sees less than two Fed rate cuts in 2024 instead of the six expected earlier. Safe-haven flows are boosting demand for the US dollar and gold amid Middle East tensions. China's GDP beat estimates but weak March data raised concerns about its economic recovery. UK employment data showed a rise in the unemployment rate for February, to 4.2%, while wage growth remained steady at 5.6%.
-
Gold's climb stalls despite strong central bank and Chinese buyer interest, while silver meets key resistance, spotlighting pivotal movements in metals market.
 Source: Bloomberg
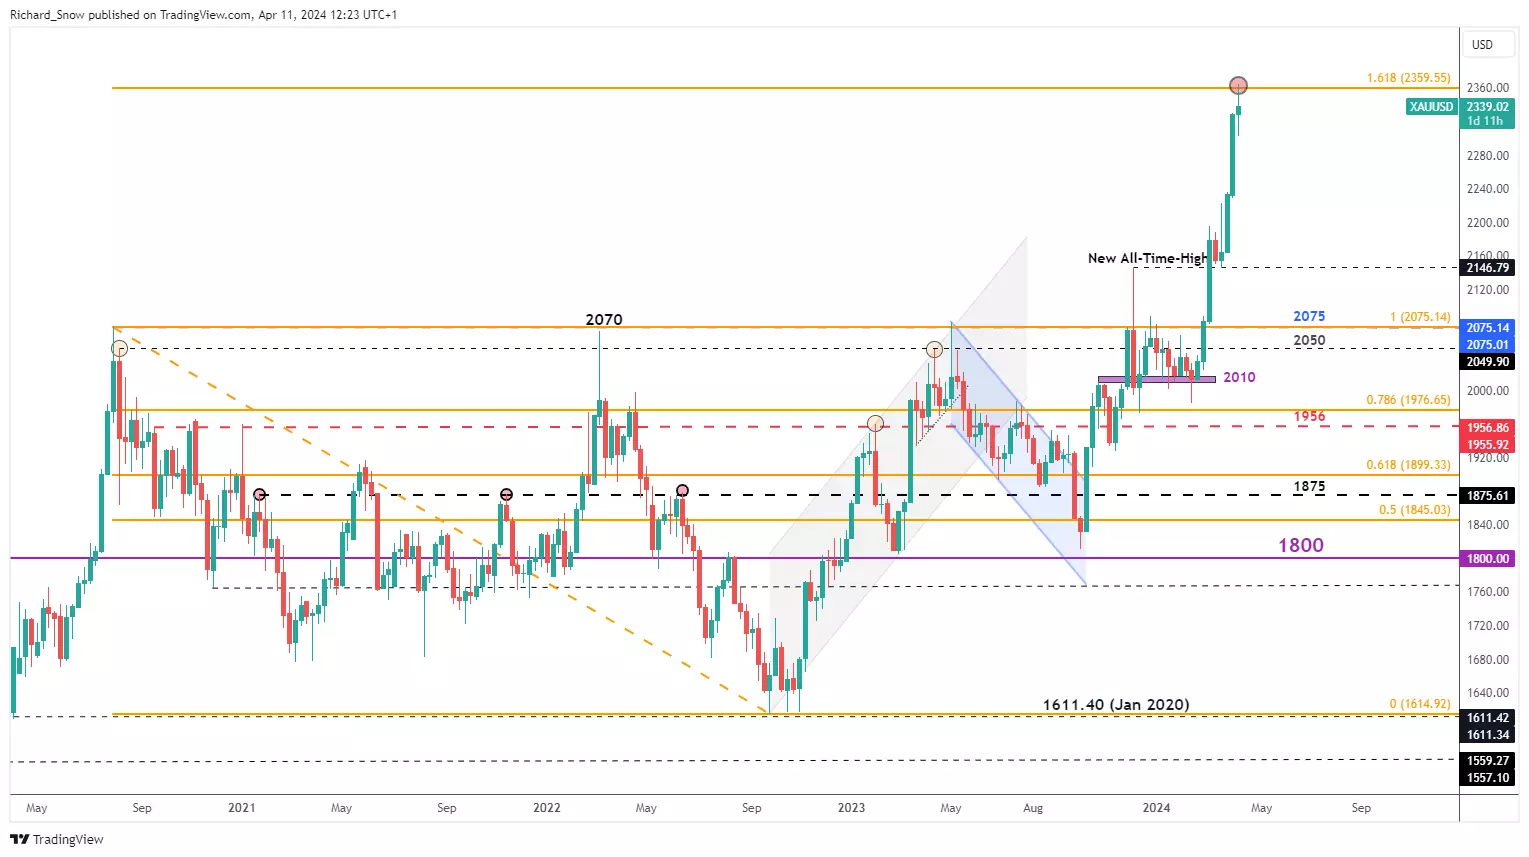
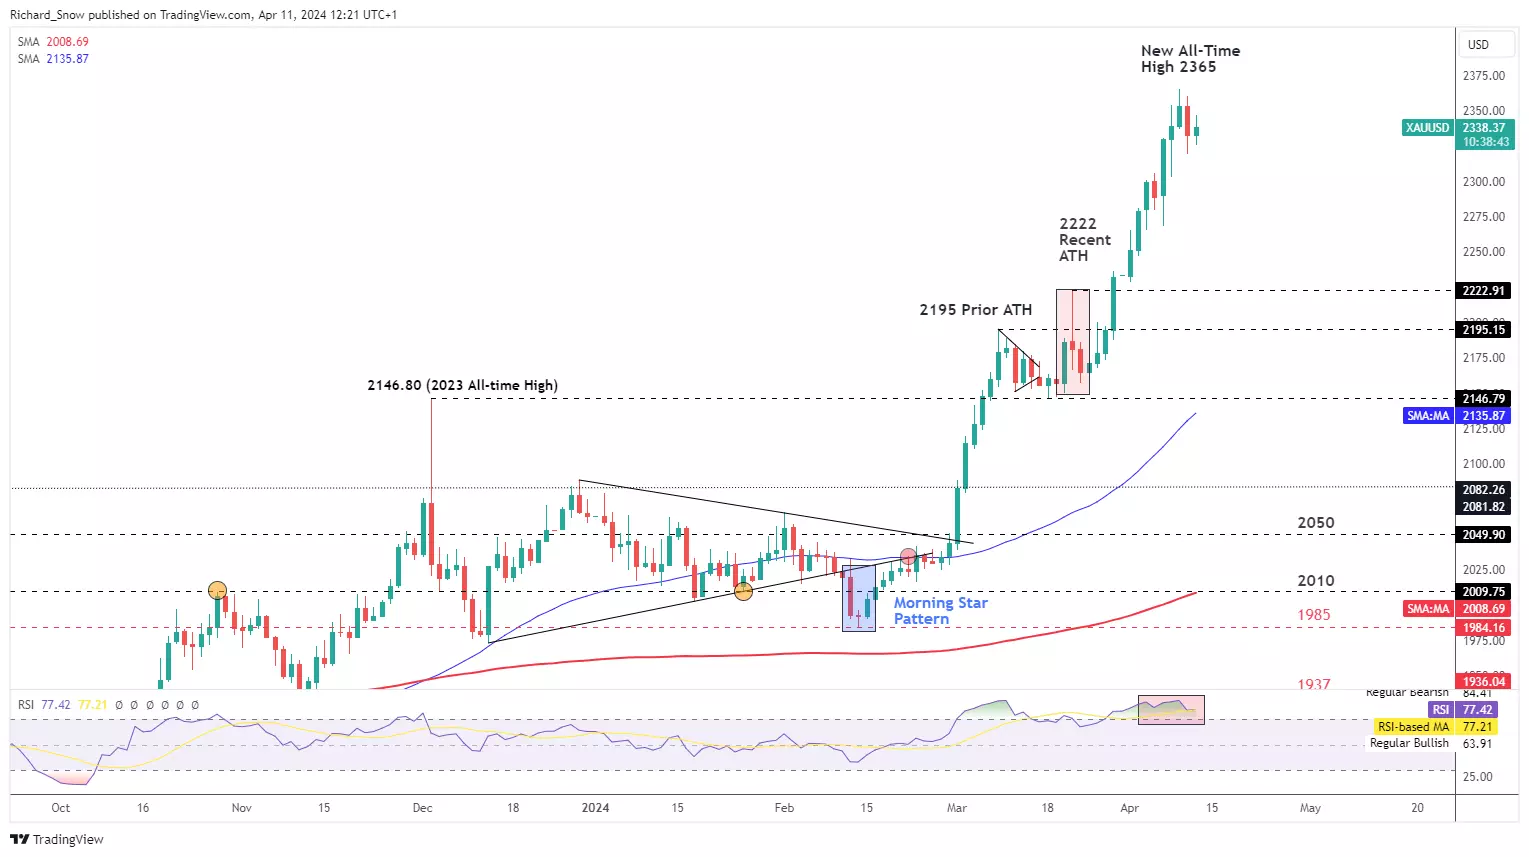
Gold retreats after tagging 1.618 Fibonacci extension
The weekly gold chart showcases the precious metal’s bullish continuation, taking out numerous all-time highs with ease. The prospect of fewer rate cuts from the Fed and a stronger US dollar have hardly affected the high-flying commodity, which continues to thrive on solid central bank buying; and a pickup in retail purchases from Chinese citizens.
With gold breaking new ground, resistance targets are difficult to come by. Therefore, the 1.618% extension of the major 2020 to 2022 major decline helps project the next upside challenge at $2360. Price action does appear to have pulled away from the level, but the move is minor at this juncture.
Gold weekly chart
 Source: TradingView
The daily chart portrays the extent to which this market is overheating, with the RSI continuing to trade in overbought territory. Prices trade well above both the 50 and 200-day simple moving averages, a bullish landscape for the metal.
Today, gold appears to be stabilising after yesterday’s hot CPI data which propelled yields and the dollar higher – effectively adding a premium to the price of gold for overseas buyers.
The sheer pace of the advance suggests the invalidation levels for the bullish outlook appear at the prior all-time high of $2195. Even a move to the $2222 level wouldn’t necessarily rule out a further bullish move, but it may prompt a reassessment of the bullish bias.
Gold daily chart
 Source: TradingView
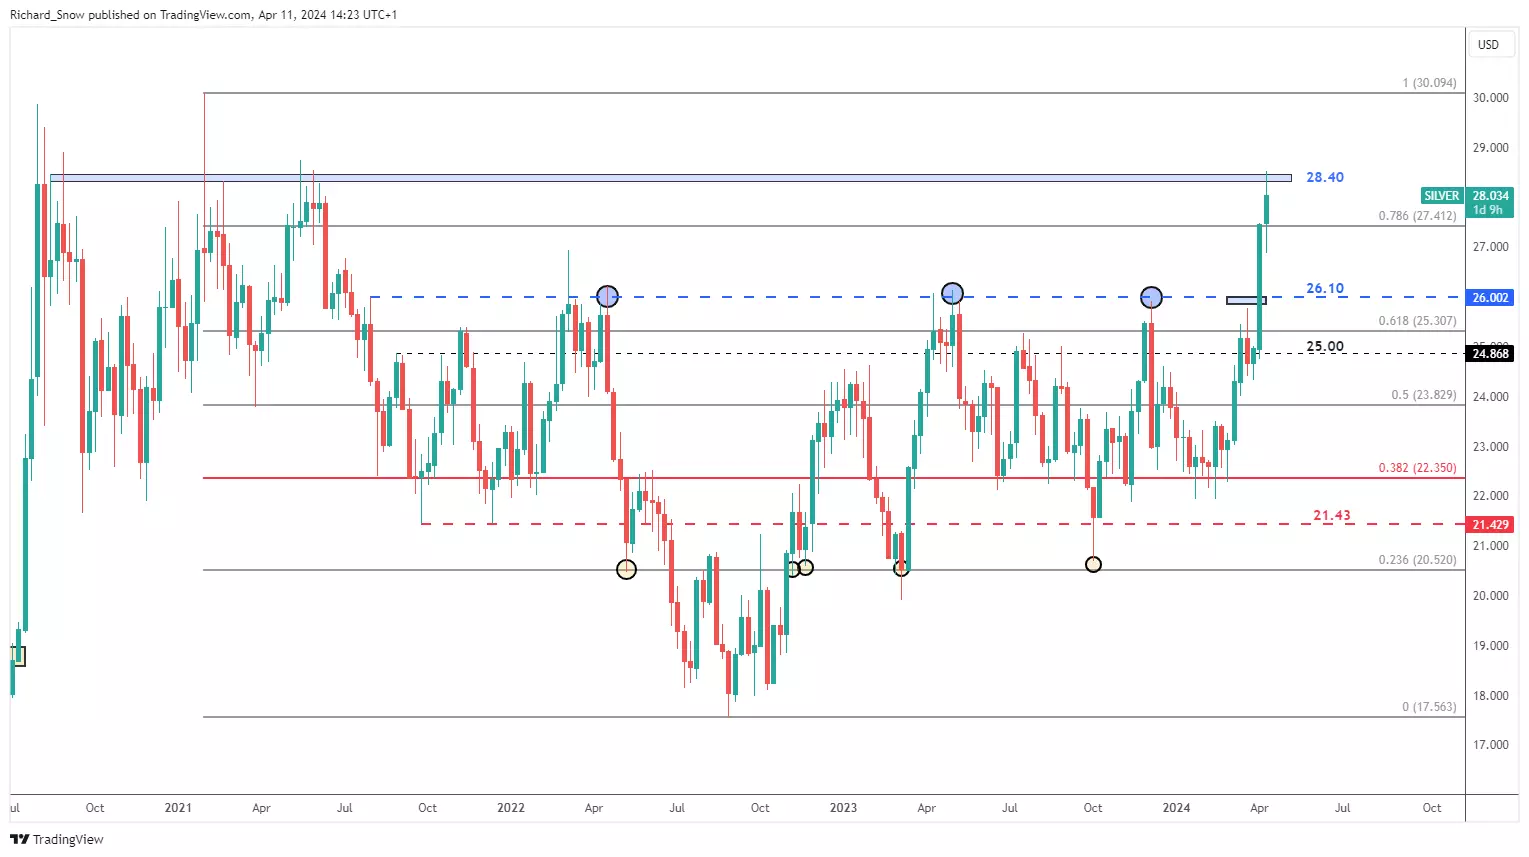
Silver hits a prior, longer-term zone of resistance
Silver, like gold, continues its bullish advance, but has recently hit a zone of resistance that appeared in late 2020, and early 2021. The zone appears around $28.40 and capped silver prices around the Covid boom. The next target to the upside is $30.10 which represents a full retracement of the 2021 to 2022 decline.
Should the level propel bulls from here, the 78.6% retracement comes into play at $27.41, followed by $26.10.
Silver weekly chart
 Source: TradingView
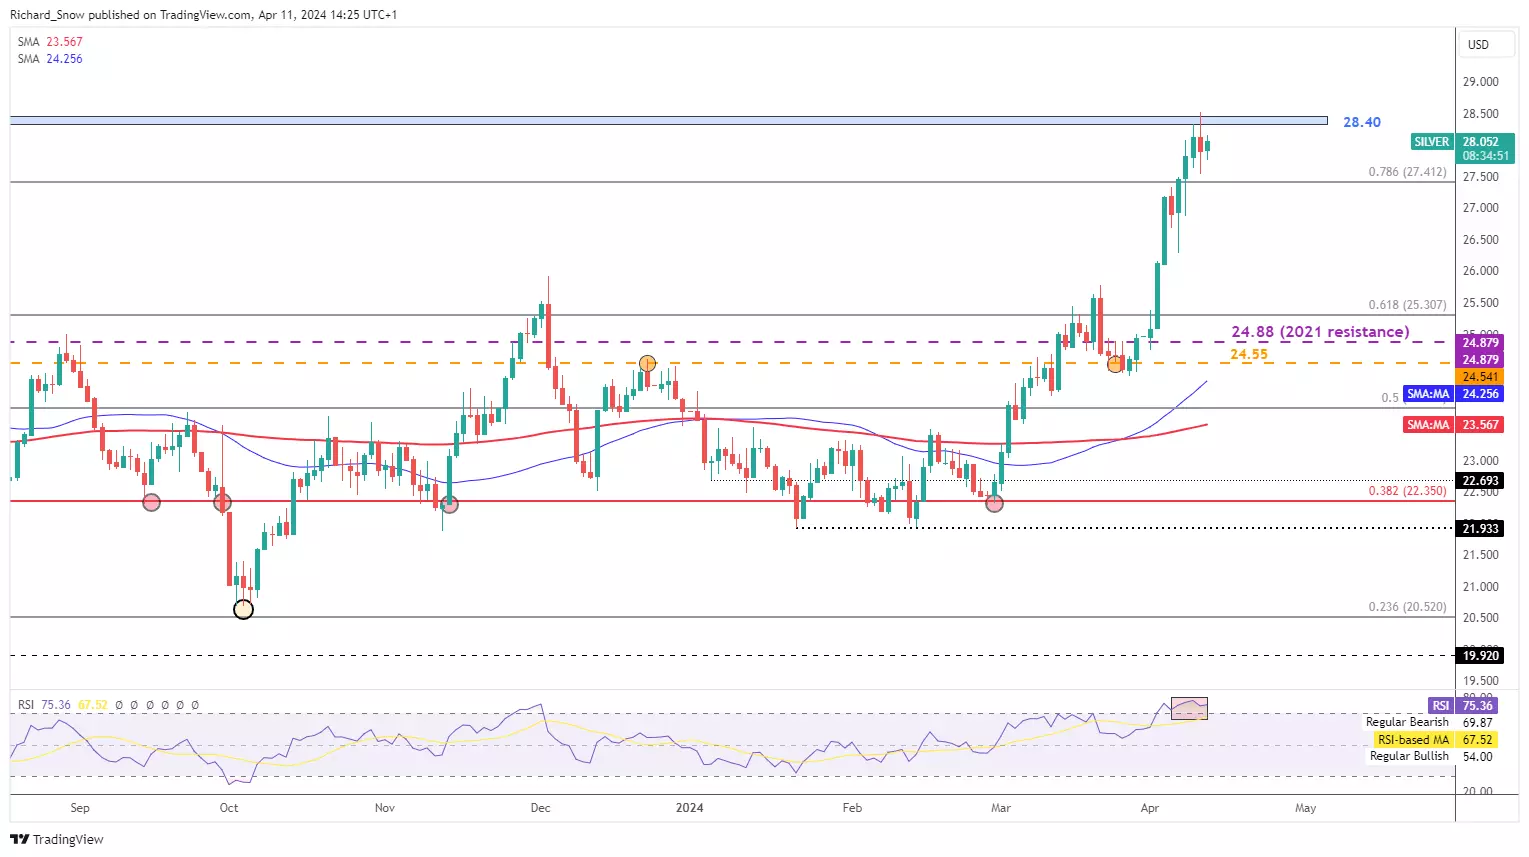
The daily chart hones in on recent price action, which appears to stabilise beneath the zone of resistance. Notably, the RSI flashes red as silver continues to trade in overbought territory, suggesting bulls may need to catch their breath.
Silver daily chart
 Source: TradingView
This information has been prepared by IG, a trading name of IG Australia Pty Ltd. In addition to the disclaimer below, the material on this page does not contain a record of our trading prices, or an offer of, or solicitation for, a transaction in any financial instrument. IG accepts no responsibility for any use that may be made of these comments and for any consequences that result. No representation or warranty is given as to the accuracy or completeness of this information. Consequently any person acting on it does so entirely at their own risk. Any research provided does not have regard to the specific investment objectives, financial situation and needs of any specific person who may receive it. It has not been prepared in accordance with legal requirements designed to promote the independence of investment research and as such is considered to be a marketing communication. Although we are not specifically constrained from dealing ahead of our recommendations we do not seek to take advantage of them before they are provided to our clients.
-
A generally weak session in Asia overnight saw the Hang Seng tumble 1.5%. Yesterday's ECB meeting left investors expecting that central bank will be the first to cut rates, with June the likely point. The BoE is expected to follow in August, and the Fed in September, a sharp change from the start of the year, when markets were forecasting a March rate cut. The Japanese yen remains near 34-year lows against the US dollar, prompting intervention warnings from Japan's finance minister. European equities are set for another weekly decline, while the start of the U.S. earnings season with big banks reporting could impact market direction.

-
-
Bitcoin (BTC), Coinbase (COIN) - Prices, Charts, and Analysis:
- Bitcoin is set to print a new all-time high, possibly this week.
- Bitcoin halving event expected on April 19th.
- Coinbase is benefitting from a buoyant cryptocurrency market.
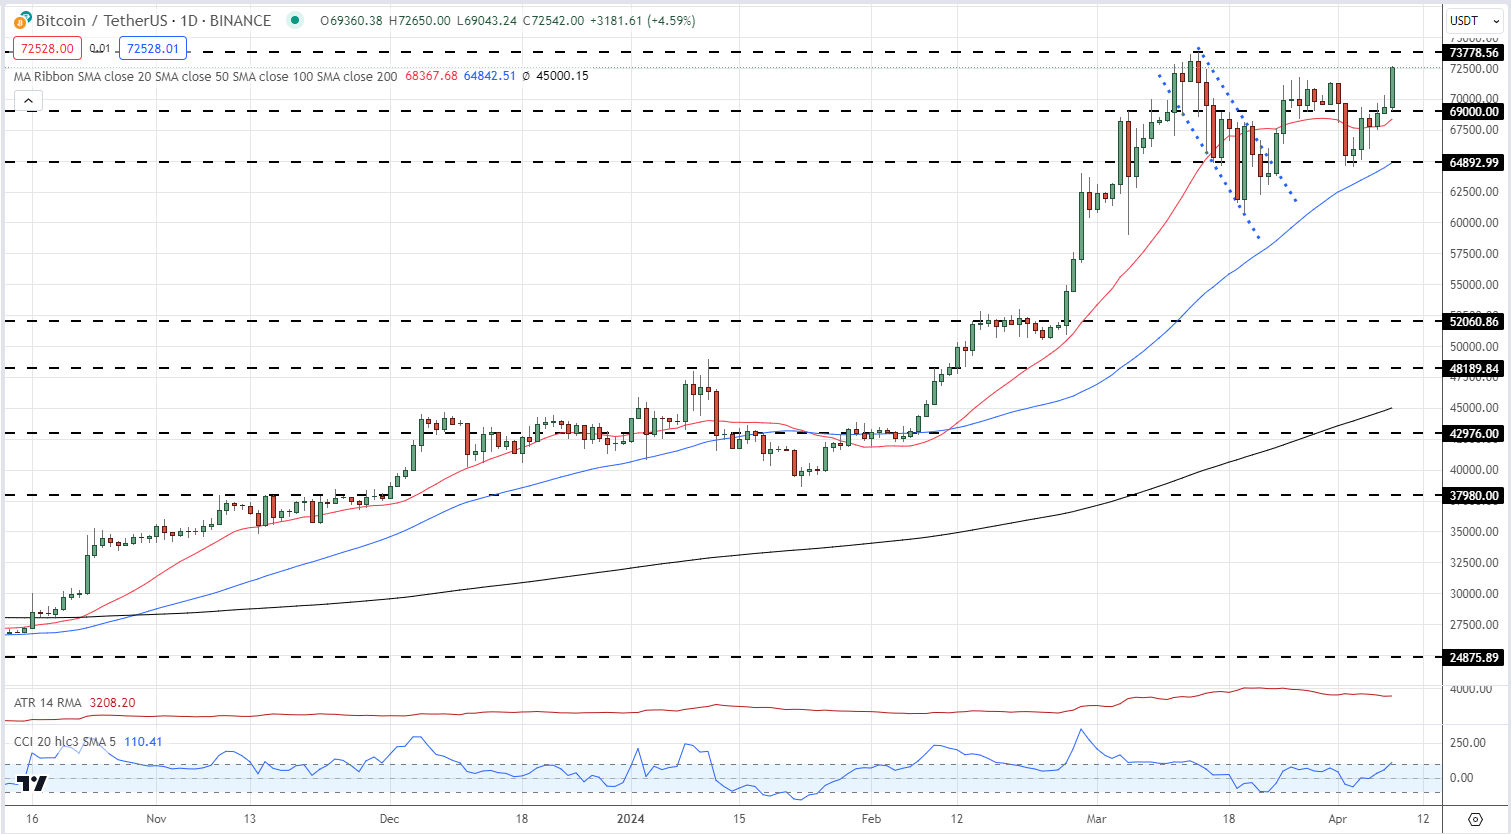
Bitcoin is back above $70k and is within touching distance of posting a new all-time high as buyers become increasingly active ahead of the upcoming halving event. The recent, short-term, sell-off has now been fully retraced with today’s move taking Bitcoin back above a cluster of recent highs between $71.2k and $71.8k. There is little in the way of technical resistance before BTC/USD enters unchartered territory.
The driver of Bitcoin’s robust rally over the last few months has been heavy institutional buying after eleven spot Bitcoin ETFs were approved in early January. In the first quarter of 2024, these eleven ETFs bought a net $12.1 billion worth of Bitcoin - $26.8 billion inflows vs. $14.7 billion outflows.
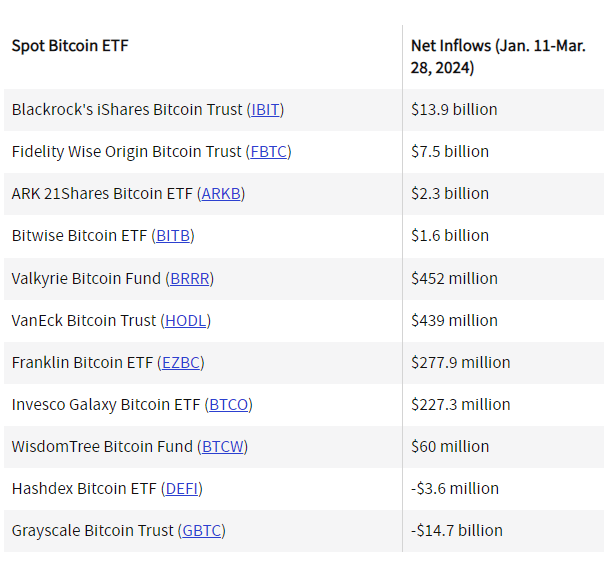
Investopedia/BitMEX Research
This heavy demand will soon run into a supply shock as the number of new Bitcoins mined will be reduced by 50% at the new halving event. These halving events occur every four years when the reward for mining a new block gets reduced from 6.25 BTC to 3.125 BTC per block. Bitcoin halving will continue every 210,000 blocks until all 21 million coins have been mined, predicted in 2040.
Via IG.Com
BITCOIN (BTC) DAILY PRICE CHART
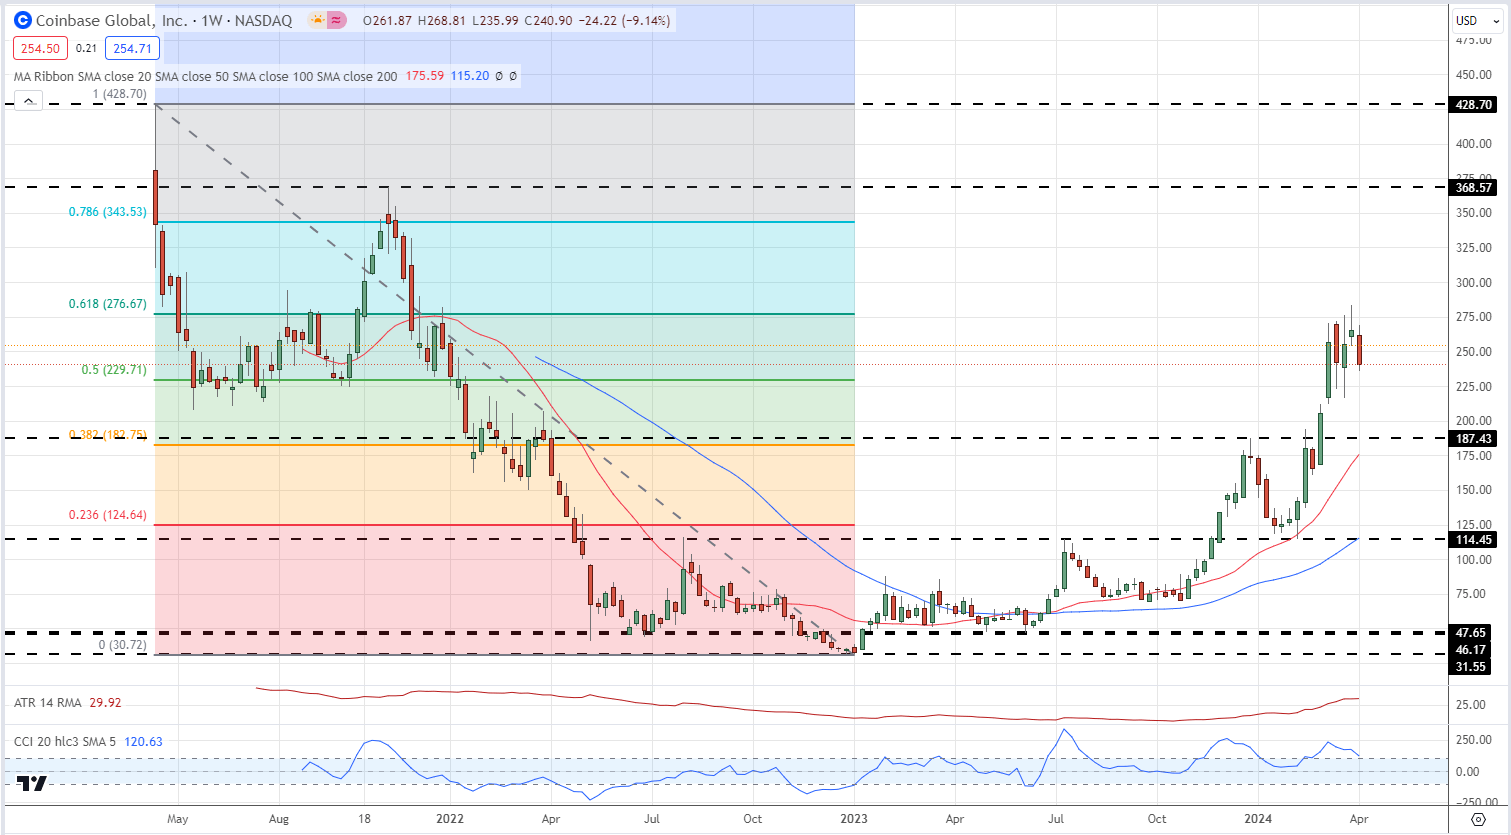
Coinbase (COIN), the largest cryptocurrency exchange in the US, is one company that benefits from renewed activity in the cryptocurrency space. Despite being involved in an ongoing lawsuit with the US Securities and Exchange Commission (SEC), Coinbase has seen its share price more than double since early February. The weekly chart shows Coinbase tested and rejected the 61.8% Fibonacci retracement level at $277 in late March and this level could soon come under pressure again unless the SEC case stymies further progress. Above here the 78.6% retracement level at $344 comes into view.
COINBASE (COIN) WEEKLY PRICE CHART
All Charts via TradingView
What is your view on Bitcoin or Coinbase – bullish or bearish?
Apr 8, 2024 2:30 PM +02:00 DailyFX
Nick Cawley,
Senior Strategist -
While markets continue to expect US rate cuts this year, it does look like the case for easing policy is becoming weaker.
 Source: Bloomberg
Stronger data weakens case for US rate ctus
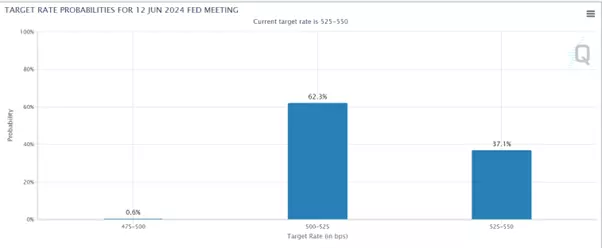
While June is still viewed as a likely point for the Federal Reserve (Fed) to cut rates by 25 basis points (62.1% chance according to the CME FedWatch tool, as of April 3rd), the arguments for continuing to hold rates unchanged remain strong.
 Source: CME website
The US Personal Consumption Expenditures (PCE) price index, the inflation measure targeted by the Fed, showed an acceleration in recent months after appearing stable late last year. The headline PCE rose 0.3% month-over-month in February, while the core PCE (excluding food and energy) rose 0.3% as well, suggesting annual inflation could move above 4% if repeated.
Fed Chair Jerome Powell downplayed the increase, calling it "along the lines of what we would like to see" and saying the Fed won't overreact, but the bond market sold off in response. Economic data like the S&P Purchasing Managers' Index pointed to strengthening demand and pricing power, contradicting narratives of slowing growth that would justify rate cuts.
The Atlanta Fed revised up its gross domestic product (GDP) growth estimate for first quarter (Q1) 2024 to 2.8%, further distancing the prospects of near-term rate cuts.
Market expectations have shifted, now pricing in the Fed's terminal rate settling around 3.6% by 2027, much higher than the Fed's 2.6% longer-run projection.
The combination of firming inflation and economic resilience makes imminent rate cuts less likely and creates challenges, especially for regions like the eurozone which must contend with weaker economic growth than that seen in the US.
What does this mean for markets?
If the Fed does swerve a rate cut in June, it may be a cause for disappointment for equity markets. A commonly-held view is that the rally from November has been built on hopes of a Fed rate cut, and not much else. This is wrong – the improvement in earnings and the solidity of US economic data has been the real driver here.
But stocks do remain vulnerable to a short-term sell-off. US indices (and several European ones) have had an astonishingly quiet few months. As an example, the S&P 500 hasn’t had a 2% drop since October. Pullbacks happen, and investors need to remember that markets go up AND down, not up OR down.
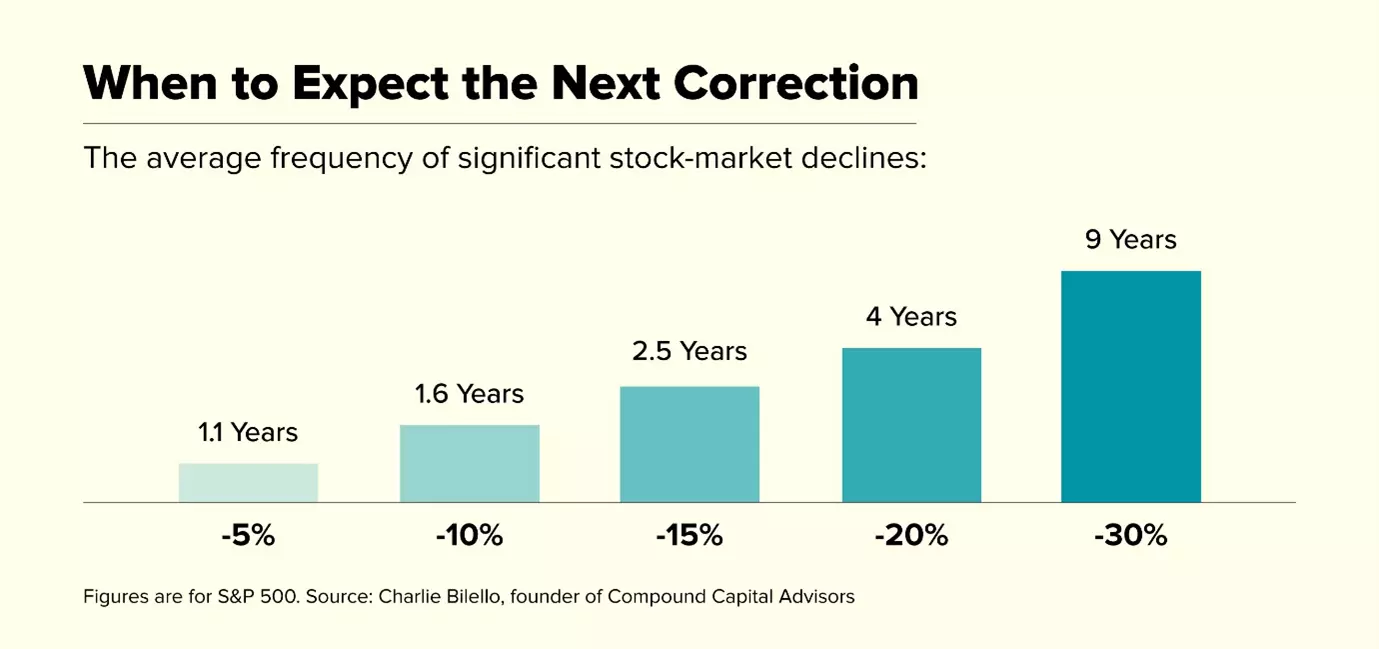 Source: Compound Capital Advisors
A short-term period of weakness in stocks could deliver the kind of dip many are waiting for. It would certainly be ‘healthy’ – markets should correct from time to time.
It would not be surprising to see the VIX and dollar both rise in the aftermath of a ‘hold’ from the Fed, particularly if the commentary around the decision refers to fears of resurgent inflation.
A ‘hold’ in June would not be likely to cause a major market decline – for that we’d need the Fed to declare it was moving to raise rates again, but there could be a decent wobble in stocks if the Fed continues to step away from the idea of rate cuts in 2024. If history is any guide we should continue to see global stock markets make headway, so long as earnings remain supportive.
This information has been prepared by IG, a trading name of IG Markets Limited. In addition to the disclaimer below, the material on this page does not contain a record of our trading prices, or an offer of, or solicitation for, a transaction in any financial instrument. IG accepts no responsibility for any use that may be made of these comments and for any consequences that result. No representation or warranty is given as to the accuracy or completeness of this information. Consequently any person acting on it does so entirely at their own risk. Any research provided does not have regard to the specific investment objectives, financial situation and needs of any specific person who may receive it. It has not been prepared in accordance with legal requirements designed to promote the independence of investment research and as such is considered to be a marketing communication. Although we are not specifically constrained from dealing ahead of our recommendations we do not seek to take advantage of them before they are provided to our clients. See full non-independent research disclaimer and quarterly summary.
-
Asian shares rose overnight, with the Nikkei gaining 1.6%, as the Japanese yen weakened against major currencies. The yen's decline is seen as safe by investors, given the threat of intervention capping the dollar's rise versus the yen at 152. Currencies like the Canadian dollar hit 16-year highs against the yen, aided by higher oil prices. Commodities like copper and gold also rallied, with copper reaching a 13-month peak, potentially boosted by China's measures to promote auto sales and EV purchases. Gold topped $2,300 an ounce, attracting momentum buyers concerned about rising government debt levels. The oil price rise could exacerbate inflation pressures for central banks. OPEC+ maintained its output cuts, while Fed Chair Powell reiterated rate cuts are coming if data allows. However, Fed officials giving speeches on Thursday may differ on the rate outlook. Market pricing suggests a June start to Fed cuts is expected, though the anticipated pace and depth of cuts has moderated. Treasury yield rises hint at a higher neutral rate perception. Upcoming US data on jobless claims today and nonfarm payrolls tomorrow will be closely watched.

-
The Japanese yen remains near its 34-year low of around 151.95 per US dollar hit last week, despite repeated warnings from Tokyo about the yen's slide. The Japanese finance minister reiterated warnings to yen bears on Tuesday as Japan tries to prevent a destabilizing currency fall. While initially shocked by stronger-than-expected US manufacturing data raising doubts about Fed rate cut timing, markets seem to be taking evidence of economic strength in their stride. Investors remain wary of a higher-for-longer rates narrative, but most analysts think the Fed is more concerned with easing inflation and the labour market. European stock markets are set for a higher open after holidays, with the STOXX 600 index closing at a record last week. Investors will watch European manufacturing and inflation data to assess the economy's health and the ECB's likely rate path. A growing number of ECB policymakers support rate cuts, with June seen as the most likely timing according to economists polled by Reuters.
-
13 hours ago, Captainsaudi said:
So much anticipation toward the fourth Bitcoin halving event expected to take place next month.
-
Australian shares hit new record highs as weaker-than-expected domestic inflation brought forward rate cut expectations while those in China and Hong Kong also advanced. In Europe and the U.S. stock indices also rallied with the DAX 40 and S&P 500 hitting new record highs despite hawkish comments by Fed member Waller who stated that the central bank is in "no rush" to cut rates. The U.S. dollar appreciated slightly with all eyes now on tomorrow's US PCE data release, the Fed's preferred inflation gauge, and Fed Chair Jerome Powell's speech at 7.30pm on Friday which may provide volatility in thinly traded markets due to the Easter break.
-
-
18 hours ago, Abizee said:
Title: Understanding Bitcoin's Halving: The Four-Year Event That Excites Crypto Fans

Thanks for sharing @Abizee


Dogecoin Crypto Price News Today Elliott Wave Technical Analysis
in Cryptocurrency and Blockchain
Posted