Jump to content

MongiIG

Administrators
  • Posts

    9,858
  • Joined

  • Last visited

  • Days Won

    41

Posts posted by MongiIG

  1. 1 hour ago, JustinCamm said:

    Dax

    Hi @JustinCamm

    Thanks for sharing

    Below from our analysts:

    DAX 40 once again trades at record highs

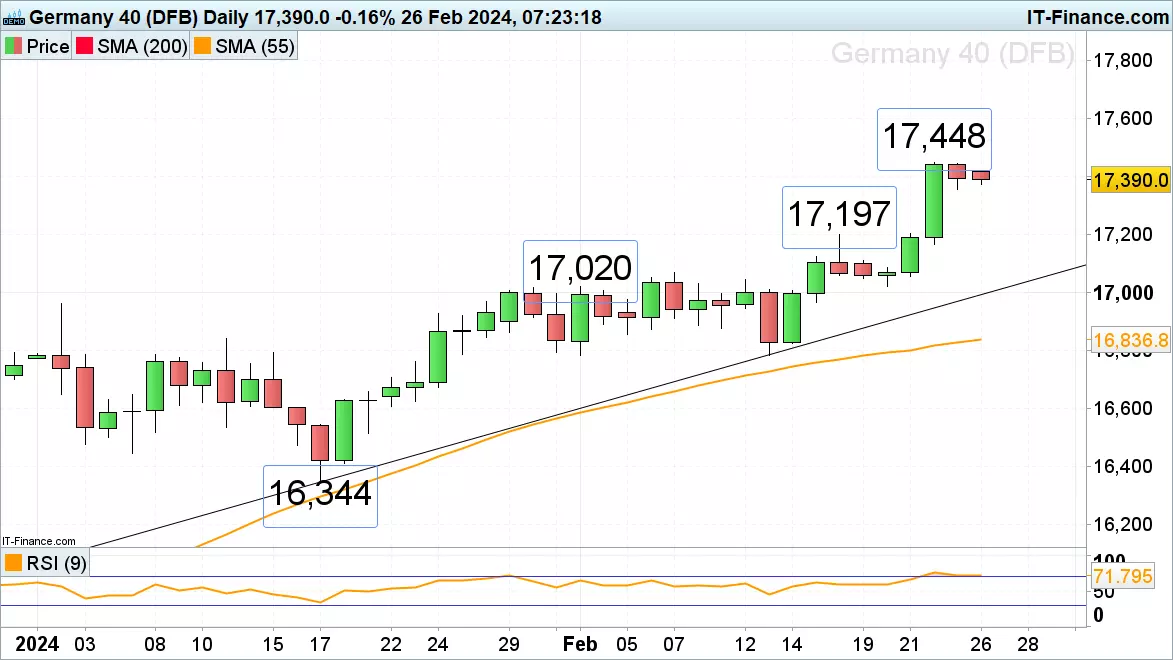
    The DAX 40 index seems to be unstoppable as it rallies to yet another record high around the 17,600 mark as the latest earnings season highlighted that European stocks remain undervalued compared to their American counterparts with regards to Price-to-Earnings (PE) ratios. This has attracted further investment in Europe’s largest economy as Germany’s consumer morale also improves slightly.

    Minor support is seen along the accelerated uptrend line at 17,464. Above the current record high at 17,607 lies the 18,000 region.

    DAX 40 DAILY CHART

    28022024DAX-Daily.png


    FTSE 100 and S&P 500 Consolidate while DAX 40 Trades in New Record Highs
    Feb 28, 2024 1:00 PM +02:00

    Axel Rudolph,
    IG Senior Market Analyst

  2. An uneasy calm has settled over global markets as traders wait for new inflation data later this week, which will provide clues about the interest rate outlooks in the U.S. and Europe. While Asian markets were subdued overall, there were some bright spots. New Zealand's central bank signaled a slightly less aggressive stance on rate hikes, sparking a rally in bonds and a dip in the Kiwi dollar. South Korean shares continued their relentless February rally, lifted by AI enthusiasm and moves to boost shareholder returns. The main events this week will be the U.S. inflation report on Thursday and the eurozone numbers on Friday, which are expected to drive market direction in the coming days. For now, caution prevails, with European and U.S. futures pointing to a muted open.


    image.png

  3. It’s one of the most popular traded markets on our end, and we take a look at the S&P 500’s technical overview in both weekly and daily time frames, the strategies to deploy for conformist, contrarian and ‘hold’ camps.


    Written by: Monte Safieddine | Market analyst, Dubai
     
    Publication date: 

    Dive into the conflicting sentiments of IG clients versus COT speculators and stay ahead of the game with upcoming market events. Don't miss out on this essential guide to understanding the current state of the S&P 500 and preparing for what lies ahead!


    This information has been prepared by IG, a trading name of IG Australia Pty Ltd. In addition to the disclaimer below, the material on this page does not contain a record of our trading prices, or an offer of, or solicitation for, a transaction in any financial instrument. IG accepts no responsibility for any use that may be made of these comments and for any consequences that result. No representation or warranty is given as to the accuracy or completeness of this information. Consequently any person acting on it does so entirely at their own risk. Any research provided does not have regard to the specific investment objectives, financial situation and needs of any specific person who may receive it. It has not been prepared in accordance with legal requirements designed to promote the independence of investment research and as such is considered to be a marketing communication. Although we are not specifically constrained from dealing ahead of our recommendations we do not seek to take advantage of them before they are provided to our clients.


  4. WTI recovers on supply worries, cotton price nears 1 1/2 year high as Arabica coffee price falls

    While oil and cotton price rise, Arabica coffee prices fall ahead of this week’s US GDP estimate and inflation data releases.

    original-size.webpSource: Bloomberg
    Written by: Axel Rudolph FSTA | Senior Financial Analyst, London
     
    Publication date: 

    WTI recovers from Monday’s low

    Front month WTI futures are recovering from Monday’s 75.77 low amid ongoing shipping disruptions and repeated breakdowns in talks for a Gaza cease fire that raise supply worries. The 200-day simple moving average (SMA) at 77.68 is being retested, a rise above which would have the November-to-February resistance line and last week’s high at 78.80 to 78.84 in its sights. Minor support sits at the 21 February 76.31 low ahead of Monday’s 75.77 low.

    original-size.webpSource: ProRealTime

    Cotton price rises to near 1 ½ year high

    Front month cotton futures have resumed their ascent to their 96.38 near one-and-a-half-year high above which sits the psychological 100.00 mark. Immediate upside pressure should be maintained while Monday’s low at 92.50 underpins. Below it lies last week’s low at 90.89. Only a currently unexpected bearish reversal and fall through that low would indicate a topping formation. As long as it holds, the medium-term bullish trend will stay firmly entrenched.

    original-size.webpSource: ProRealTime

    Arabica coffee futures prices slip through uptrend line

    Front month Arabica coffee futures topped out at their 194.06 to 194.32 late January and early February highs and are now trading in near six-week lows, having last week fallen through their October-to-February uptrend line. The 8 January low at 178.56 is now in sight, a drop trough which would engage the 174.03 January trough. Minor resistance sits at last week’s 182.39 low and can also be seen along the breached uptrend line at 185.45. Further up meanders the 55-day simple moving average (SMA) at 186.63.

    original-size.webpSource: ProRealTime

  5. Global stocks have hit record highs recently but turned sideways this week as investors await important inflation data that could impact interest rate policy. Key economic data out later today includes French and German consumer confidence, Eurozone money supply, and US durable goods, consumer confidence, and home prices. Japanese inflation rose 2% year-over-year in January, exceeding expectations and supporting potential rate hikes in Japan this year. Japanese stocks hit a record high but then retreated to flat. US core price data on Thursday is the main event for the week, after a headline CPI reading that was stronger than expected earlier in February. On the calendar for today are US durable goods orders and consumer confidence. 


    image.png

  6. Gold price and silver price look for gains but Brent crude price under fresh pressure

    While precious metals have seen some renewed upside, oil prices have taken a hit in early trading.

    original-size.webpSource: Bloomberg
    Written by: Chris Beauchamp | Chief Market Analyst, London
     
    Publication date: 

    Gold back at trendline resistance

    The price rallied over the past two weeks, and has now returned to trendline resistance from the December record high. A close above $2040 would help to suggest a break of trendline resistance, which then opens the way to the early February high around $2064, with horizontal resistance at $2060 just before this. A close back below $2030 would begin to suggest a new lower high has been created and that a push back to the February low at $1984 could now begin.

    original-size.webpSource: ProRealTime

    Brent crude heads lower

    Oil prices fell sharply on Friday, and the new week has begun with fresh losses. Mid-February saw Brent’s rally falter around $83, and this topping out appears now to have given way to a turn lower. The price has broken below trendline support from the December low, though this also happened earlier in February and was followed up by a recovery. Further declines would take the price to the 50-day simple moving average (SMA), and then beyond this lies February’s low around $77. Bulls will need a close back above $81.50 to indicate that trendline support has been recovered.

    original-size.webpSource: ProRealTime

    Silver losses halted

    The selling in silver was stemmed on Friday, as the price rebounded after a tough week. The price is pushing higher off its overnight lows, with short-term gains above $23.20 helping to support a cautiously bullish view. The next target becomes the mid-February high at $23.50. A close above this could mark the end of the consolidation in silver that has been ongoing since the beginning of the year. Alternately, a close back below $22.50 would open the way to the 2024 lows at $22.

    original-size.webpSource: ProRealTime
  7. CAC 40, DAX 40 and Dow trade in record highs but may short-term consolidate

    Outlook on Nikkei 225, FTSE 100 and DAX 40 ahead of this week’s German and US inflation reports.

    original-size.webpSource: Bloomberg
    Written by: Axel Rudolph FSTA | Senior Financial Analyst, London
     
    Publication date: 

    The Nikkei 225 consolidates below last week’s record high

    Last week’s swift ascent in the Nikkei 225 has taken it to a new record high, above that seen 34 years ago, with the psychological 40,000 mark remaining in focus. Increased foreign investment and signs of sustained profit growth among Japanese companies could lead to the 40,000 level being reached as there remains potential for significant additional foreign funds to enter Japan's stock market. However, risks such as China's economic fluctuations, potential yen strengthening, and changes in the Bank of Japan's policy could impact the index's upward trajectory. On Monday a minor retracement lower is taking the Nikkei 225 back towards its 1989 previous record high at 38,957. Below it the mid-February high and the February uptrend line at 38,876 to 38,860 should offer support. While last week’s low at 38,104 underpins, the medium-term bullish uptrend remains intact.

    original-size.webpSource: ProRealTime

    FTSE 100 awaits MPC member speeches

    The FTSE 100’s recovery from last week’s 7,623 low amid strong earnings by the likes of Anglo American and Rolls-Royce and has so far taken it to 7,717 on Friday, a level from which it is currently slipping back. It’ll need to be exceeded for last Tuesday’s 7,750 six-week high to be back in focus. Further up lurks the 7,769 December peak. Minor support below Monday’s 7,689 low sits at Friday’s 7,675 low ahead of the 55-day simple moving average (SMA) and Wednesday’s low at 7,634 to 7,623.

    original-size.webpSource: ProRealTime

    DAX 40 stalls slightly below Thursday’s record high

    The DAX 40 index’s swift rally to a new record high close to the 17,500 mark on Thursday is taking a breather as investors look forward to German inflation data out on Thursday. Minor support below Friday’s 17,356 low is only seen around the mid-February 17,197 high. Above the current record high at 17,448 lies the 18,000 region.

    original-size.webpSource: ProRealTime
  8. Technical overview remains bullish after a week of notable gains, and CoT speculators have reduced their majority buy bias.


    original-size.webpSource: Bloomberg


    Written by: Monte Safieddine | Market analyst, Dubai
     
    Publication date: 

    Record highs, cautious Fed members, and rate cut likelihoods

    Last Friday, the United States offered little new information, with market participants still processing the significant gains made by large-cap equity indices on Thursday, which reached record highs, amidst numerous central bank officials delivering speeches in the interim. The Federal Reserve's (Fed) Waller reiterated his viewpoint that "there is no rush to begin cutting interest rates to normalize monetary policy," expressing a desire for "at least another couple more months of inflation data" to decide "whether January was a speed bump or a pothole." Cook emphasized the need for "greater confidence that inflation is converging to 2% before beginning to cut the policy rate," Jefferson anticipated rate cuts later in the year, and Harker cautioned against expecting rate cuts "right now and right away."

    Regarding Treasury yields, they ended the week mostly unchanged, with a slight decrease at the longer end, thus lowering them in real terms. Market predictions, notably the CME's FedWatch, almost fully anticipate the Fed maintaining its current rates in March, strongly suggesting no change in May, and, by a majority, forecasting a cut in June.

    Week ahead: pricing, PMIs, and a potential partial government shutdown

    In the coming week, a focus will be on US housing data, beginning with the release of new home sales for January later today, which have been near pre-pandemic averages. Tomorrow, housing price data for December from both the FHFA and S&P/CS will be released, with recent figures showing positive trends. Weekly mortgage applications, following last week's decline, will be reported on Wednesday, and pending home sales for the first month of this year will be released on Thursday, following notable growth in its previous report.

    However, these housing market indicators, whether individually or collectively, are not expected to have as significant an impact as the pricing data due this Thursday with the Personal Consumption Expenditures (PCE) price index. January's expectations include a headline year-on-year increase of 2.4%, down from 2.6% previously, with the core rate expected to decrease from 2.9% to 2.8%. Month-on-month growth rates of 0.3% and 0.4% are anticipated, respectively.

    Manufacturing PMIs (Purchasing Managers' Index) are scheduled for Friday, with both the Institute for Supply Management (ISM) and S&P Global releasing their findings. However, the former has not yet emerged from contraction, unlike the latter, which showed improvement to 51.5 in its preliminary reading last Thursday. Preliminary GDP (Gross Domestic Product) figures for the last quarter of the previous year will be released on Wednesday, although there is currently no significant concern over U.S. growth (with the Atlanta Fed's GDPNow estimate for this quarter at a healthy 2.9%).

    In terms of consumer sentiment, the Conference Board's (CB) reading will be available tomorrow, while the revised figures from the University of Michigan (UoM) will be released on Friday. We should also not overlook the deadline for the partial government shutdown this Friday.

    Dow technical analysis, overview, strategies, and levels

    We got a cross and close above its previous weekly 1st Resistance level, plenty on offer for conformist buy-breakout strategies, but for relatively limited profit-taking in terms of time, while contrarian sell-after-reversals got stopped out, with the key technical indicators remaining bullish on the weekly time frame and a 'bull average' technical overview. It's an identical overview for the daily time frame, where late last week price easily breached Thursday's 1st and 2nd levels, thereafter breaching 39K and remaining above it by the close.


    original-size.webpSource: IG

    IG client* and CoT** sentiment for the Dow

    CoT speculators’ heavy buy bias has dropped a few notches to 69% and is still considered heavy buy territory (longs -935 lots, shorts +2,668), and there’s still a decent margin for longs initiated at lower prices to unwind with a profit. IG clients are extreme sell but down a notch to 79% week-on-week, with the caution shorting into price gains persisting.


    original-size.webpSource: IG

    Dow chart with retail and institutional sentiment


    original-size.webpSource: IG

    • *The percentage of IG client accounts with positions in this market that are currently long or short. Calculated to the nearest 1%, as of the start of this week for the outer circle. Inner circle is from the start of last week.
    • **CoT sentiment taken from the CFTC’s Commitment of Traders report, outer circle is latest report released on Friday with the positions as of last Tuesday, inner circle from the report prior.


    This information has been prepared by IG, a trading name of IG Australia Pty Ltd. In addition to the disclaimer below, the material on this page does not contain a record of our trading prices, or an offer of, or solicitation for, a transaction in any financial instrument. IG accepts no responsibility for any use that may be made of these comments and for any consequences that result. No representation or warranty is given as to the accuracy or completeness of this information. Consequently any person acting on it does so entirely at their own risk. Any research provided does not have regard to the specific investment objectives, financial situation and needs of any specific person who may receive it. It has not been prepared in accordance with legal requirements designed to promote the independence of investment research and as such is considered to be a marketing communication. Although we are not specifically constrained from dealing ahead of our recommendations we do not seek to take advantage of them before they are provided to our clients.

  9. AUD/USD marks three weeks of gains as it eyes RBA's stance and key CPI data, navigating seller resistance.


    original-size.webpSource: Bloomberg


    Written by: Tony Sycamore | Market Analyst, Australia
     
    Publication date: 

    The AUD/USD has notched up three consecutive weeks of gains, but this upward trend comes with a twist. Every time the pair ventured above the .6562 mark, aligning with the 200-day moving average, sellers swiftly emerged.

    The trajectory of the AUD/USD's future gains hinges on a trio of factors: 1. sustained positive risk sentiment, 2. the RBA's unwavering hawkish stance, and 3. a fresh impetus for the US dollar's climb, which has been on the sidelines lately despite a recalibration of expectations for Fed rate cuts in the US rates market.

    This week's Australian inflation update, the January Monthly CPI indicator, is set to play a pivotal role in clarifying the RBA's position.

    What's on the radar for this week's Monthly CPI indicator (Wednesday, February 28th at 11:30am):

    The latest data, unveiled in late January, indicates a cooling in Australia's inflation both quarterly and monthly. A quick recap reveals:

    • The headline inflation edged up by 0.6% in Q4, charting an annual pace of 4.1% YoY, undershooting the 4.3% forecast.
    • The RBA's preferred inflation gauge, the trimmed mean, ascended by 0.8% QoQ, bringing the annual Trimmed Mean down to 4.2% YoY from Q3's 5.2%.
    • December's Monthly CPI indicator showed a year-on-year increase of 3.4%, slightly below the 3.7% anticipated.
    • Excluding volatile items, December's Monthly CPI indicator advanced by 4.2%, decelerating from November's 4.8%.


    For January, expectations are set for the Monthly CPI to tick up to 3.5% YoY, mainly attributed to base effects. Despite this, the anticipated easing in inflation and a slackening labour market could pave the way for the RBA to shed its tightening bias in the months ahead. This shift is anticipated to precede a sequence of rate reductions, starting with a 25 basis points (bp) cut in August followed by another in November

    Monthly CPI indicator chart


    original-size.webpSource: RBA

    AUD/USD technical analysis

    In recent weeks, the AUD/USD has stabilised and reclaimed some ground it lost during its sell-down from the December .6871 high.

    The AUD/USD now needs to see a sustained move above the 200-day moving average at .6562 and above the mid-January .6625 high to warn that a more robust recovery is underway.

    Aware that the longer it spends lingering under the 200-day moving average, the more chance there is of a retest of the mid-February .6442 low with scope towards weekly support near .6310.

    AUD/USD daily Chart


    original-size.webpSource: TradingView

    • Source:TradingView. The figures stated are as of 26 February 2024. Past performance is not a reliable indicator of future performance. This report does not contain and is not to be taken as containing any financial product advice or financial product recommendation.


    This information has been prepared by IG, a trading name of IG Australia Pty Ltd. In addition to the disclaimer below, the material on this page does not contain a record of our trading prices, or an offer of, or solicitation for, a transaction in any financial instrument. IG accepts no responsibility for any use that may be made of these comments and for any consequences that result. No representation or warranty is given as to the accuracy or completeness of this information. Consequently any person acting on it does so entirely at their own risk. Any research provided does not have regard to the specific investment objectives, financial situation and needs of any specific person who may receive it. It has not been prepared in accordance with legal requirements designed to promote the independence of investment research and as such is considered to be a marketing communication. Although we are not specifically constrained from dealing ahead of our recommendations we do not seek to take advantage of them before they are provided to our clients.

  10. Upcoming PCE data could sway the US dollar. Explore its impact on EUR/USD, USD/JPY, and GBP/USD through our technical analysis.


    original-size.webpSource: Bloomberg


    Written by: Diego Colman | Market Analyst, New York
     
    Publication date: 

    Wall Street will be on edge this week ahead of a high-impact event on the US calendar on Friday: the release of core PCE data, the Fed’s preferred inflation indicator. This report is likely to amplify volatility and may alter sentiment, so traders should prepare for the possibility of wild price swings in order to better respond to sudden changes in market conditions.

    January's core PCE is forecast to have increased by 0.4% compared to the previous month, resulting in a slight decline in the yearly reading from 2.9% to 2.7% - a minor yet encouraging directional adjustment. However, traders should not be caught off guard if official results surprise to the upside, mirroring the trends and patterns seen in the CPI and PPI surveys a couple of weeks ago.

    Rate hike expectations and the dollar's 2024 rebound: navigating the shift in monetary policy

    Sticky price pressures, coupled with robust job growth and reaccelerating wages, may prompt the FOMC to delay the start of its easing cycle until the second half of the year, and to deliver fewer cuts than anticipated. This scenario could shift interest rate expectations towards a more hawkish direction compared to their present outlook.

    Higher interest rates for longer may keep US Treasury yields tilted upwards in the near term, establishing a fertile ground for the US dollar to build upon its 2024 recovery. With the greenback displaying a constructive bias, the euro, pound and, to a lesser extent, the Japanese yen may encounter challenges transitioning into March.

    EUR/USD technical analysis

    EUR/USD rebounded this past week, but failed to decisively recapture its 200-day simple moving average at 1.0825. It's imperative to closely track this indicator in the coming days, as a push above it may trigger a rally towards 1.0890. On further strength, attention will turn to 1.0950.

    Alternatively, if the pair gets rejected downwards from its current position and heads lower, technical support fist appears at 1.0725, followed by 1.0700. Beyond this threshold, additional weakness could prompt a retracement towards 1.0650.

    GBP/USD technical analysis

    GBP/USD advanced during the week but failed to take out its 50-day simple moving average at 1.2680. Surpassing this technical obstacle could be a tough task for bulls, though a breakout might usher in a move towards trendline resistance at 1.2725. Above this barrier, all eyes will be on 1.2830.

    In the scenario of sellers reasserting control and kickstarting a pullback, the first potential support area arises around the 1.2600 handle. Further losses past this juncture could pave the way for a decline towards trendline support and the 200-day simple moving average, located at 1.2570.

    USD/JPY technical analysis

    USD/JPY made further progress to the upside this week, coming within striking distance from breaching resistance at 150.85. Traders need to monitor this technical barrier carefully, as a successful breakout could energize buying momentum, potentially fueling a rally towards last year’s highs near 152.00.

    On the flip side, if sellers unexpectedly reclaim dominance and spark a bearish reversal, the first technical floor to watch lies at 149.70 and 148.90 subsequently. Sustained losses beyond these key support levels could trigger a retreat towards the 100-day simple moving average in the vicinity of 147.50.


    This information has been prepared by IG, a trading name of IG Australia Pty Ltd. In addition to the disclaimer below, the material on this page does not contain a record of our trading prices, or an offer of, or solicitation for, a transaction in any financial instrument. IG accepts no responsibility for any use that may be made of these comments and for any consequences that result. No representation or warranty is given as to the accuracy or completeness of this information. Consequently any person acting on it does so entirely at their own risk. Any research provided does not have regard to the specific investment objectives, financial situation and needs of any specific person who may receive it. It has not been prepared in accordance with legal requirements designed to promote the independence of investment research and as such is considered to be a marketing communication. Although we are not specifically constrained from dealing ahead of our recommendations we do not seek to take advantage of them before they are provided to our clients.

  11. Asian-Pacific stocks traded mostly flat to start the week, with light weekend newsflow focused on geopolitics. In Europe, equity futures point to a lower open after gains on Friday. The calendar this week focuses on inflation , with Japan kicking off the world tour of price data today. This is followed up by US PCE data on Wednesday, German CPI on Thursday and then the eurozone reading on Friday. While today begins quietly on the earnings front, UK earnings crowd the rest of the week, taking over from the US as reporting season there enters its final weeks. 


    image.png

  12. Prepare for market shifts with the upcoming US core PCE data release. Understand its effects on FX markets, the US dollar, and major pairs through our in-depth analysis of EUR/USD, GBP/USD, and gold.


    original-size.webpSource: Bloomberg


    Written by: Diego Colman | Market Analyst, New York
     
    Publication date: 

    Market participants will be on tenterhooks in the coming days ahead of a high-impact item on the US calendar next week: the release of core PCE data – the Fed’s favourite inflation gauge. This crucial event on the agenda is likely to stir volatility within the FX space, so the retail crowd needs to be vigilant and ready for unpredictable price swings.

    In terms of consensus estimates, core PCE is projected to have risen by 0.4% in January, bringing the annual rate down to 2.7% from 2.9% previously, a small but welcome step in the right direction. Traders, however, shouldn't be taken aback if the numbers surprise to the upside, echoing the patterns and trends seen in last week's CPI and PPI reports for the same period.

    Interest rates and inflation: steering the course of the US dollar and commodities

    Sticky price pressures in the economy, together with solid job creation and hot wage growth, could compel the Fed to delay the start of its easing cycle to the second half of the year, resulting in only modest adjustments once the process gets underway. Such a scenario could push interest rate expectations in a more hawkish direction compared to their current status.

    Higher interest rates for longer could mean upward pressure on US Treasury yields over the coming weeks – an outcome poised to benefit the US dollar and reinforce its bullish momentum seen in 2024. With the greenback biased to the upside, pairs such as EUR/USD and GBP/USD will face difficulties in maintaining positive performance in the short term. Gold prices could also struggle.

    Fundamentals aside now, the subsequent section of this article will revolve around examining the technical outlook for EUR/USD, GBP/USD, and gold prices. Here, we'll explore critical price thresholds that traders need to keep on their radar to prepare potential strategies in the upcoming sessions.

    EUR/USD technical analysis

    EUR/USD has regained lost ground this week but has yet to fully recover its 200-day simple moving average, currently at 1.0830. Traders should keep a close eye on this indicator in the coming days, bearing in mind that a push above it could give way to a rally towards 1.0890 and possibly even 1.0950.

    On the flip side, if prices get rejected to the downside from current levels and begin a rapid descent, technical support emerges at 1.0725. followed by 1.0700. From this point onwards, additional weakness may prompt market focus to shift towards 1.0650.

    EUR/USD daily chart


    original-size.webpSource: TradingView

    GBP/USD technical analysis

    GBP/USD consolidated to the upside on Thursday but fell short of clearing its 50-day simple moving average at 1.2680. Bulls may find it challenging to surpass this technical hurdle; however, a breakout could result in a move toward trendline resistance at 1.2725.

    Conversely, if sellers stage a comeback and trigger a market reversal, the first line of defense against a bearish attack lies around the 1.2600 mark. Additional losses beyond this point may create the right conditions for a slide toward trendline support and the 200-day simple moving average at 1.2560.

    GBP/USD daily chart


    original-size.webpSource: TradingView

    Gold price technical analysis

    Gold rose modestly on Thursday but hit a roadblock around $2,030, a key resistance zone where a downtrend line aligns with the 50-day simple moving average. Sellers need to defend this area vigorously to prevent bulls from reasserting dominance; failure to do so could result in a rally toward $2,065.

    On the other hand, if sentiment reverses in favor of sellers and prices begin to retreat, support can be identified at $2,005, positioned near the 100-day simple moving average. Further downside pressure may then bring $1,990 into focus, followed by $1,995.

    Gold (XAU/USD) daily chart


    original-size.webpSource: TradingView


    This information has been prepared by IG, a trading name of IG Australia Pty Ltd. In addition to the disclaimer below, the material on this page does not contain a record of our trading prices, or an offer of, or solicitation for, a transaction in any financial instrument. IG accepts no responsibility for any use that may be made of these comments and for any consequences that result. No representation or warranty is given as to the accuracy or completeness of this information. Consequently any person acting on it does so entirely at their own risk. Any research provided does not have regard to the specific investment objectives, financial situation and needs of any specific person who may receive it. It has not been prepared in accordance with legal requirements designed to promote the independence of investment research and as such is considered to be a marketing communication. Although we are not specifically constrained from dealing ahead of our recommendations we do not seek to take advantage of them before they are provided to our clients.

  13. Explore the potential rebound of the Japanese yen in 2024 as the Bank of Japan (BoJ) considers rate hikes. Analysing the yen against USD, EUR, and GBP, we uncover the implications of BoJ's policy changes.


    original-size.webpSource: Bloomberg


    Written by: Diego Colman | Market Analyst, New York
     
    Publication date: 

    The Japanese yen has weakened significantly against its top peers in 2024, owing to the Bank of Japan's (BoJ) dovish stance. While major central banks globally have aggressively raised rates over the past two years to combat inflation, the BoJ has remained steadfast, maintaining highly accommodative policy settings.

    However, the era of significantly relaxed monetary policy in Japan may be nearing an end, potentially as early as the early months of the second quarter. This shift could mark the beginning of a sustained upswing for the yen, suggesting the worst may be behind us.

    Wage negotiations spark hope: a turning point for Japan's monetary policy

    If annual compensation negotiations between major Japanese firms and unions, expected to conclude around mid-March, result in substantial pay increases above 4.0%, policymakers might gain the confidence needed in the sustainability of wage growth to finally move away from negative interest rates.

    We will learn more about the BoJ's monetary policy outlook in the coming weeks, but the indicators seem to be aligning for a rate hike in late March or, more likely, April. As markets begin to anticipate this scenario, the yen may gradually start to rally.

    USD/JPY technical analysis

    USD/JPY climbed on Thursday, approaching resistance at 150.85. If gains pick up pace in the coming days and break above the 151.00 handle, buyers may get emboldened to initiate a bullish assault on last year’s high near 152.00.

    On the flip side, if sellers return and drive the exchange rate lower, technical support appears around 149.70, followed by 148.90. Further losses from this point onward may usher in a pullback towards 147.50 in the near term.

    USD/JPY daily chart


    original-size.webpSource: TradingView

    EUR/JPY technical analysis

    EUR/JPY extended its advance on Thursday, steadily approaching last year’s peak around the 164.00 handle. Bears need to strongly defend this ceiling; failure to do so might lead to an upward push toward trendline resistance at 165.00.

    In case of a bearish reversal, support is anticipated at 161.50 and 160.70 thereafter. On further weakness, all eyes will be on the 100-day simple moving average located near 159.60. Below this level, the 50-day simple moving average could act as the next shield against additional losses.

    EUR/JPY daily chart


    original-size.webpSource: TradingView

    GBP/JPY technical analysis

    GBP/JPY rallied on Thursday, hitting a fresh multi-year high above 190.50. With bullish momentum intact, additional upside potential is likely in the short term, with the next resistance threshold at 192.50, followed by 196.00, marking the highs of 2015.

    Conversely, should the upward momentum wane, resulting in a market retracement, support is seen around the psychological 190.00 level, and subsequently at 188.50. Further down, bears are likely to set their sights on the 50-day simple moving average in the vicinity of 185.50.

    GBP/JPY daily chart


    original-size.webpSource: TradingView


    This information has been prepared by IG, a trading name of IG Australia Pty Ltd. In addition to the disclaimer below, the material on this page does not contain a record of our trading prices, or an offer of, or solicitation for, a transaction in any financial instrument. IG accepts no responsibility for any use that may be made of these comments and for any consequences that result. No representation or warranty is given as to the accuracy or completeness of this information. Consequently any person acting on it does so entirely at their own risk. Any research provided does not have regard to the specific investment objectives, financial situation and needs of any specific person who may receive it. It has not been prepared in accordance with legal requirements designed to promote the independence of investment research and as such is considered to be a marketing communication. Although we are not specifically constrained from dealing ahead of our recommendations we do not seek to take advantage of them before they are provided to our clients.

  14. The Nikkei 225, several US and european equity indices are trading in new record highs following Nvidia's better-than-expected earnings amid global risk on sentiment. China's new home prices dropping the most in ten months and UK consumer confidence weakening in February have done little to dampen the buoyant mood but perhaps the German IFO business climate index may do so, at least in the short-term. The US dollar paused its recent spell of depreciation as US yields rallied to a near three-month high, initial jobless claims in the week ending February 17 fell to a five-week low and as existing homes sales rebounded to a five-month high, reinforcing the view of a soft landing in the USA. The euro remained stable as European Central Bank officials agreed that it was too early to discuss interest rate cuts, despite indications of cooling inflationary pressures across the Eurozone, as shown in the minutes from the most recent ECB meeting. 


    image.png

  15. 4 hours ago, AhmedMarsh said:

    Hey there! I'm from Saint Louis, MO, and I'm about to get married, so I decided to start trading and make extra money. I have a few friends who work in this industry, and they showed me this IG Community – a hub for traders! Anybody would like to share some tips with a newbie? Thanks in advance!

    Hi @AhmedMarsh

    Welcome to the community and congratulations! All the best with your trading journey.

    MongiIG

  16. Tematica CIO, Chris Versace, thinks so. He tells IGTV's Angeline Ong why he thinks NVIDIA's parabolic share price trend could continue for some time.

    Written by: Angeline Ong | Financial Analyst, Presenter and Content Editor, London
     
    Publication date: 

    Versace believes this even as the chip giant’s CEO told analysts that there was no way the company can "reasonably" keep up on demand in the short term as the company ramps up production.

    (AI Video Summary)

    NVIDIA's impressive earnings results

    Chris Versace, the Chief Investment Officer (CIO) of Tematica, recently sat down with Angeline Ong to chat about the latest financial results from NVIDIA, a popular technology company. Despite some concerns about meeting high expectations, NVIDIA impressed everyone by delivering impressive results, especially in its data center business. In fact, the company even provided higher guidance than expected, which led to increased expectations for its earnings per share (EPS) and higher price targets.

    Potential challenges in meeting short-term demand

    Versace believes that NVIDIA could be valued at a whopping $950 per share based on its compound annual growth rate. However, there might be some challenges in meeting the short-term demand as the company ramps up its production. Even though competition might cause prices to decrease, there is still a strong demand for artificial intelligence (AI) from major companies and investors, which will likely continue for several quarters.

    Versace explains that AI is currently at a similar stage of development as the internet and the dot-com bubble were in the past. Billions of dollars are being invested in generative AI technology, which has significant long-term potential to disrupt various industries. There is, however, a risk of there being too much supply in the market, which could lower prices.

    NVIDIA's impact on higher treasury bond yields and rate cuts

    On a different note, the bond market has been affected by NVIDIA's impressive results, resulting in higher treasury bond yields. As a result, investors now expect interest rate cuts to begin no earlier than June. Versace mentions that the timing of these rate cuts will depend on upcoming economic data. Recently, inflation data has been moving in the wrong direction, leading to a more cautious sentiment from the Federal Reserve (Fed). If the economy remains strong and the Fed cuts rates too early, it could worsen inflation. Therefore, Versace believes that the Fed will wait for sustained data aligning with their goals before making any rate cuts.

    Looking ahead, Versace points out the key data releases for the following week, such as the final January manufacturing PMIs and the January PCE price index. These reports will provide more insight into the speed of the economy, job creation, and inflation. If the PCE index moves in the wrong direction based on previous data, it could indicate that the Fed will wait even longer to cut rates.


    This information has been prepared by IG, a trading name of IG Markets Limited. In addition to the disclaimer below, the material on this page does not contain a record of our trading prices, or an offer of, or solicitation for, a transaction in any financial instrument. IG accepts no responsibility for any use that may be made of these comments and for any consequences that result. No representation or warranty is given as to the accuracy or completeness of this information. Consequently any person acting on it does so entirely at their own risk. Any research provided does not have regard to the specific investment objectives, financial situation and needs of any specific person who may receive it. It has not been prepared in accordance with legal requirements designed to promote the independence of investment research and as such is considered to be a marketing communication. Although we are not specifically constrained from dealing ahead of our recommendations we do not seek to take advantage of them before they are provided to our clients. See full non-independent research disclaimer and quarterly summary.

  17. Wednesday's FOMC minutes confirmed that the Fed remains "highly attentive" to inflation risks with some officials warning of downside risks in overly restrictive policy but others seeing risks of inflation progress stalling. Despite 'higher for longer' rates remaining on the cards, the US dollar stays under pressure with June rate cut expectations remaining unchanged at around 54%.
    Equity indices rallied as Nvidia revenues soared in the fourth quarter as the world’s most valuable chip manufacturer benefited from a spending spree on artificial intelligence. The Nikkei 225 hit a new record high after 34 years while global stock indices advance on positive sentiment.


    image.png

  18. US dollar dynamics - anticipating FX market volatility ahead of FOMC minutes release and technical forecasts for major currency pairs.


    original-size.webpSource: Bloomberg


    Written by: Diego Colman | Market Analyst, New York
     
    Publication date: 

    The US dollar fell modestly on Tuesday on the back of subdued US yields in a session lacking significant drivers. Volatility in the FX space, however, may accelerate later in the week, courtesy of a high-impact event on the US calendar on Wednesday: the release of the FOMC minutes.

    The minutes will surely provide a greater degree of clarity regarding the central bank’s assessment of the inflation outlook, and the possible timing of the first rate cut, so traders should parse and analyse the document closely. Based on recent comments from several Fed officials, the readout of the last meeting may signal limited interest for immediate rate cuts, in response to stagnating progress on disinflation. This scenario should boost US Treasury yields, bolstering the US dollar in the process.

    In the unlikely event that the minutes demonstrate a greater inclination among policymakers to initiate the easing cycle sooner rather than later, the opposite response could materialise, i.e., a pullback in yields and the greenback. Regardless of the outcome, we could see larger FX market swings in the coming days.

    Fundamentals aside, the remainder of this article will center on the technical outlook for major US dollar pairs such as EUR/USD, GBP/USD and USD/JPY. Here we'll assess the crucial price thresholds that currency traders should be aware of in the upcoming sessions.

    EUR/USD technical analysis

    EUR/USD continued its recovery on Tuesday after rebounding from support near 1.0700 last week. If gains persist in the upcoming days, resistance is anticipated around the 200-day simple moving average at 1.0820. Beyond this threshold, all eyes will be on 1.0890, followed by 1.0950.

    In the event of a market reversal, initial support can be identified near 1.0725 and 1.0700 subsequently. Bulls will need to vigorously protect this technical floor; failure to do so could result in a pullback towards 1.0650. On further weakness, attention will be squarely on 1.0520.

    EUR/USD daily chart


    original-size.webpSource: TradingView

    USD/JPY technical analysis

    USD/JPY ticked down and fell below the 150.00 handle on Tuesday. Should weakness persist throughout the week, support emerges at 148.90, followed by 147.40. Further losses from this point onward may bring the 50-day simple moving average near 146.00 into focus.

    On the other hand, if bulls return and push prices back above the 150.00 handle, we could soon witness a retest of the 150.85 region. Although overcoming this ceiling might present a challenge for the bulls, a decisive breakout could usher in a rally toward last year’s high in the vicinity of 152.00.

    USD/JPY daily chart


    original-size.webpSource: TradingView

    USD/CAD technical analysis

    USD/CAD consolidated to the upside on Tuesday, further moving away from its 200-day simple moving average and trendline support near 1.3480. If gains gather momentum over the next few days, overhead resistance looms at 1.3545, followed by 1.3585. Above these levels, the spotlight will be on 1.3620.

    Conversely, if prices pivot to the downside and head lower, the first floor to monitor is located at 1.3480. This area might offer stability for the pair during a retracement, but in the event of a breakdown, a rapid decline towards the 50-day simple moving average at 1.3415 could be imminent.

    USD/CAD daily chart


    original-size.webpSource: TradingView


    This information has been prepared by IG, a trading name of IG Australia Pty Ltd. In addition to the disclaimer below, the material on this page does not contain a record of our trading prices, or an offer of, or solicitation for, a transaction in any financial instrument. IG accepts no responsibility for any use that may be made of these comments and for any consequences that result. No representation or warranty is given as to the accuracy or completeness of this information. Consequently any person acting on it does so entirely at their own risk. Any research provided does not have regard to the specific investment objectives, financial situation and needs of any specific person who may receive it. It has not been prepared in accordance with legal requirements designed to promote the independence of investment research and as such is considered to be a marketing communication. Although we are not specifically constrained from dealing ahead of our recommendations we do not seek to take advantage of them before they are provided to our clients.

  19. China adds further support to the ailing economy; and brent crude oil drops at prior swing low, propped up by the 200 SMA, meanwhile, WTI oil oscillates around key, long-term trend filter.


    original-size.webpSource: Bloomberg


    Written by: Richard Snow | Analyst, DailyFX, Johannesburg
     
    Publication date: 

    China adds further support to the ailing economy

    In the early hours of Tuesday morning, it was confirmed that the five-year loan prime rate dropped by more than expected, in yet another show of support for not only the Chinese economy, but for the real estate sector in particular.

    Chinese economy is expected to grow by a meager 5% again this year with several concerns still lingering. The real estate sector appears void of confidence especially after a court order to liquidate the large developer, Evergrande and while the rest of the world is battling inflation, China is dealing with the threat of deflation - lower prices year on year.

    Nevertheless, the added support did little for oil markets as prices head lower. Concerns around global economic growth persist, as China is a major contributor to oil demand. If doubts around China’s economic recovery persist, this could be seen in a lower oil price.

    Brent Crude oil drops at prior swing low, propped up by the 200 SMA

    Crude oil prices have put in a phenomenal recovery, rising over 9% from the early February swing low. Price action appears to have found resistance at the $83.50 mark, where prices have since turned lower towards the $82 mark. Cross section may be supported here given that the $82 mark it's followed very closely by the 200-day simple moving average, meaning continued bearish momentum below the long-term trend filter will be required to avoid a period of sideways trading.

    The zone highlighted in purple corresponds to the fortunes of the local Chinese stock market, which sold off aggressively, but has since stabilized on the back of state linked investment institutions buying up shares and ETFs in large quantities to restore confidence in the market.

    However, $83.50 remains as immediate resistance with the RSI turning lower before reaching overbought levels. Immediate support is at $82.00 followed by the 200 SMA.

    Brent Crude oil (UK oil) daily chart


    original-size.webpSource: TradingView

    WTI oil oscillates around key long-term trend filter

    WTI crude oil is lower on Tuesday and tests a very key level comprised of the 200-day simple moving average, and the long-term level of significance at $77.40. Over the more medium-term, price action trades higher, within an ascending channel, marking a series of higher highs and higher lows.

    Should we see further bearish momentum from here, oil prices may look to test the 50-day simple moving average down at the $73.84 mark before potentially making another test of channel support. Oil prices continue to react to global growth prospects which appear to have worsened given that the UK and Japan have already confirmed recessions. In addition, Europe's largest economy, Germany, is said to already be in a recession according to the Bundesbank.

    WTI crude daily chart


    original-size.webpSource: TradingView

    IG client sentiment reveals narrowing of shorts and longs, distorting signals

    • Oil-US crude: retail trader data shows 63.69% of traders are net-long, with the ratio of traders long to short at 1.75 to 1.
    • We typically take a contrarian view to crowd sentiment, and the fact traders are net-long suggests oil-US crude prices may continue to fall.
    • Positioning is more net-long than yesterday, but less net-long from last week. The combination of current sentiment and recent changes gives us a further mixed oil-US crude trading bias.

    Oil-US crude client positioning chart


    original-size.webpSource: DailyFX


    This information has been prepared by IG, a trading name of IG Australia Pty Ltd. In addition to the disclaimer below, the material on this page does not contain a record of our trading prices, or an offer of, or solicitation for, a transaction in any financial instrument. IG accepts no responsibility for any use that may be made of these comments and for any consequences that result. No representation or warranty is given as to the accuracy or completeness of this information. Consequently any person acting on it does so entirely at their own risk. Any research provided does not have regard to the specific investment objectives, financial situation and needs of any specific person who may receive it. It has not been prepared in accordance with legal requirements designed to promote the independence of investment research and as such is considered to be a marketing communication. Although we are not specifically constrained from dealing ahead of our recommendations we do not seek to take advantage of them before they are provided to our clients.

  20. Gold prices surge as US treasury yields fall: navigating XAU/USD's ascend amid economic uncertainties and fed's monetary policy shifts.


    original-size.webpSource: Bloomberg


    Written by: Diego Colman | Market Analyst, New York
     
    Publication date: 

    Gold (XAU/USD) rose for the fourth straight session on Tuesday (+0.50% to $2,027), firmly establishing itself above the $2,025 mark, supported by declining US Treasury yields and a subdued US dollar, with risk-averse sentiment on Wall Street likely reinforcing the metal’s advance.

    Factoring in recent gains, XAU/USD has risen more than 2% from last week’s lows near $1,985, set in the wake of hotter-than-anticipated US inflation numbers. Despite this positive performance, the Federal Reserve's monetary policy trajectory could cap gold’s upside in the near term, so caution is warranted.

    Earlier in 2024, bullion's prospects looked brighter on the assumption that the Fed would deliver aggressive easing measures this year. However, overly dovish expectations have since moderated on account of strong US labour market data, and stagnating progress on disinflation.

    Traders may further unwind dovish wagers on the FOMC’s path if incoming information continues to reflect economic strength and sticky price pressures. This is because these two factors could push policymakers to delay the start of their easing cycle and diminish the scale of subsequent rate reductions.

    There are no major events on the US economic calendar in the coming days, but next week will see the release of January PCE figures. The report is poised to shed light on recent inflation dynamics, and offer insights into the Fed's next move, so traders should keep a close eye on it.

    Gold price technical analysis

    Gold prices extended their recovery on Tuesday, pushing towards confluence resistance near $2,030, where the 50-day simple moving average converges with a descending trendline drawn from last year’s high. If bulls manage to trigger a breakout over the coming trading sessions, a rally toward $2,065 could be around the corner.

    On the flip side, if sellers return and spark a bearish reversal off current levels, technical support emerges at $2,005, followed by $1,990. From here onwards, additional losses could result in a pullback towards $1,975. On further weakness, all eyes will be on the 200-day simple moving average.

    Gold price daily chart


    original-size.webpSource: TradingView


    This information has been prepared by IG, a trading name of IG Australia Pty Ltd. In addition to the disclaimer below, the material on this page does not contain a record of our trading prices, or an offer of, or solicitation for, a transaction in any financial instrument. IG accepts no responsibility for any use that may be made of these comments and for any consequences that result. No representation or warranty is given as to the accuracy or completeness of this information. Consequently any person acting on it does so entirely at their own risk. Any research provided does not have regard to the specific investment objectives, financial situation and needs of any specific person who may receive it. It has not been prepared in accordance with legal requirements designed to promote the independence of investment research and as such is considered to be a marketing communication. Although we are not specifically constrained from dealing ahead of our recommendations we do not seek to take advantage of them before they are provided to our clients.

  21. Forex traders will be keeping an eye on the USD today for any volatility with the release of the FOMC minutes tonight.

    Written by: Angela Barnes | Financial presenter/producer, London
     
    Publication date: 

    The Federal Reserve made it clear that they will not lower interest rates until they see a decrease in inflation - and recent CPI data has shown that inflation is not going down as quickly as expected. We could therefore expect some upside on the dollar, as IGTV’s Angela Barnes explains.


    The U.S. dollar

    The value of the USD might change a lot soon because of some important reports coming out. Right now, the value of the dollar is not really going up or down, but that could change. The people who control the money in the U.S. have said that they will only lower interest rates if inflation goes down. But it seems like inflation is not going down as quickly as they thought, so the dollar could actually become more valuable.

    The stock markets

    The people who trade in the stock market are adjusting their predictions about when and if the government will lower interest rates. This has caused the value of the dollar to go up since the beginning of the year. There's a tool that shows the chances of the government lowering interest rates, and right now, the chances are pretty low for the next meeting in March. But the chances go up for the meeting in May, and by the meeting in June, it's almost certain that they will lower rates. These increasing chances of lowering rates could affect how much the dollar is worth.

    So, to sum it up, the release of some important reports could make the value of the dollar change a lot. Right now, the value of the dollar is steady, but the government's stance on lowering rates and the slower-than-expected decrease in inflation might make the dollar more valuable. The predictions of the traders have also influenced the value of the dollar in recent months. It's unlikely that they will lower rates in the next meeting, but the chances go up for future meetings and this could affect the worth of the dollar.


    This information has been prepared by IG, a trading name of IG Markets Limited. In addition to the disclaimer below, the material on this page does not contain a record of our trading prices, or an offer of, or solicitation for, a transaction in any financial instrument. IG accepts no responsibility for any use that may be made of these comments and for any consequences that result. No representation or warranty is given as to the accuracy or completeness of this information. Consequently any person acting on it does so entirely at their own risk. Any research provided does not have regard to the specific investment objectives, financial situation and needs of any specific person who may receive it. It has not been prepared in accordance with legal requirements designed to promote the independence of investment research and as such is considered to be a marketing communication. Although we are not specifically constrained from dealing ahead of our recommendations we do not seek to take advantage of them before they are provided to our clients. See full non-independent research disclaimer and quarterly summary.

  22. Centrica shares sold off after releasing FY23 results, and the FTSE 100 company has been volatile since. Where next?

    centricaSource: Bloomberg
     

    Written by: Charles Archer | Financial Writer, London
     
    Publication date: 

    Centrica returned mixed FY23 results last week, as subsidiary British Gas saw full-year profits increase tenfold to £750 million — while the company as a whole saw profits fall by 17% to £2.8 billion.

    The FTSE 100 operator saw its shares fall to just 130p this morning. While it recovered to 133p per share through the day, it closed at just below 130p.

    While Centrica remains up by more than 25% over the past year, it has only risen by circa 6% over the past five years. Interestingly, it sports a low price to equity ratio of less than 2, with a less-than-inspiring dividend of 3.1%.

    Centrica share price: full-year results

    In full-year results, Centrica’s adjusted operating profit fell slightly year-over-year to £2.8 billion, excluding disposed Spirit Energy Norway assets — this compares to the £3.3 billion of a year before, but was above the company-compiled consensus of £2.26 billion. The energy provider’s adjusted EPS therefore also fell to 33.4p.

    On the other hand, statutory operating profit came in at £6.5 billion, and statutory EPS rose to 70.6p compared to a loss of 13.3p in 2022; this was at least partially due to the unwinding of unrealised hedge positions from last year.

    Centrica still saw free cash flow of £2.2 billion, and this included £200 million in working capital inflow compared to the £700 million outflow of 2022. It also retains a significantly strengthened balance sheet compared to last year — with a closing net balance of £2.7 billion, some £1.5 billion more than in 2022.

    While the dividend yield may not look inspiring, total cash returns in 2023 reached some £800 million, while the full year dividend was hiked by 33% to 4p per share. Meanwhile, the £1 billion share buyback programme is expected to return even more cash to investors and will run until July 2024.

    In addition to the financial positives, CEO Chris O’Shea enthuses that ‘we’ve improved security of supply through doubling the capacity of the Rough gas storage facility, through extending the life of the Morecambe Bay gas field into the 2030s, and through investing to extend the life of our nuclear power stations.’

    Where next for Centrica shares?

    Citigroup analysts called the share price slump on Monday ‘harsh,’ noting that the fall perhaps stemmed from ‘an investor meeting feedback referencing Centrica not wanting the entire equity story to be around share-buybacks.’

    The stock has responded positively; further, it’s building more momentum in its £600 million to £800 million per annum green-focused investment plan.

    The company has committed £140 million of voluntary support since the start of 2022 to struggling customers and O’Shea noted in a media call both that the company’s bad debt charge had almost doubled to a ‘little over £500 million’ and that ‘people that we think are struggling to pay, they might continue to struggle. I can't predict where that's going to go.’

    It’s worth noting the background to British Gas’s profits: the jump from £72 million was arguably mostly due to OFGEM allowing the energy supplier to recover £500 million of losses from its 7.5 million customers, that it suffered in the aftermath of Russia’s invasion of Ukraine.

    But the company has also benefitted from governmental help for consumers to pay their energy bills. And while gas prices have fallen sharply over the past year, energy bills remain higher than in the past.

    Perhaps a key risk is political; British Gas was part of a well-publicised scandal in 2023 when it emerged debt agents working for the energy supplier had broken into vulnerable people's homes to force-fit prepayment meters. Given that the subsidiary has seen profits rocket on the back of government support and higher bills, it may feel like a politically easy target in an election year.

    Looking ahead, O’Shea notes that the ‘strong underlying operational performance’ has continued into early 2024 — but that ‘sharply lower commodity prices and reduced volatility will naturally lower earnings in comparison to 2023.’

    The FTSE 100 business ended today down 8% year-to-date.


    This information has been prepared by IG, a trading name of IG Markets Limited. In addition to the disclaimer below, the material on this page does not contain a record of our trading prices, or an offer of, or solicitation for, a transaction in any financial instrument. IG accepts no responsibility for any use that may be made of these comments and for any consequences that result. No representation or warranty is given as to the accuracy or completeness of this information. Consequently any person acting on it does so entirely at their own risk. Any research provided does not have regard to the specific investment objectives, financial situation and needs of any specific person who may receive it. It has not been prepared in accordance with legal requirements designed to promote the independence of investment research and as such is considered to be a marketing communication. Although we are not specifically constrained from dealing ahead of our recommendations we do not seek to take advantage of them before they are provided to our clients. See full non-independent research disclaimer and quarterly summary.

  23. Following China stocks hitting multi-week highs, European and US Stock indices and the US dollar are under pressure as traders await speeches by Fed members Bostic and Bowman, FOMC minutes and Nvidia earnings. In the UK CBI industrial order expectations and a speech by MPC member Dhingra will be looked at and in the euro zone consumer confidence in an otherwise relatively empty economic calendar. 


    image.png

×
×
  • Create New...
us