

MongiIG
-
Posts
9,858 -
Joined
-
Last visited
-
Days Won
41
Content Type
Profiles
Forums
Blogs
Events
Community Tutorials
Store
Posts posted by MongiIG
-
-
It’s only March, but so much has changed on the interest rate front. Analysing the current stance of the Fed, ECB and BoE, and how FX traders should position themselves, given the current consensus surrounding interest rates.
Publication date:(AI Video Summary)
Important changes with interest rates
The head of the Federal Reserve, Jerome Powell, has been doing what was expected and there's some mixed economic data in the US that makes it more likely for interest rates to be cut in June. As a result, the value of the US dollar has gone down.
On top of that, the European Central Bank (ECB) has also hinted at the possibility of cutting interest rates in both June and July. All of this makes it seem more likely that the Fed and the ECB will cut rates compared to the Bank of England (BoE). And because of this, the British pound has been doing really well against the weakening dollar.
GBP's growing value
Angeline Ong shows a chart with a red line that goes up to show how the pound's value has been growing since September 2022. This red line is backed up by three points where it touches, which confirms that the value of the pound is really going up. With the pound still on the rise and the interest rates suggesting that the Bank of England might delay any rate cuts, Ong suggests investing in the pound and betting that it'll keep doing well against both the dollar and the euro.
So basically, everything points to the British pound getting stronger and the US dollar and euro getting weaker. This means it's a good idea to put your money on the pound right now and hope it keeps growing.
This information has been prepared by IG, a trading name of IG Markets Limited. In addition to the disclaimer below, the material on this page does not contain a record of our trading prices, or an offer of, or solicitation for, a transaction in any financial instrument. IG accepts no responsibility for any use that may be made of these comments and for any consequences that result. No representation or warranty is given as to the accuracy or completeness of this information. Consequently any person acting on it does so entirely at their own risk. Any research provided does not have regard to the specific investment objectives, financial situation and needs of any specific person who may receive it. It has not been prepared in accordance with legal requirements designed to promote the independence of investment research and as such is considered to be a marketing communication. Although we are not specifically constrained from dealing ahead of our recommendations we do not seek to take advantage of them before they are provided to our clients. See full non-independent research disclaimer and quarterly summary.
-
10 minutes ago, XTRAVAGANZA said:Bitcoin has skyrocketed to $70,000, marking a significant milestone in its journey as the leading cryptocurrency. This surge reflects the growing interest and confidence in Bitcoin as a valuable asset.With its decentralized nature and limited supply, Bitcoin is increasingly seen as a hedge against inflation and a store of value in uncertain economic times. This achievement underscores Bitcoin's resilience and highlights its potential to reshape the financial landscape. What are your thoughts on Bitcoin reaching this historic milestone? Join the conversation!
Bitcoin Hits a New All-Time High
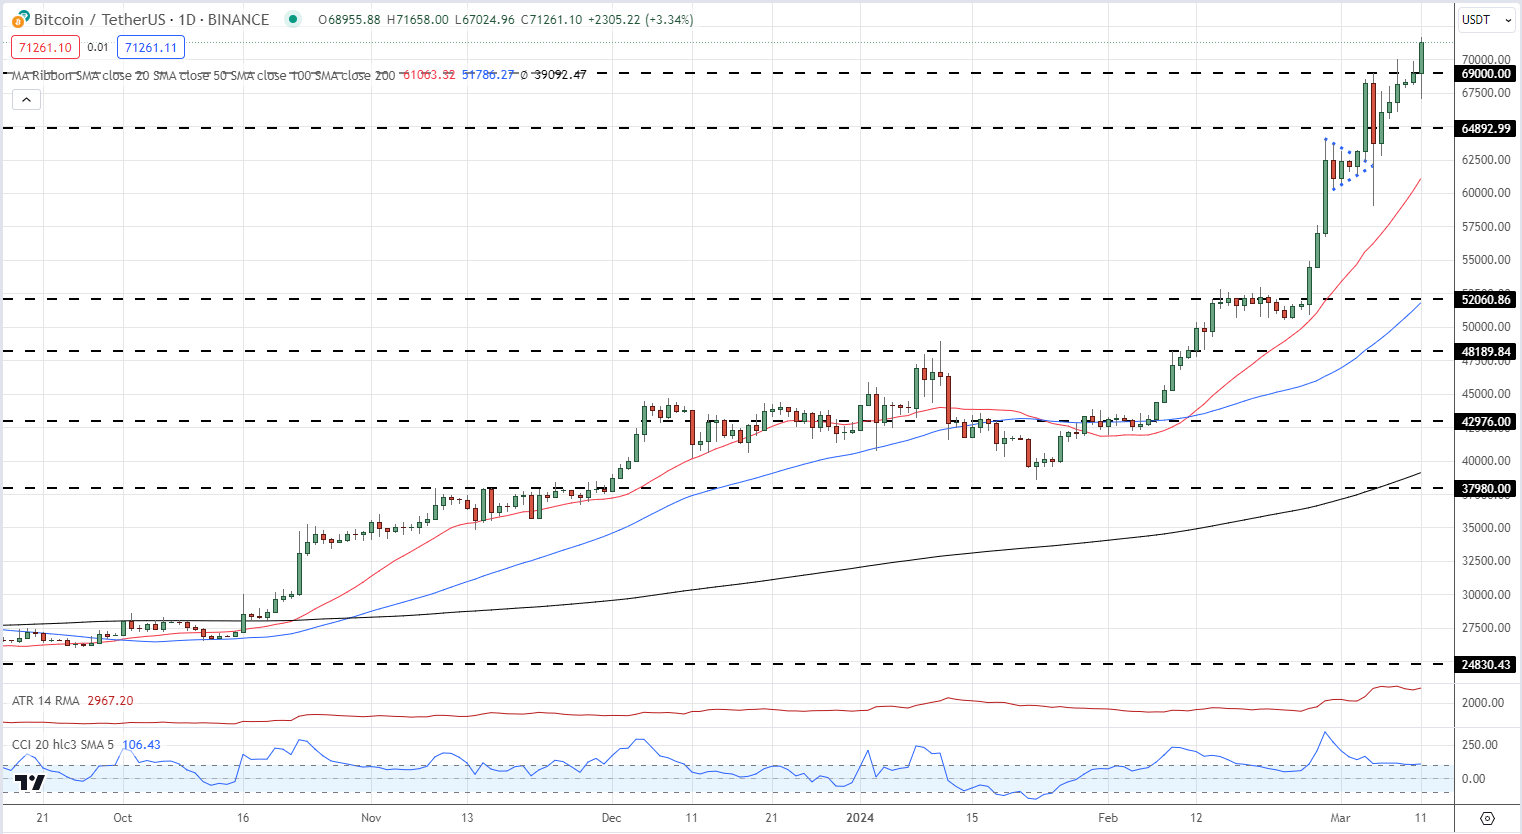
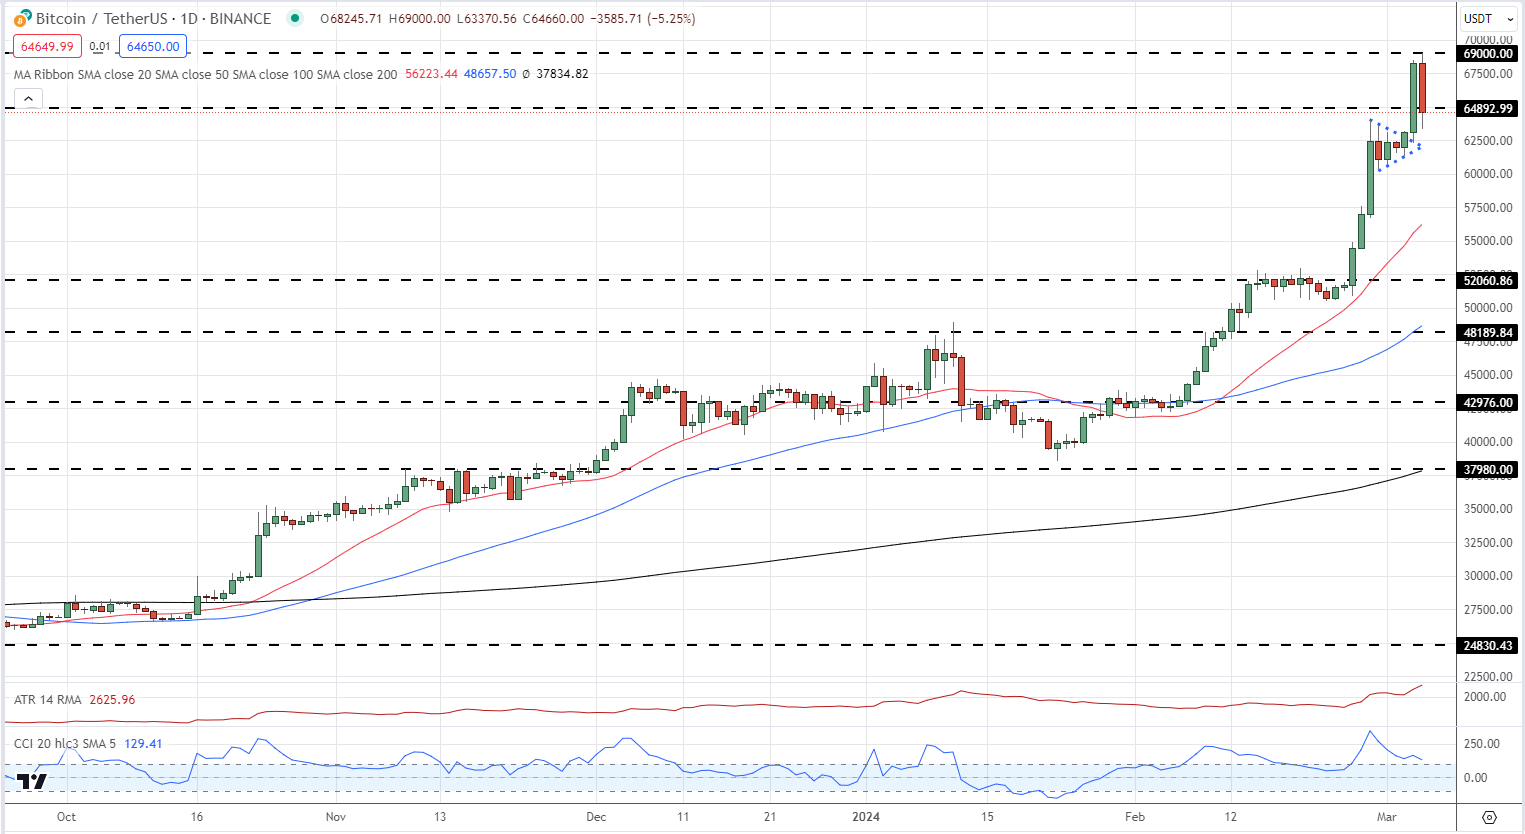
Mar 11, 2024 10:57 AM +02:00 | Nick Cawley, Senior StrategistBitcoin has started the week with a surge, dragging the rest of the cryptocurrency space higher with it. Late last week Bitcoin tried and failed to make a fresh all-time Bitcoin demand remains high, but this morning a new ATH was achieved with ease as buyers took control of the market. Bitcoin demand remains highs, driven primarily by the new ETF providers, while new supply is limited. The supply side of the equation will soon get tighter when the Bitcoin halving event takes place in mid-April.
News also out earlier that the LSE plans to accept applications for Bitcoin and Ethereum ETNs in Q2 may have also helped today’s push higher.
The Next Bitcoin Halving Event – What Does it Mean?
Bitcoin is now in price discovery mode as it trades ever higher. Ongoing demand could see the $75k level tested soon although a sharp reversal lower cannot be discounted. Cryptocurrencies remain highly volatile, highlighted by the March 5th daily candle that showed BTC/USD hitting $69k and $59k in the same session.
BITCOIN DAILY PRICE CHART
-
The AUD/USD pair soared to an 11-week peak, buoyed by positive economic indicators from Japan and the US. Upcoming US inflation data and the NAB Business Confidence survey are set to influence future market directions.
 Source: Bloomberg
Last week witnessed the Australian dollar against the US dollar marking its most significant ascent in over eleven weeks, finishing 1.52% higher at .6625.
This upward trajectory was fueled by the Australian dollar capitalising on the momentum of the surging Japanese Yen. The impetus came from robust Japanese wage data, which bolstered investor confidence in the Bank of Japan potentially concluding its Negative Interest Rate Policy (NIRP) during its 19 of March meeting.
Additional support for the AUD/USD pair was provided by the US Non-Farm Payrolls report on Friday. The report indicated a moderating labor market, evidenced by revised lower job gains for the preceding two months and an uptick in the unemployment rate to 3.9% from 3.7%. These developments lent credibility to the market's anticipation of three Federal Reserve rate cuts in 2024, aligning with the Federal Reserve's own forecasts.
Looking ahead, the forthcoming US inflation report on Tuesday night holds critical importance for the future direction of currency pairs. Meanwhile, domestic focus will shift to the upcoming release of the NAB Business Confidence survey, which promises to provide fresh insights into the business sentiment within Australia.
What is expected from NAB Business Confidence Index (Tuesday, 12 March at 11.30am)
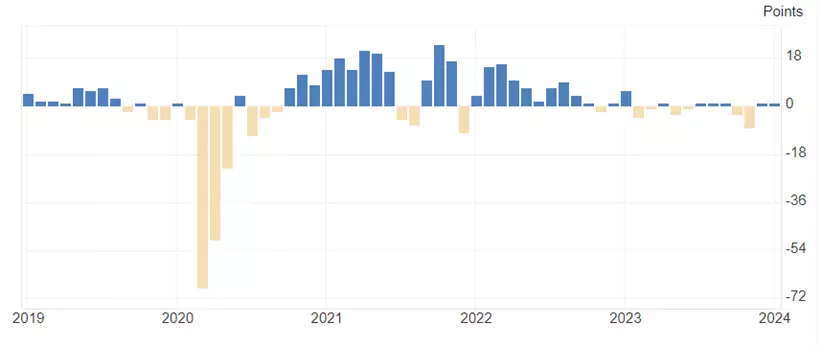
In January, the NAB Business Confidence index increased to +1, back in positive territory after rebounding from -8 in November to 0 in December.
Business Confidence remains subdued but is expected to rise marginally in the coming months as the focus shifts towards RBA rate cuts during the second half of 2024, and as inflationary cost pressures continue to ease.
NAB Business Confidence Survey chart
 Source: TradingEconomics
AUD/USD technical analysis
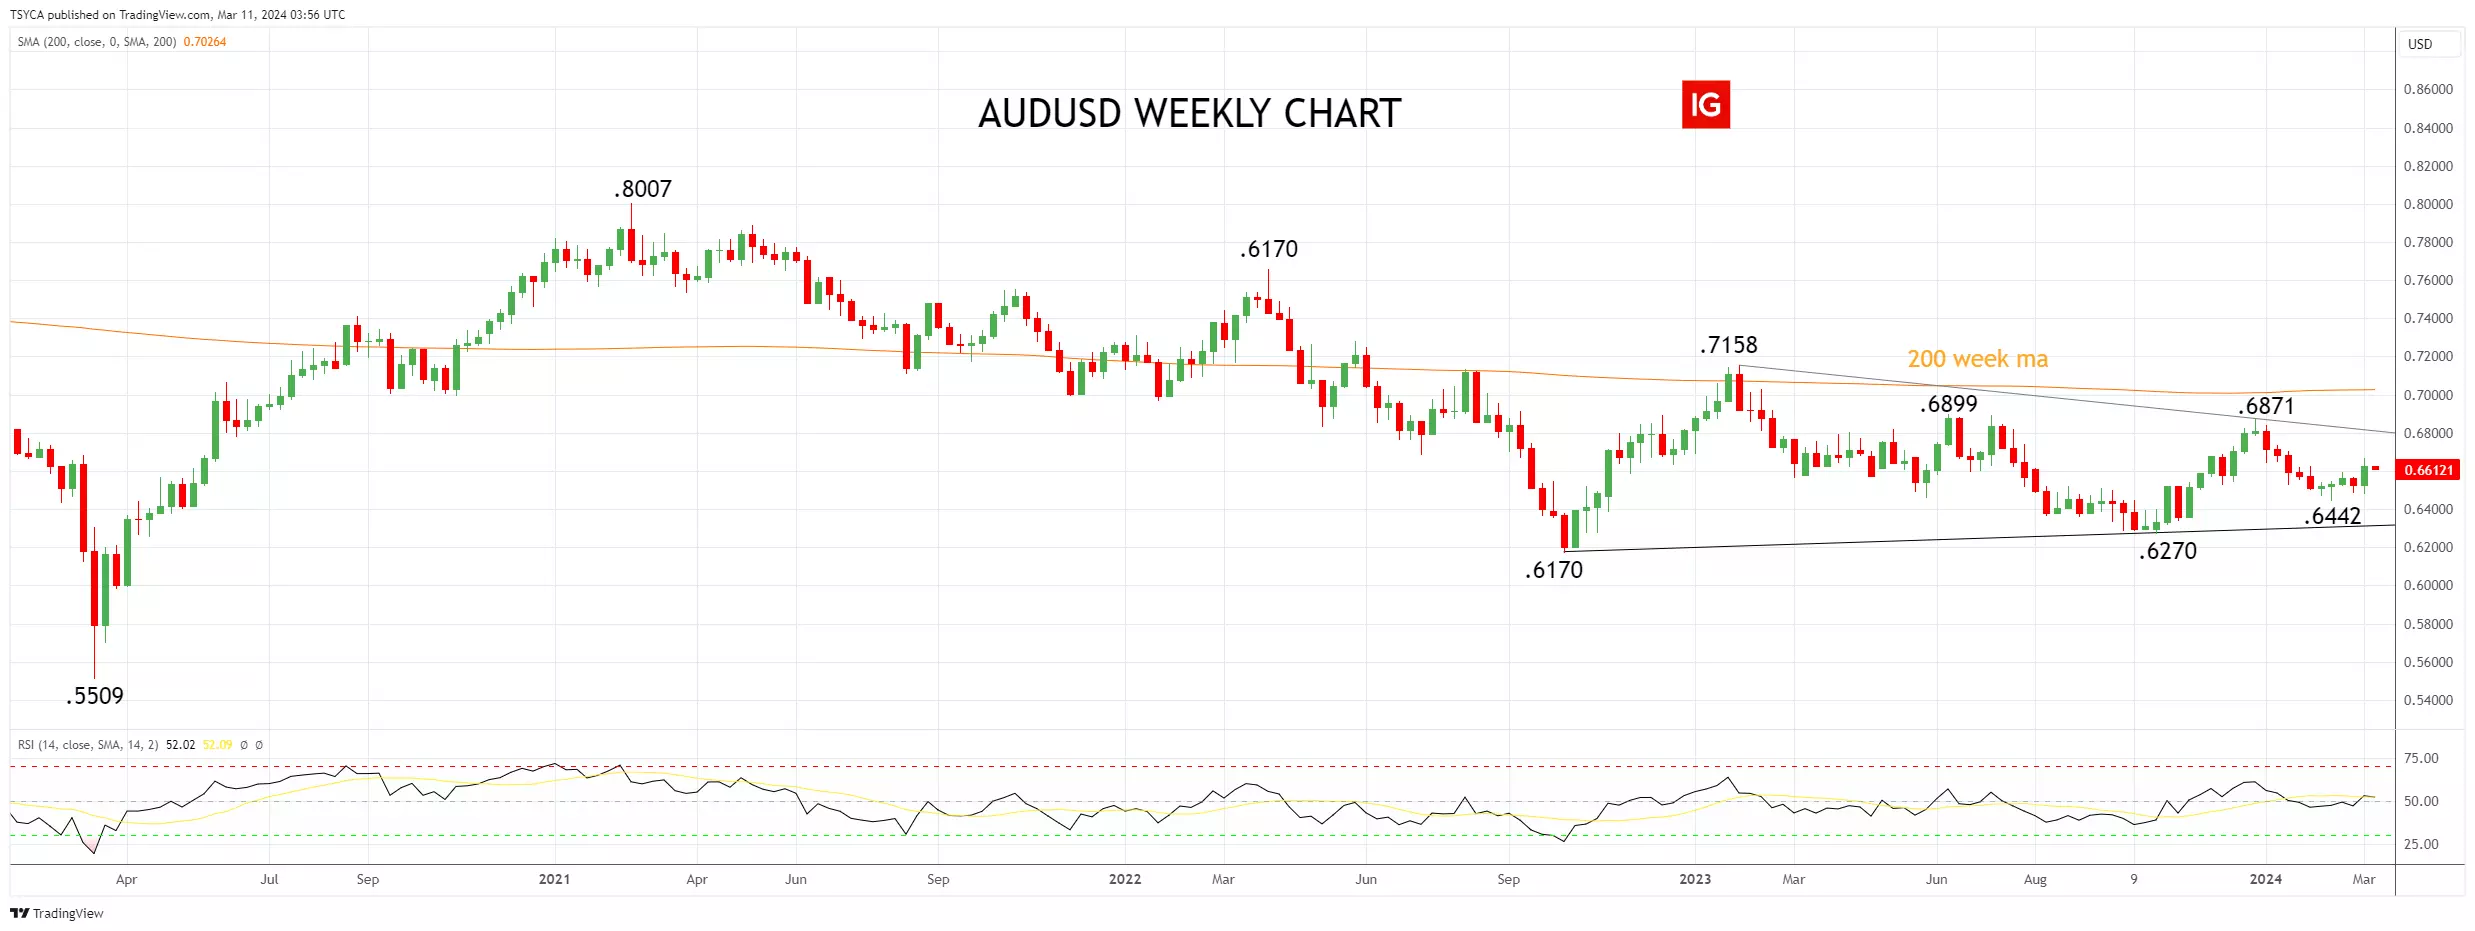
Following last week's rally, the AUD/USD, as viewed on the weekly chart below, appears to have gained the upper hand for now, with room to push towards downtrend resistance at .6800c
However, it is important to note that in the bigger picture, last week's rally appears to be part of an ongoing choppy correction from the October 2022 .6170 low, which does warn of further choppy price action ahead. Particularly around the middle of the range, which is where the AUD/USD is currently trading.
AUD/USD weekly chart
 Source: TradingView
AUD/USD daily technical analysis
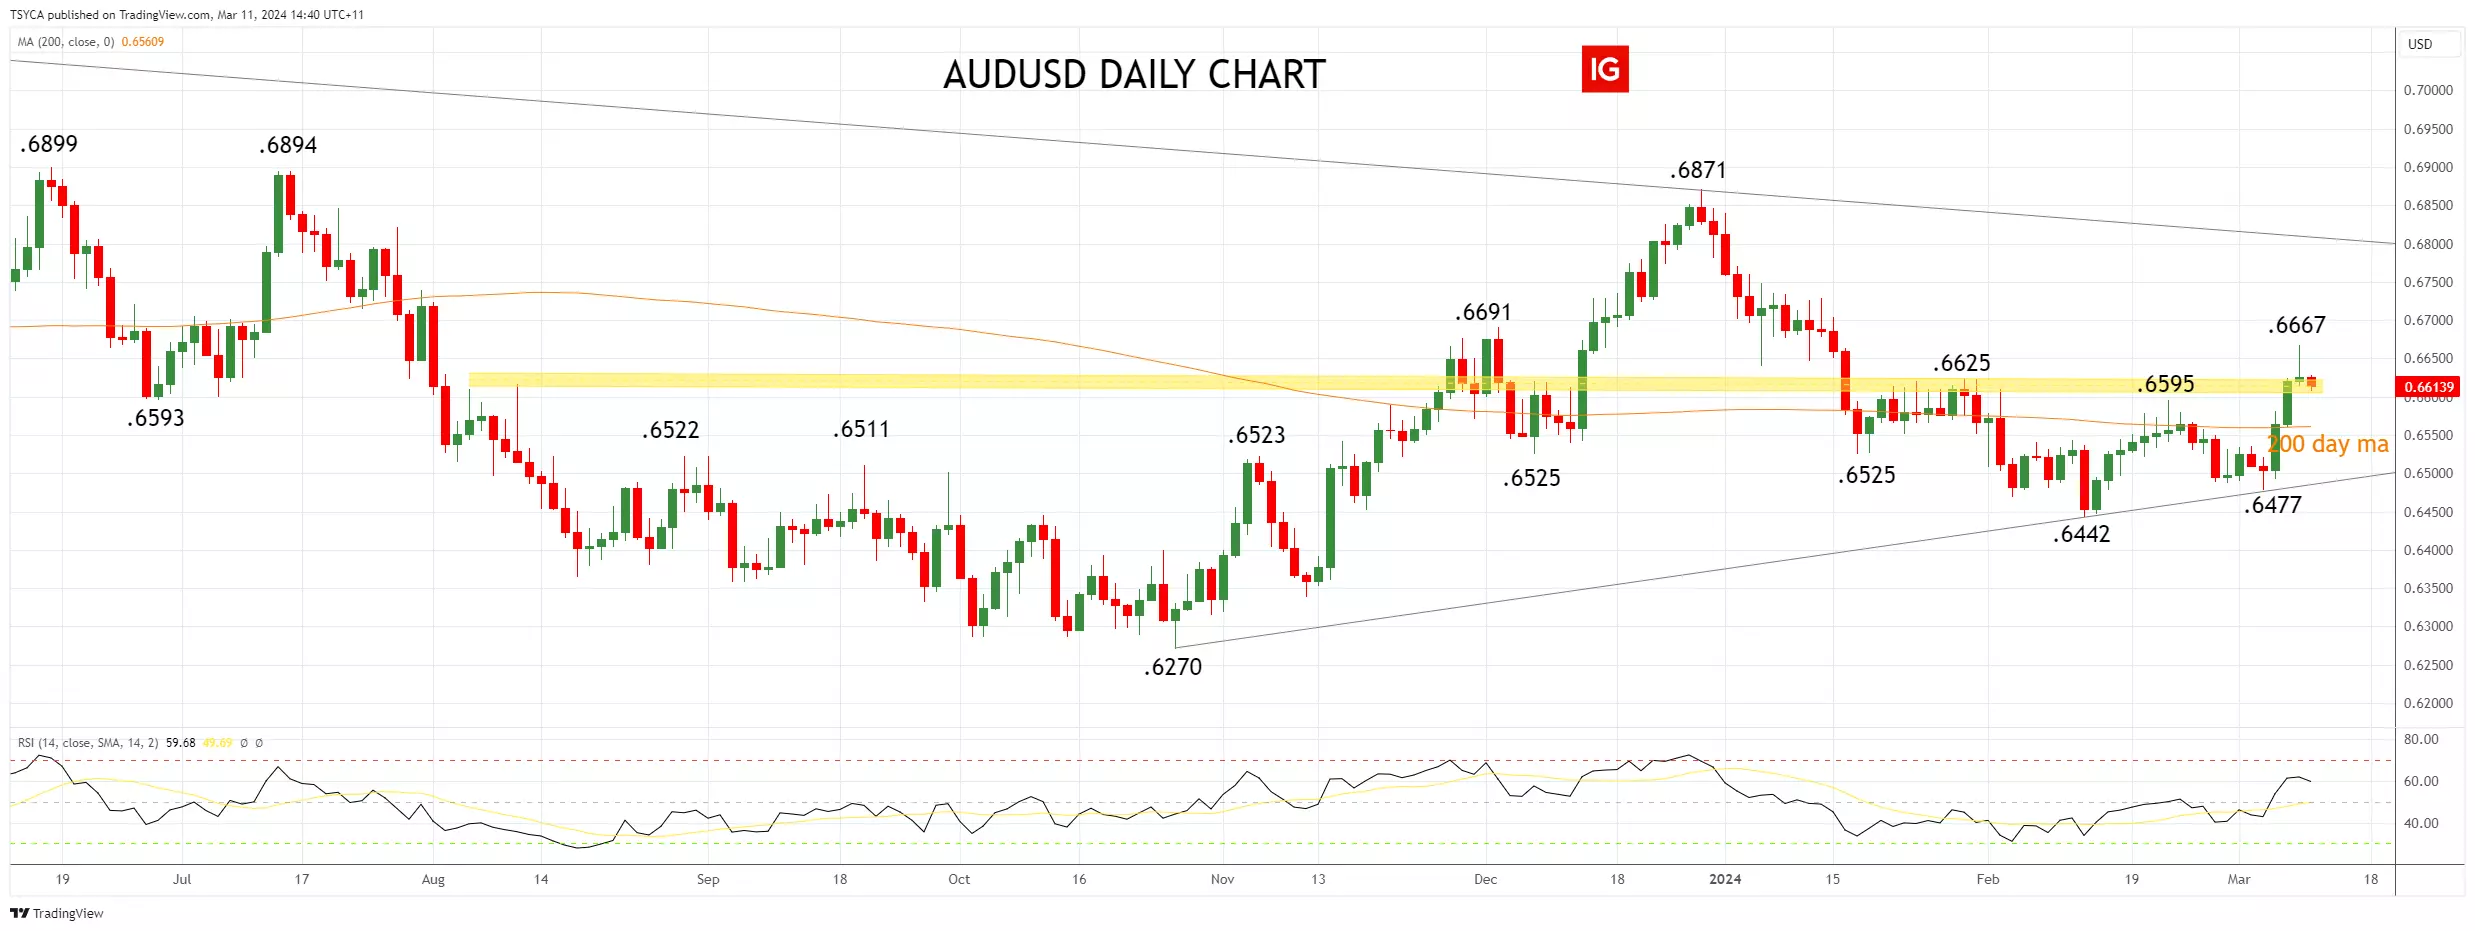
On the daily chart below, the AUD/USD was able to show a clean pair of heels to the resistance provided by the 200-day moving average at .6560, and that now becomes near-term support.
Taking some of the shine off last week's rally after its reversal from Friday night's .6667 high, the AUD/USD starts the week trading in congestion .6625 area. This is a level that the AUD/USD needs to clear if it is to challenge weekly resistance at .6800c.
AUD/USD daily chart
 Source: TradingView
- Source: TradingView. The figures stated are as of 11 March 2024. Past performance is not a reliable indicator of future performance. This report does not contain and is not to be taken as containing any financial product advice or financial product recommendation.
This information has been prepared by IG, a trading name of IG Markets Limited. In addition to the disclaimer below, the material on this page does not contain a record of our trading prices, or an offer of, or solicitation for, a transaction in any financial instrument. IG accepts no responsibility for any use that may be made of these comments and for any consequences that result. No representation or warranty is given as to the accuracy or completeness of this information. Consequently any person acting on it does so entirely at their own risk. Any research provided does not have regard to the specific investment objectives, financial situation and needs of any specific person who may receive it. It has not been prepared in accordance with legal requirements designed to promote the independence of investment research and as such is considered to be a marketing communication. Although we are not specifically constrained from dealing ahead of our recommendations we do not seek to take advantage of them before they are provided to our clients. See full non-independent research disclaimer and quarterly summary.
-
A mixed February jobs report and Nvidia's sell-off have US equity markets on edge before the CPI announcement. With the Fed's rate decisions in the balance, all eyes are on the upcoming data.
 Source: Bloomberg
US equity markets took a hit last week, sliding from record highs in the wake of a mixed jobs report. Investors in Nvidia, seeing a 5.55% drop, raced to sell off their shares before the upcoming U.S. CPI report.
The details of the non-Farm payrolls report showed that the US economy added 275k jobs in February, beating forecasts for 200k. However, the upside surprise to the headline number was more than offset by a downward revision in job gains over the prior two months of 167k, and a rise in the unemployment rate to 3.9% from 3.7% prior. Average hourly earnings slowed to 0.1% MoM, which saw the annual rate ease to 4.3% YoY from 4.5%.
The jobs report revealed sufficient signs of moderation to maintain, for the time being, the anticipation of three Federal Reserve rate cuts this year, aligning with the Fed's projections. However, the continuation of these projections into the Fed's March summary of economic forecasts hinges largely on Tuesday's CPI report.
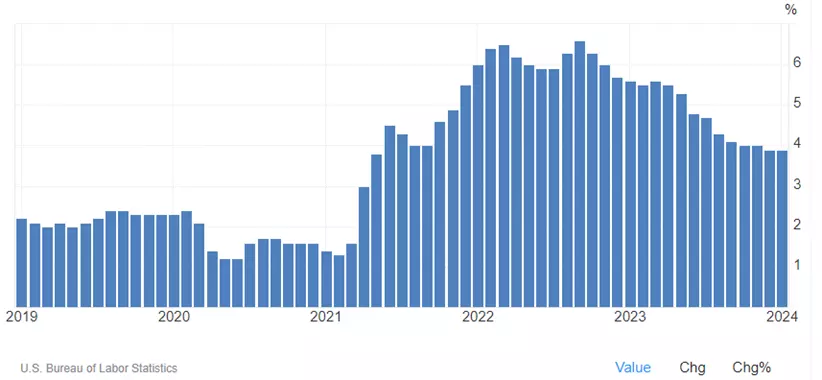
What is expected from US CPI (Tuesday, 12 March at 11.30pm)
The expectation is for headline CPI to rise by 0.4% MoM in February, which would see the annual rate remain stable at 3.1%. Core CPI is expected to rise by 0.3% MoM, which would see the annual rate cool to 3.7%.
If the core CPI number is much hotter than outlined above because the January New Year price rise effects don’t fall out as expected, there is a chance that three dots could become two dots in the Feds March SEP. This outcome would likely be poorly received by equity markets.
Core CPI chart
 Source: TradingEconomics
S&P 500 technical analysis
Last week, a "loss of momentum" candle formed in the Nasdaq cash and the S&P 500 cash.
While this occurrence in isolation certainly doesn't guarantee a pullback, we note that it occurred at new highs, on bearish divergence, and in the area of a possible Wave V high within our preferred Elliott Wave Framework. A combination that piques our interest.
From here, if the S&P 500 cash were to see a sustained break of uptrend support at 5090ish, and then below recent lows at 5060/40ish, it would warn that a deeper pullback initially towards 4900 is underway. Until then, the path of least resistance will remain higher.
S&P 500 daily chart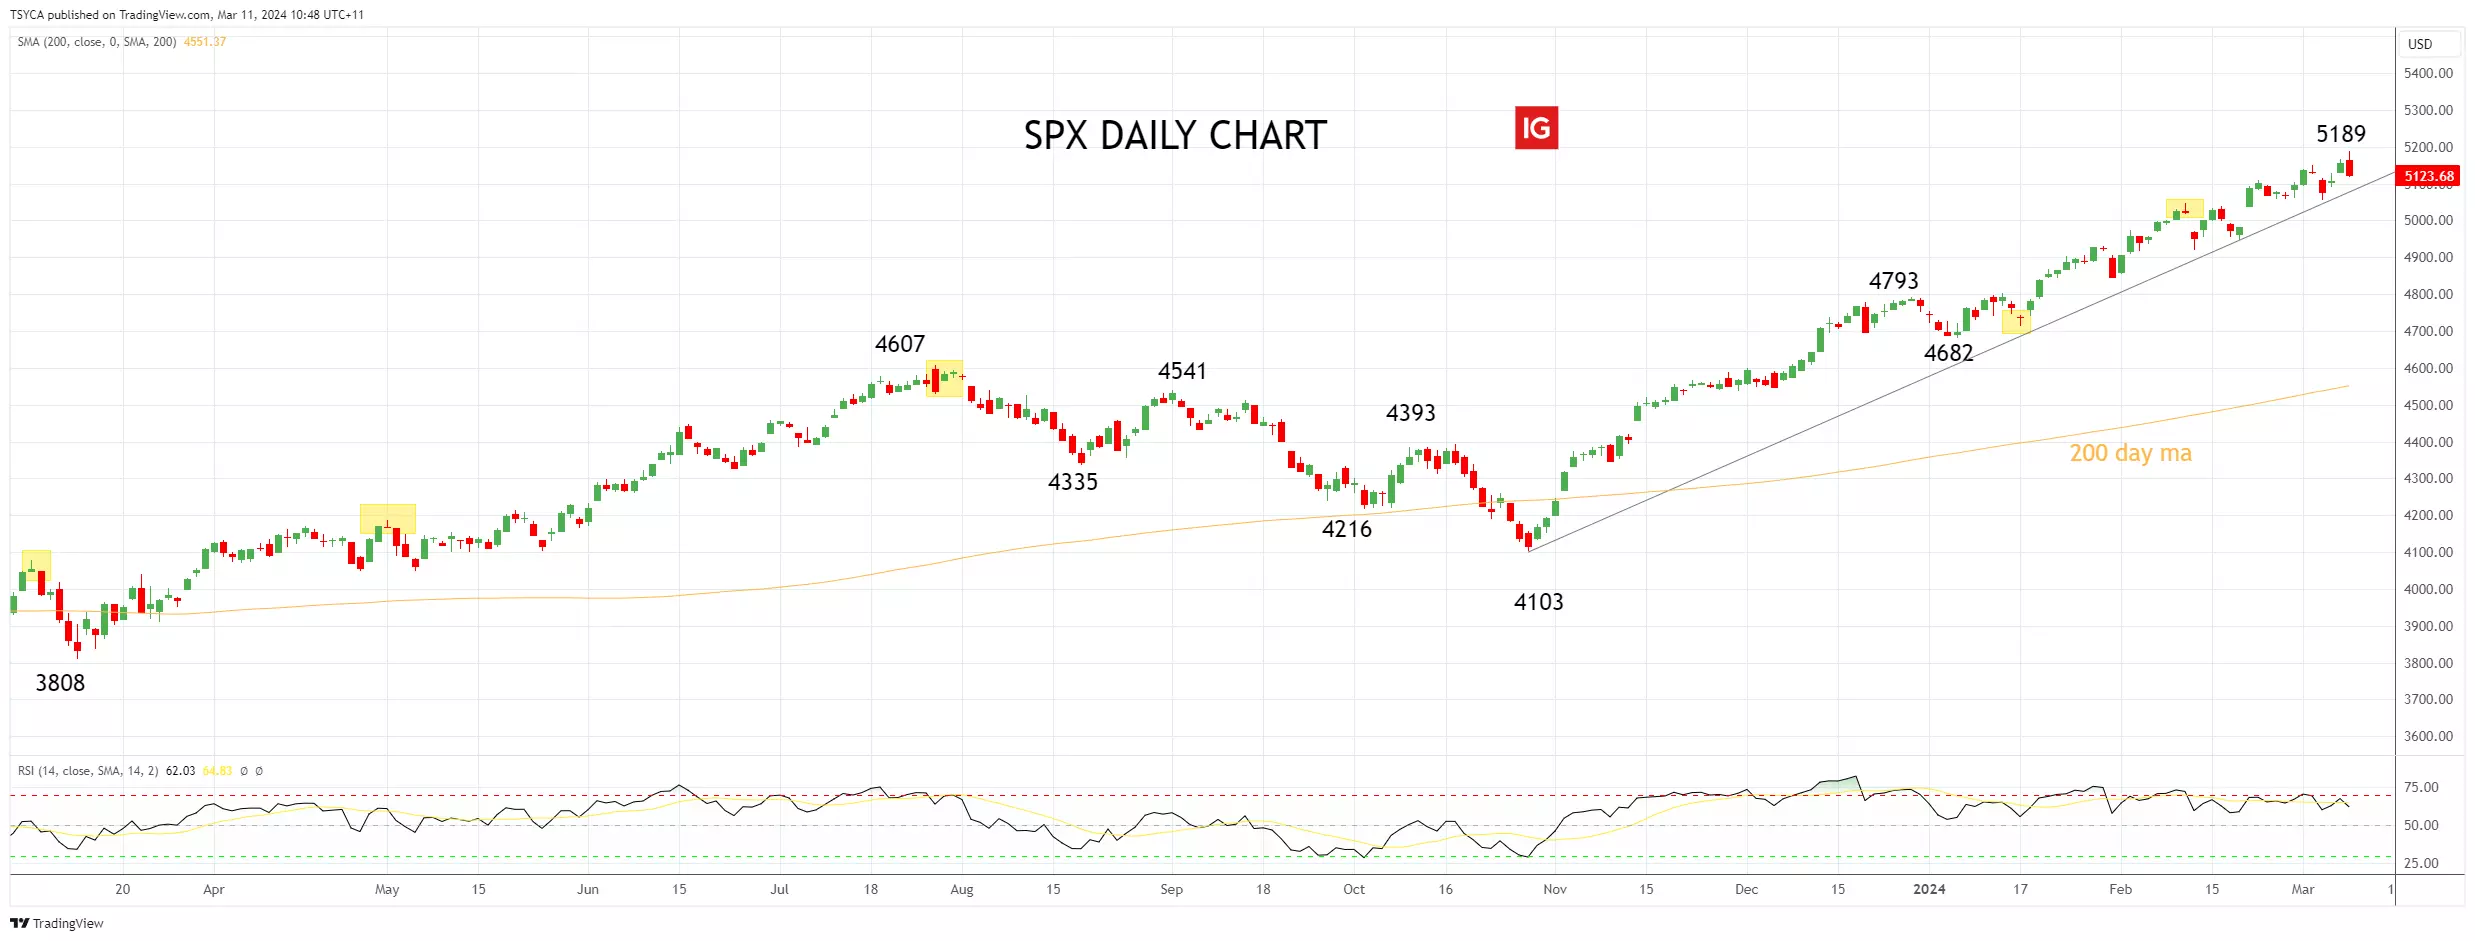 Source: TradingView
Nasdaq technical analysis
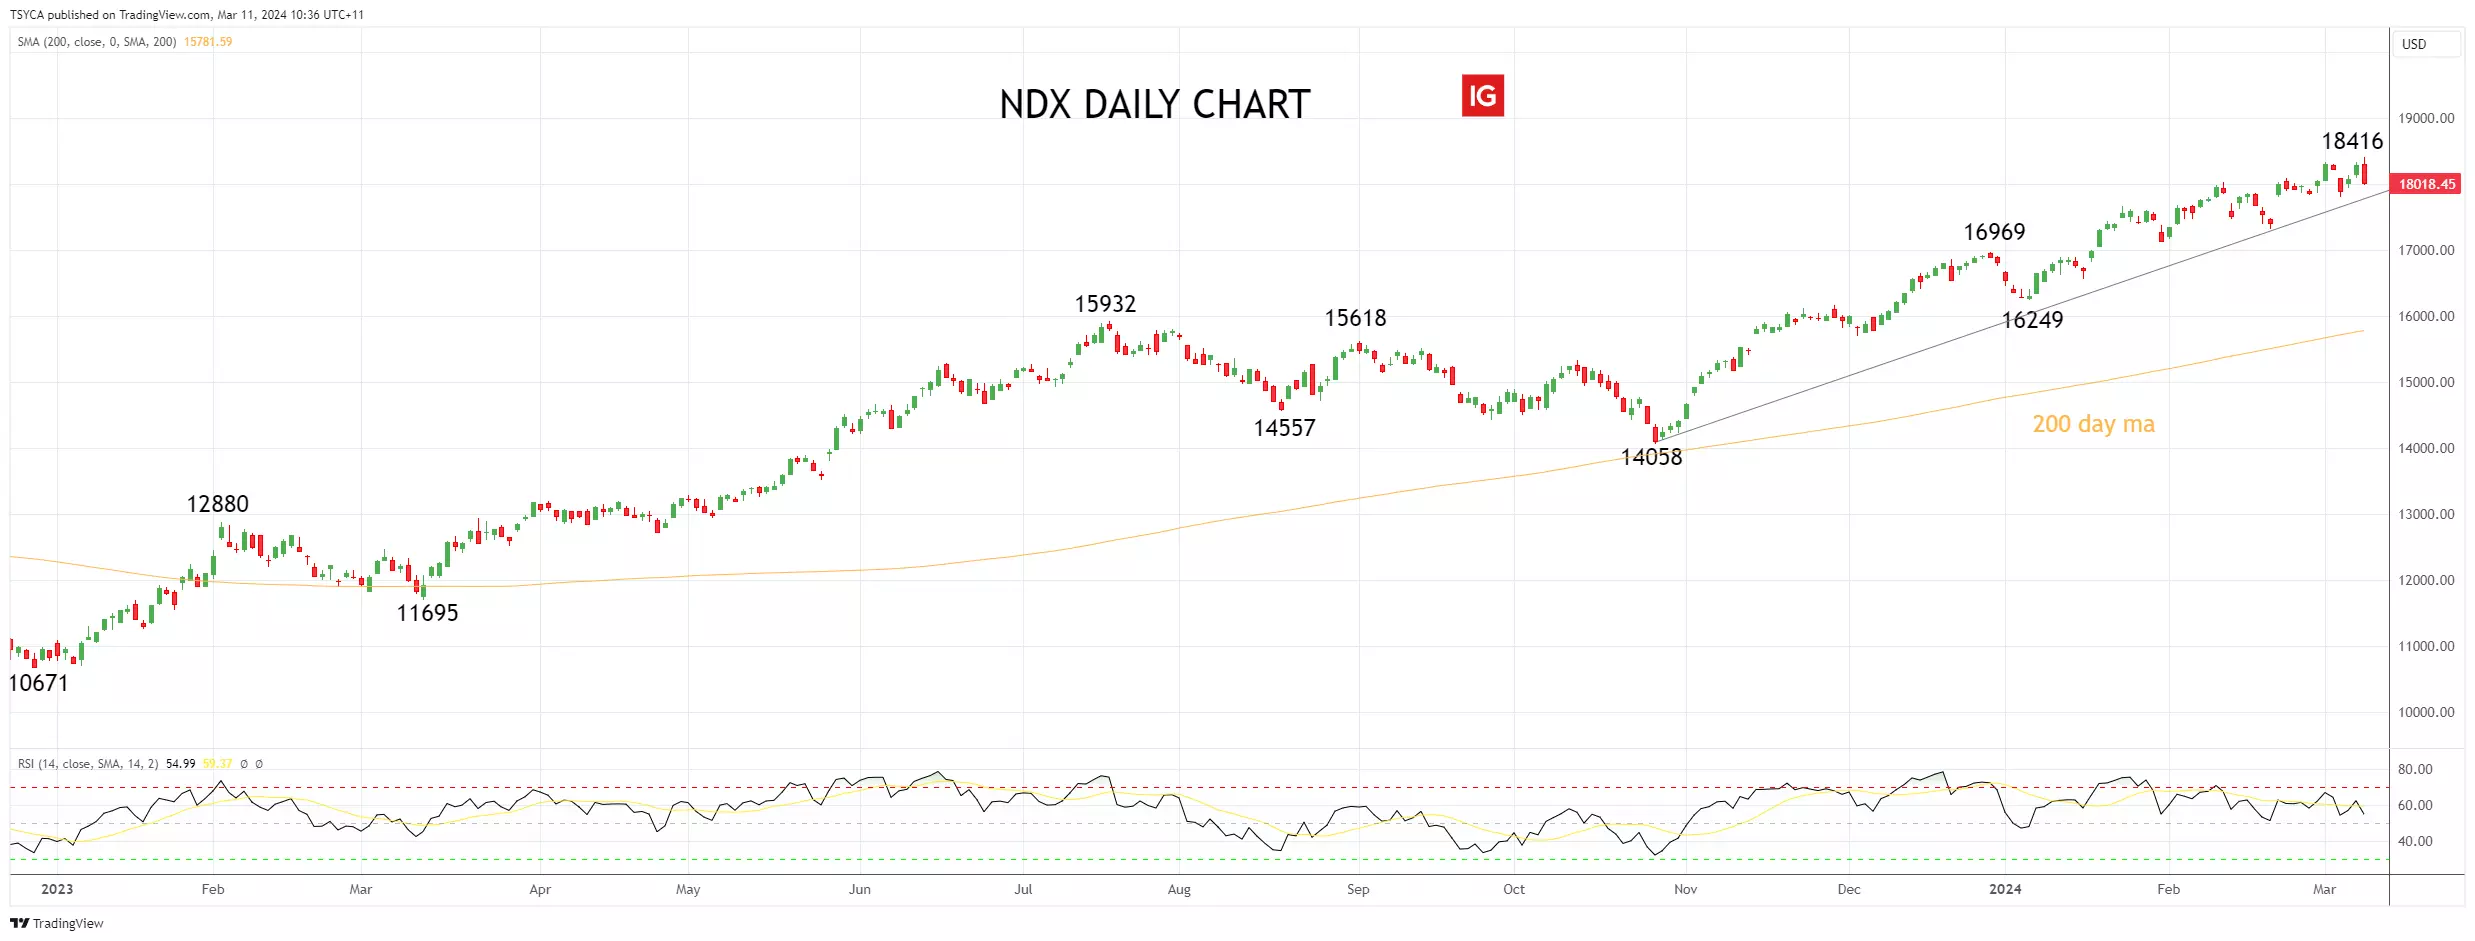
Last week, a "loss of momentum" candle formed in the Nasdaq cash and S&P 500 cash.
While this occurrence in isolation certainly doesn't guarantee a pullback, we note that it occurred at new highs, on bearish divergence, and in the area of a possible Wave V high within our preferred Elliott Wave framework. A combination that piques our interest.
From here, if the Nasdaq cash were to see a sustained break of uptrend support and recent lows at 17,800/750ish, it would warn that a deeper pullback initially towards 17,000 is underway. Until then, the path of least resistance will remain higher.
Nasdaq daily chart
 Source: TradingView
- Source: TradingView. The figures stated are as of 11 March 2024. Past performance is not a reliable indicator of future performance. This report does not contain and is not to be taken as containing any financial product advice or financial product recommendation.
This information has been prepared by IG, a trading name of IG Markets Limited. In addition to the disclaimer below, the material on this page does not contain a record of our trading prices, or an offer of, or solicitation for, a transaction in any financial instrument. IG accepts no responsibility for any use that may be made of these comments and for any consequences that result. No representation or warranty is given as to the accuracy or completeness of this information. Consequently any person acting on it does so entirely at their own risk. Any research provided does not have regard to the specific investment objectives, financial situation and needs of any specific person who may receive it. It has not been prepared in accordance with legal requirements designed to promote the independence of investment research and as such is considered to be a marketing communication. Although we are not specifically constrained from dealing ahead of our recommendations we do not seek to take advantage of them before they are provided to our clients. See full non-independent research disclaimer and quarterly summary.
-
Wall Street ended last week in the red, with some unwinding in tech stocks on Friday while the VIX touched its highest level in two weeks.
 Source: Bloomberg
Market Recap
Wall Street ended last week in the red, with some unwinding in tech stocks on Friday while the VIX touched its highest level in two weeks. The highlight was the US February job report, which saw cooling US labour conditions as the main takeaway. The US unemployment rate rose to its highest since January 2022 at 3.9% (versus 3.7% consensus), while wages grew at the slowest rate in two years at 0.1% month-on-month. Job additions did come in above expectations (275,000 versus 200,000 consensus), but the strength was stifled by downward revisions in previous readings.
The figures could be what the Federal Reserve (Fed) hopes to see, with a softer labour market supporting an earlier timeline for rate cuts, but market participants seem to take the opportunity for some profit-taking instead. Treasury yields were broadly lower, paving the way for the US dollar to weaken further. Gold prices took comfort in that, extending its gains for the eighth straight trading day to hang around the US$2,186 level.
Look-ahead: US CPI
Ahead, the new week may kick off on a more cautious tone as markets look towards the US consumer price index (CPI) release on Tuesday. Given the hotter-than-expected inflation data in January, traders will be closely watching this month’s CPI to be convinced that previous data is just a one-off. Expectations are for headline inflation to remain steady at 3.1%, while the core aspect may ease to 3.7% from previous 3.9%. If it holds true, this will be the lowest year-on-year core reading since April 2021, which may further bolster earlier rate cut bets.
What to watch: Nasdaq 100
The Nasdaq 100 index is back to flirt with its 18,000 level, leaving a near-term upward trendline on watch for some immediate defending from buyers. Failure for the trendline support to hold may pave the way for the index to retrace further to the 17,390 level, where a 23.6% Fibonacci retracement level stands. For now, its daily relative strength index (RSI) has also edged back to the mid-point level of 50, which buyers have successfully defended since November 2023. Any dip below the mid-point this week could bring about a near-term downward bias, suggesting further cooling in the recent risk rally.
 Source: IG charts
IGA, may distribute information/research produced by its respective foreign affiliates within the IG Group of companies pursuant to an arrangement under Regulation 32C of the Financial Advisers Regulations. Where the research is distributed in Singapore to a person who is not an Accredited Investor, Expert Investor or an Institutional Investor, IGA accepts legal responsibility for the contents of the report to such persons only to the extent required by law. Singapore recipients should contact IGA at 6390 5118 for matters arising from, or in connection with the information distributed.
The information/research herein is prepared by IG Asia Pte Ltd (IGA) and its foreign affiliated companies (collectively known as the IG Group) and is intended for general circulation only. It does not take into account the specific investment objectives, financial situation, or particular needs of any particular person. You should take into account your specific investment objectives, financial situation, and particular needs before making a commitment to trade, including seeking advice from an independent financial adviser regarding the suitability of the investment, under a separate engagement, as you deem fit.
No representation or warranty is given as to the accuracy or completeness of this information. Consequently, any person acting on it does so entirely at their own risk. Please see important Research Disclaimer.Please also note that the information does not contain a record of our trading prices, or an offer of, or solicitation for, a transaction in any financial instrument. Any views and opinions expressed may be changed without an update.
-
The Asian session saw a divergence between rallying Chinese markets, which continue their recovery from the lows of the year so far, and the rest of the region which came under fresh selling pressure. The Nikkei 225 in particular dropped sharply as the yen strengthened following news that Japan's economy did not contract in Q4, following GDP revisions that indicated growth of 0.1% instead of the previous 0.1% contraction. This bolsters the case for the Bank of Japan to shift rates at its meeting next week, with a 53% chance of a move priced in. Today sees a quiet start to the week, but tomorrow's US CPI reading will be the main event to watch. Friday saw market leader Nvidia suffer a sharp reversal, coming after huge gains since 1 January, and a stronger reading on inflation might yet tip markets into at least a short-term pullback.

-
The US dollar is facing its steepest weekly decline in nearly three months, with a 1% fall ahead of today's key U.S. jobs report. Unless the data is exceptionally strong, it is unlikely to alter expectations for upcoming Fed rate cuts, as Jerome Powell has signaled a willingness to reduce rates if inflation keeps cooling despite low unemployment. Economists forecast a more moderate 200,000 nonfarm payroll gain in February after January's spike, which analysts attribute to seasonal factors. The dollar's recent weakness reflects easing expectations, boosting currencies like the Australian dollar and euro to multi-month highs against the greenback. US stocks also recovered on Thursday, and the S&P 500 hit a fresh record high. Meanwhile, Japan appears poised for tighter monetary policy. Officials have struck a hawkish tone, citing progress toward the 2% inflation target ahead of the March policy meeting. Substantial private sector wage hikes also support a potential rate increase, driving a recent rally in the yen and Japanese banking stocks.
-
-
10 hours ago, AhmedMarsh said:
Hey crypto community! Just stumbled upon this discussion on the best crypto technical analysis. Some solid insights here! By the way, I dove into Bitcoin about six months ago, and it's a joy to finally see the anticipated growth. Any thoughts on how technical analysis played a role in your crypto journey?
Bitcoin (BTC) Posts a New All-Time High Before Prices Turn Sharply Lower
Mar 6, 2024 12:00 AM +02:00 | Nick Cawley, Senior Strategist
BITCOIN (BTC) PRICES, CHARTS, AND ANALYSIS:
- Bitcoin prints a new ATH then slumps by $5k
- Crypto-relates stocks suffer reversals of differing degrees.
The Next Bitcoin Halving Event – What Does it Mean?
Bitcoin tagged a fresh all-time high mid-afternoon before turning sharply lower as sellers sent the market spiraling lower. The tagging of the ATH saw a wave of sellers appear with market commentary suggesting that selling by recent leveraged long positions accelerated the move lower. Currently, Bitcoin is within yesterday’s trading range, but a break and open below yesterday’s low at $62.3k may see the market sell off further. On the positive side, demand from Bitcoin ETF providers remains strong, underpinning BTC, while the recent bullish pennant pattern remains intact and suggests higher prices.
BITCOIN DAILY PRICE CHART
What is your view on the cryptocurrency space – bullish or bearish?
-
-
Asia is extending the broad rally in global stocks and risk assets after Fed chairman Jerome Powell kept the door open to interest rate cuts later this year, and U.S. bond yields drifted lower. Powell said the Fed still expects to cut rates later this year, even though continued progress on inflation "is not assured." However, Japan's Nikkei fell after USDJPY dropped towards Y148, as momentum builds that a move from the Bank of Japan to end negative interest rates could come as soon as this month, with Reuters pricing suggesting a 45% chance of a rate hike in March. The European Central Bank (ECB) meeting today is expected to be more divided and hesitant about committing to monetary easing. While the ECB is universally expected to keep its policy rate at a record 4%, policymakers are likely to reiterate the need for more evidence that inflation is under control and that ongoing wage increases will not give it another boost. The ECB President Christine Lagarde's message will be crucial, as new economic projections are likely to point to lower economic growth and inflation this year. Investors have penciled in three or probably four rate cuts by the end of the year. Interest rate futures are almost fully priced in for a first rate cut from the ECB in June, with a total easing of 88 basis points expected for all of 2024, down from the 150 points expected in January.
-
The start of China's annual National People's Congress saw a muted response, with the Hang Seng index falling over 2% after Beijing set a modest 5% growth target for 2024 without any major fiscal stimulus measures. However, mainland Chinese shares rose amid suspected state-backed buying of exchange-traded funds tracking the CSI 300 index. Global markets are bracing for an eventful week with Fed Chair Jerome Powell's testimony, the US jobs report, the ECB's policy decision, and the UK budget. Investors are continue to search for cues on the Fed's future rate hike path, with the Atlanta Fed president suggesting no pressure to ease policy amid sticky inflation risks.
-
The European Central Bank (ECB) is expected to take another significant step in normalizing its monetary policy stance at its upcoming March 7th meeting.
 Source: Bloomberg
March Meeting to Mark Shift Towards Neutral Policy
While recent economic data has been relatively resilient, concerns about growth and the inflation outlook persist, leaving the timing and pace of potential rate cuts still uncertain.
At next week's gathering, the European Central Bank (ECB) is poised to move from its current restrictive policy stance towards a more neutral position. The new staff projections are anticipated to revise down growth forecasts for 2024 but leave the 2025 and 2026 outlooks broadly unchanged. Critically, inflation for 2025 is projected to be revised down to the 2% target.
Rate Cut Timing Hinges on Wage and Inflation Developments
While the new projections may not definitively rule out rate cuts at a particular meeting, market consensus remains that the first 25 basis point reduction will occur at the June meeting rather than April. Recent economic data has not been judged weak enough yet to bring forward easier policy.
The ECB has repeatedly stated it wants to ensure inflation returns sustainably to the 2% target over the medium term before cutting rates. As such, the path of wage growth will be closely monitored given its pivotal role in the inflation outlook.
Market Repricing but Muted Reaction Expected
Throughout February, markets repriced policy easing expectations significantly. They now anticipate around 87 basis points (bps) of ECB rate cuts for 2024, with 82bps coming in the second half of the year after an initial 25bps move in June. This repricing brings market expectations more in line with the ECB's own outlook.
Despite the recent adjustment in rate forecasts, a muted market reaction is anticipated following next week's meeting, as current pricing is seen as relatively well-aligned with ECB communications.
Better macro data helps to calm nerves
Recent macro data has afforded the ECB some breathing room ahead of kicking off rate cuts. While economic growth is stagnating, the region is not facing an outright contraction. Moreover, inflation expectations remain anchored and employment increased during Q4 2023.
The ECB will be weighing these resilient factors against persistent underlying inflationary pressures stemming from the tight labour market and the uncertainty around how wage gains will ultimately pass through to consumer prices.
This information has been prepared by IG, a trading name of IG Markets Limited. In addition to the disclaimer below, the material on this page does not contain a record of our trading prices, or an offer of, or solicitation for, a transaction in any financial instrument. IG accepts no responsibility for any use that may be made of these comments and for any consequences that result. No representation or warranty is given as to the accuracy or completeness of this information. Consequently any person acting on it does so entirely at their own risk. Any research provided does not have regard to the specific investment objectives, financial situation and needs of any specific person who may receive it. It has not been prepared in accordance with legal requirements designed to promote the independence of investment research and as such is considered to be a marketing communication. Although we are not specifically constrained from dealing ahead of our recommendations we do not seek to take advantage of them before they are provided to our clients. See full non-independent research disclaimer and quarterly summary.
-
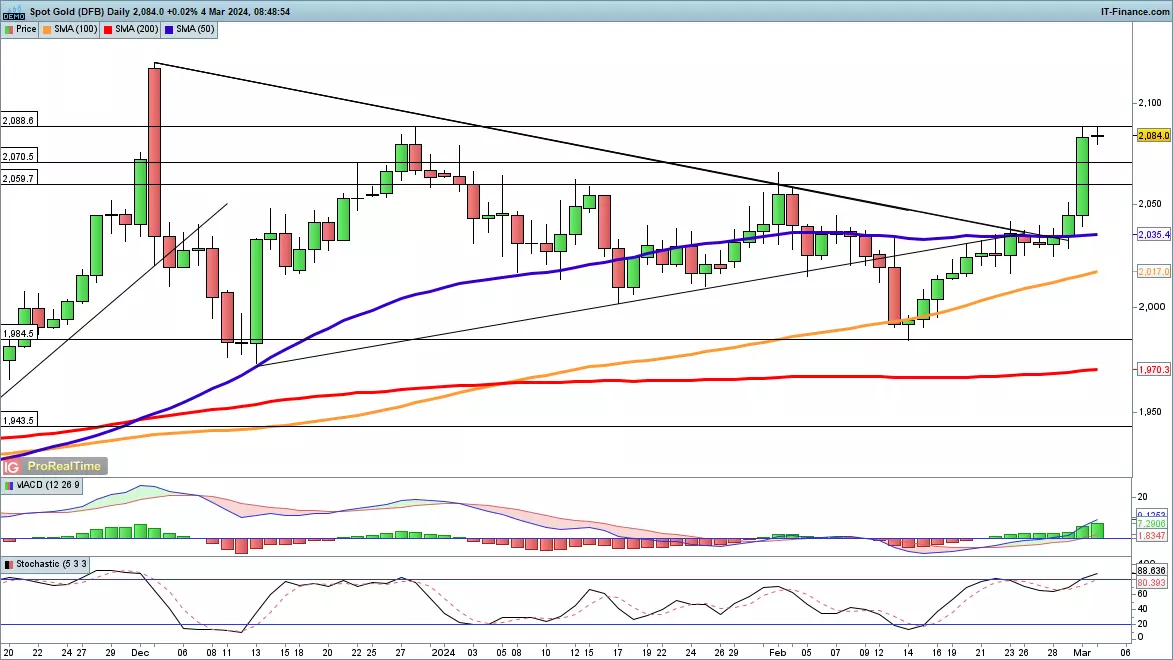
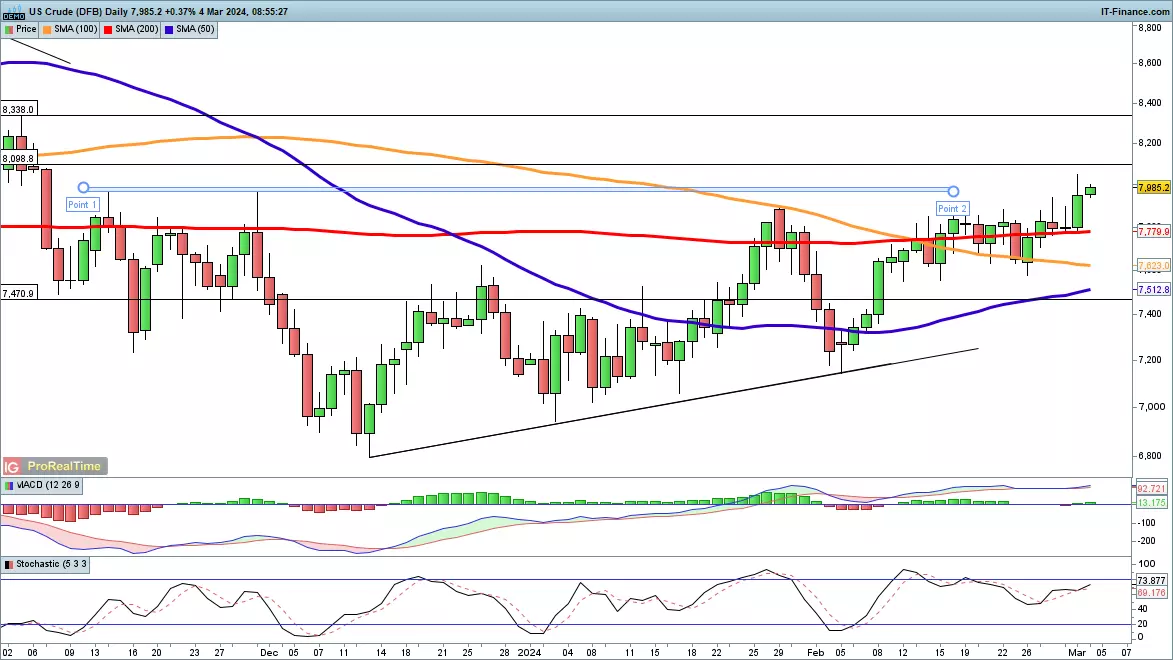
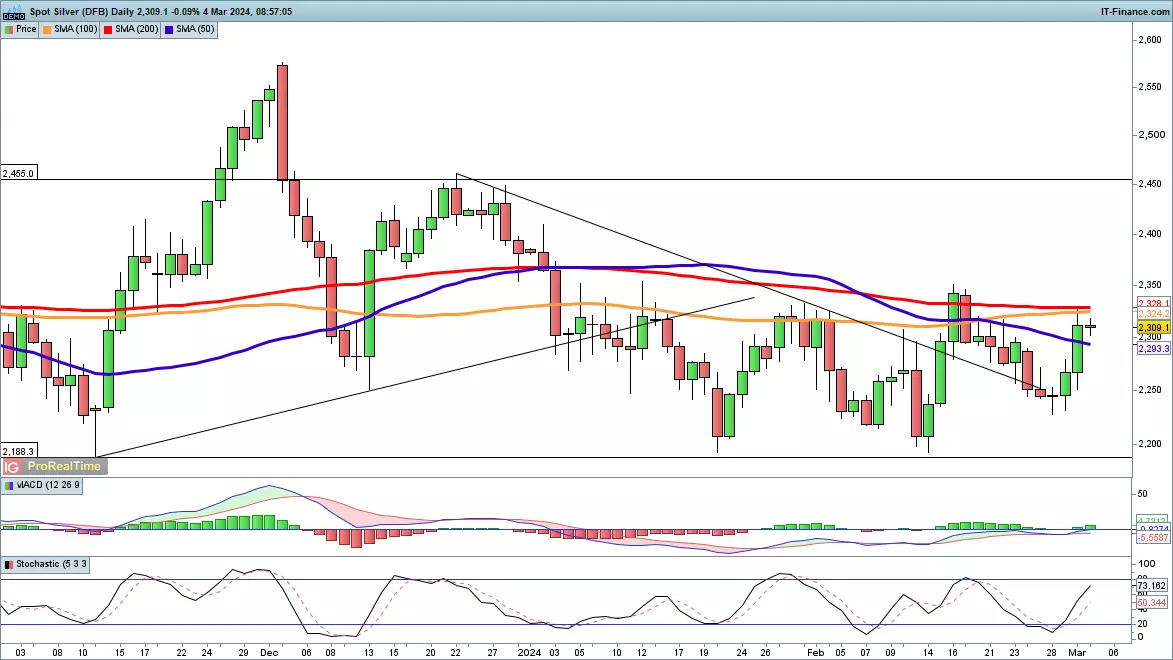
Gold price enjoys surge, while WTI crude price recovers $80 and silver price moves higher
Gold has returned to its previous highs from December, while oil is back at levels last seen in late December. While silver has rebounded, it lags far behind gold.
 Source: Bloomberg
Gold soars
Gold prices took off on Friday, rallying to their highest level since late December. This puts the price squarely on a bullish footing, continuing the recovery from the lows of mid-February. A close above $2088.60, the high from late December, leaves the price on course to test the record intraday high from early December. A reversal back below $2035 would be needed to put this bullish outlook on pause.
 Source: ProRealTime
WTI back at $80
The recovery from the December low continues, and now the price is testing $80 once more. A close above $81 would put the price back above the November and December high, and then open the way to further gains, towards $84. A reversal back below $76 is needed to negate tis near-term bullish view.
 Source: ProRealTime
Silver rallies, but lags behind gold While gold soars, silver has managed only a modest rally.
The consolidation pattern of the year so far continues; rallies towards $23.50 tend to peter out, while on the downside the buyers have defended $22. Notably last week’s low found support at a higher low, which could provide a foundation for a new push on above $23.50.
 Source: ProRealTime
-
FTSE 100 stalls as Nikkei 225, S&P 500 hit yet more record highs
Outlook on FTSE 100, Nikkei 225 and S&P 500 ahead of Powell testimony and US labour data.
 Source: Bloomberg
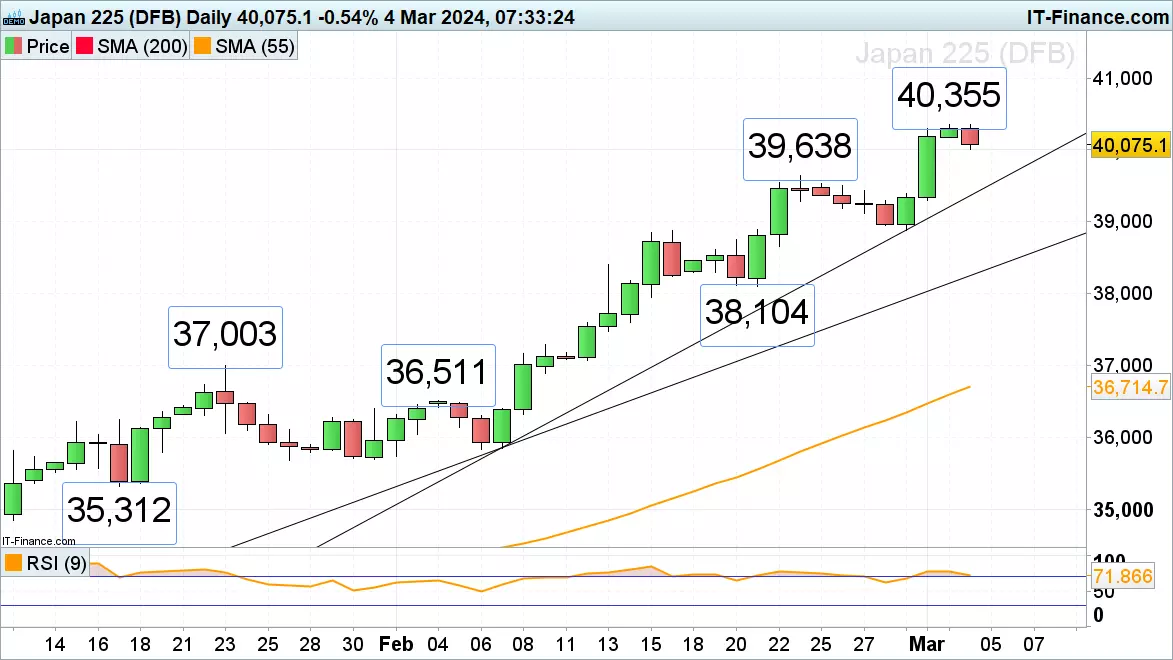
The Nikkei 225 made yet another record high above the 40,000 mark
The Nikkei 225 has once more topped the psychological 40,000 mark, having already done so on Friday, boosted by tech/AI stocks like Tokyo Electron amid a shift towards tech nearshoring and foreign funds leaving Chinese stock markets for Japanese ones. However, risks such as China's economic fluctuations, potential yen strengthening, and changes in the Bank of Japan's policy could impact the index's upward trajectory as could the currently highly overbought levels of the index. A minor retracement lower may take the Nikkei 225 back towards its 23 February high at 39,638 below which lies the 1989 previous record high at 38,957.
 Source: ProRealTime
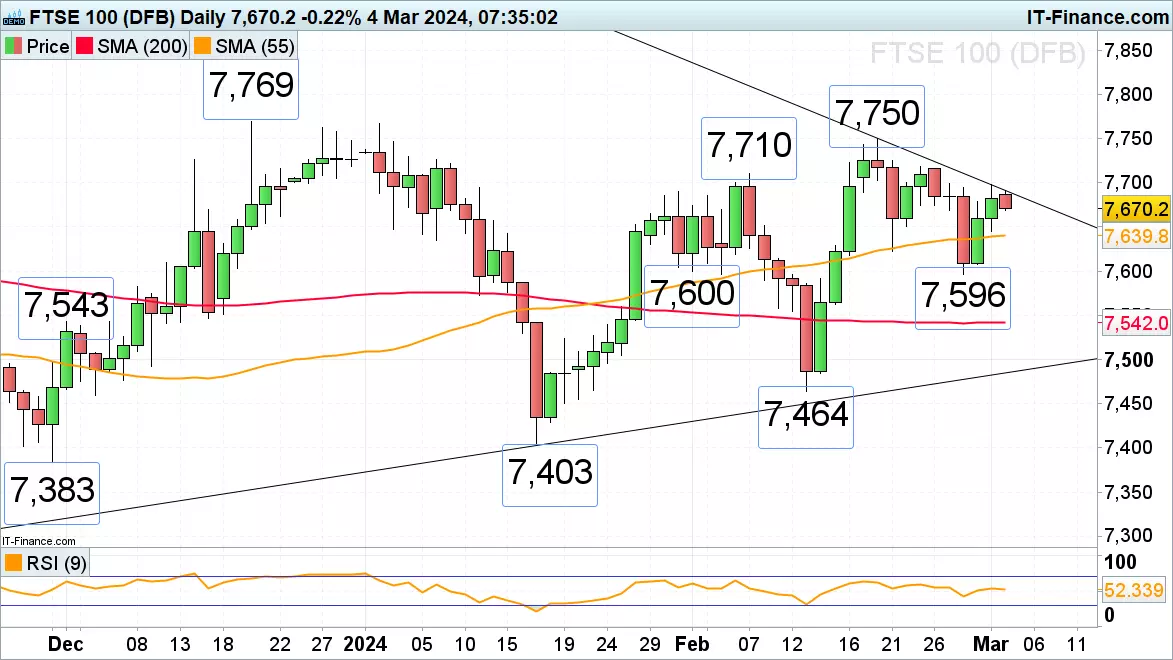
FTSE 100 is finding it difficult to reach the 7,710 to 7,769 region
The FTSE 100’s recovery from last week’s 7,596 low is finding it difficult to reach the early February high at 7,710. This level and the 23 February high at 7,717 need to be exceeded for the more significant 7,750 to 7,769 resistance area to be reached. It consists of the December-to-February highs. Minor support sits between Friday’s low and the 55-day simple moving average (SMA) at 7,645 to 7,640.
 Source: ProRealTime
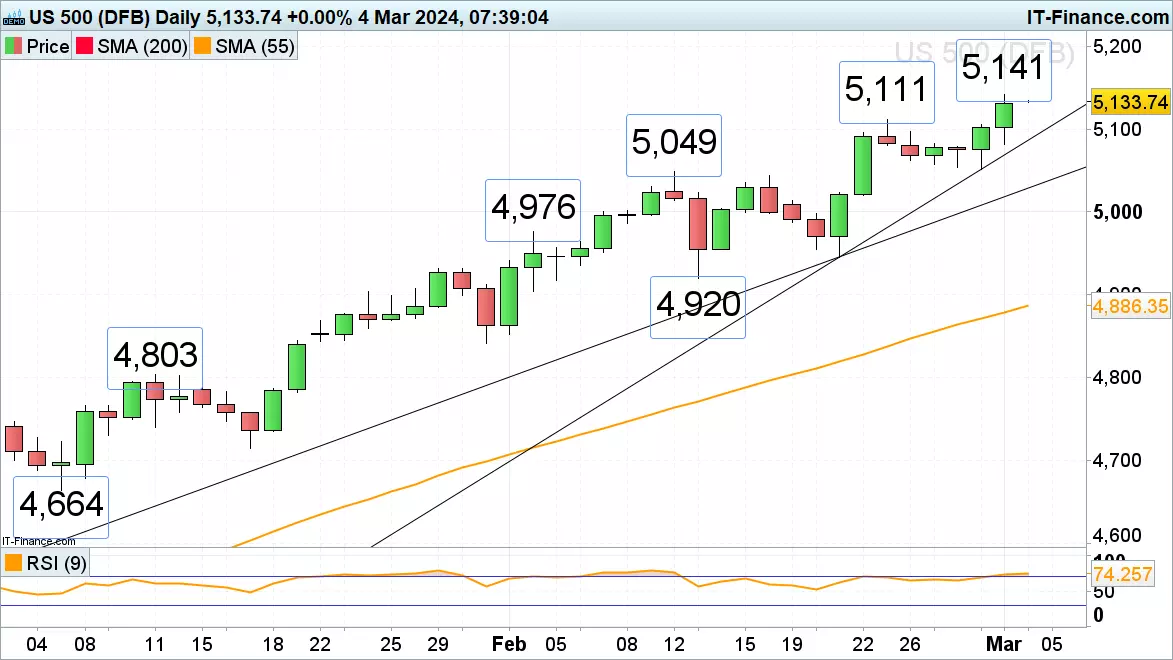
S&P 500 makes yet another record high
The S&P 500 surged higher again towards the end of last week and came close to the 5,150 region, hitting yet another record high ahead of this week’s Fed Chair Jerome Powell testimony and US labour data. Further up lies the 5,200 zone while support can be spotted around the 23 February high at 5,111. Below it lies the February-to-March tentative uptrend line at 5,088.
 Source: ProRealTime
-
The dollar could be tested later this week with the release of US jobs data, including the ADP employment change on Wednesday.
US private businesses are forecast to have hired 150,000 workers in February, after 107,000 job creations in January. Also on Wednesday, there will be JOLTs job openings. The number of job openings is thought to have dropped to 8.895 million in January, 131,000 fewer than in December. On Friday, Non-farm payrolls. Early expectations are for 200,000 job creations. Last month, the US economy added 353,000 jobs in January, after an upwardly revised 333,000 in December, and way above market forecasts of 180,000.
(AI Video Summary)
The US Dollar
This week, there will be important news about jobs in the United States that could affect the value of the USD. On Wednesday, there will be two reports called the ADP employment change and the Jolt's job openings. The Automatic Data Processing (ADP) employment change will show how many people were hired by private businesses in February. In January, there were 107,000 new jobs created, and the forecast for February is 150,000 new jobs. The Jolt's job openings report will show how many job openings there were in January compared to December. It is expected that there will be a decrease of 131,000 job openings.
Non-farm payrolls data
Then on Friday, there will be a report called the non-farm payrolls data. This report will give an early estimate of how many jobs were created in February. In January, the US economy added 353,000 jobs, which was better than what people expected. The forecast for February is 200,000 new jobs. All of these job reports are important because they can give us clues about what the Federal Reserve might do with interest rates, which can affect the value of the US dollar.
The Federal Reserve
Right now, the US dollar is down a little bit, about 0.02%. Traders are watching closely what Jerome Powell, the Chair of the Federal Reserve, says when he speaks to Congress. They are also watching the jobs data. All of this information will help traders understand what the Federal Reserve might do with interest rates, this in turn can affect how strong or weak the US dollar is compared to other currencies.
This information has been prepared by IG, a trading name of IG Markets Limited. In addition to the disclaimer below, the material on this page does not contain a record of our trading prices, or an offer of, or solicitation for, a transaction in any financial instrument. IG accepts no responsibility for any use that may be made of these comments and for any consequences that result. No representation or warranty is given as to the accuracy or completeness of this information. Consequently any person acting on it does so entirely at their own risk. Any research provided does not have regard to the specific investment objectives, financial situation and needs of any specific person who may receive it. It has not been prepared in accordance with legal requirements designed to promote the independence of investment research and as such is considered to be a marketing communication. Although we are not specifically constrained from dealing ahead of our recommendations we do not seek to take advantage of them before they are provided to our clients. See full non-independent research disclaimer and quarterly summary.
-
The AUD/USD dropped 0.58% to .6525, hit by poor Australian economic data and falling commodity prices, amidst dovish signals from the RBNZ and looming concerns over Australia's economic outlook.
Source: Bloomberg
The faltering three-week rally in the AUD/USD concluded last week as it closed 0.58% lower at .6525, despite the US dollar index, the DXY, also losing ground.
The decline in the AUD/USD was prompted by softer-than-expected Australian inflation and retail sales data. This was compounded by an intensification in offshore headwinds, as crucial commodity prices, including iron ore, dipped, and the Reserve Bank of New Zealand (RBNZ) indicated a reduced likelihood of rate hikes and an earlier commencement of rate cuts, which sent the Kiwi dollar tumbling lower.
Adding to the pressures on the AUD/USD, data this week is expected to reveal that growth in Australia during Q4 2023 was below par amid subdued consumption and a significant drop in business inventories.
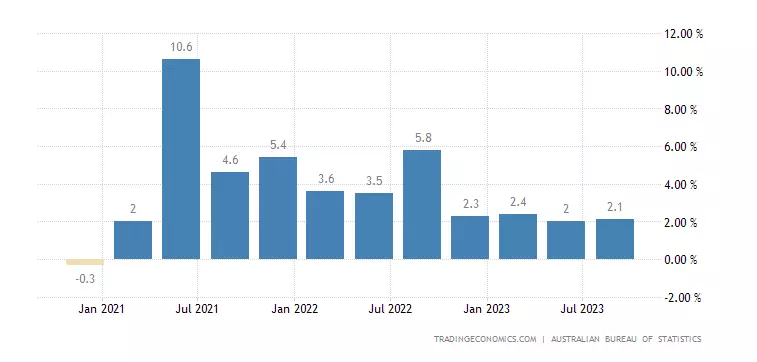
What is expected from GDP Q4 (Wednesday, March 6th at 11:30am AEDT)
Australian GDP grew by 0.2% in the September quarter of 2023 and 2.1% YoY. While this marked the eighth consecutive rise in quarterly GDP, it was deemed weak, as more typical GDP levels in Australia are nearer to 3%.
Within the details:
- Per capita GDP growth declined by 0.5% QoQ. This was the third successive quarterly fall in per capita GDP, also dubbed a “per capita recession.”
- The household saving-to-income ratio dropped to 1.1%, its lowest level since December 2007, as households tapped into accumulated savings to counter cost of living pressures.
- Government spending and capital investment were the primary growth drivers.
- Household spending remained stagnant as government benefits and rebates reduced household expenditure on essential services such as electricity.
This quarter (December or Q4), GDP is anticipated to grow by 0.2%, and the annual growth rate is expected to increase by merely 1.5%, offering further proof that economic activity has decelerated in response to higher interest rates. A negative quarterly figure on Wednesday is within the realms of possibility.
We anticipate that softer inflation, easing labour markets, and slower growth will lead the RBA to retract its tightening stance in June before implementing rate cuts of 25bp in August and November 2024.
AU annual GDP rate chart
 Source: TradingEconomics
AUD/USD technical analysis
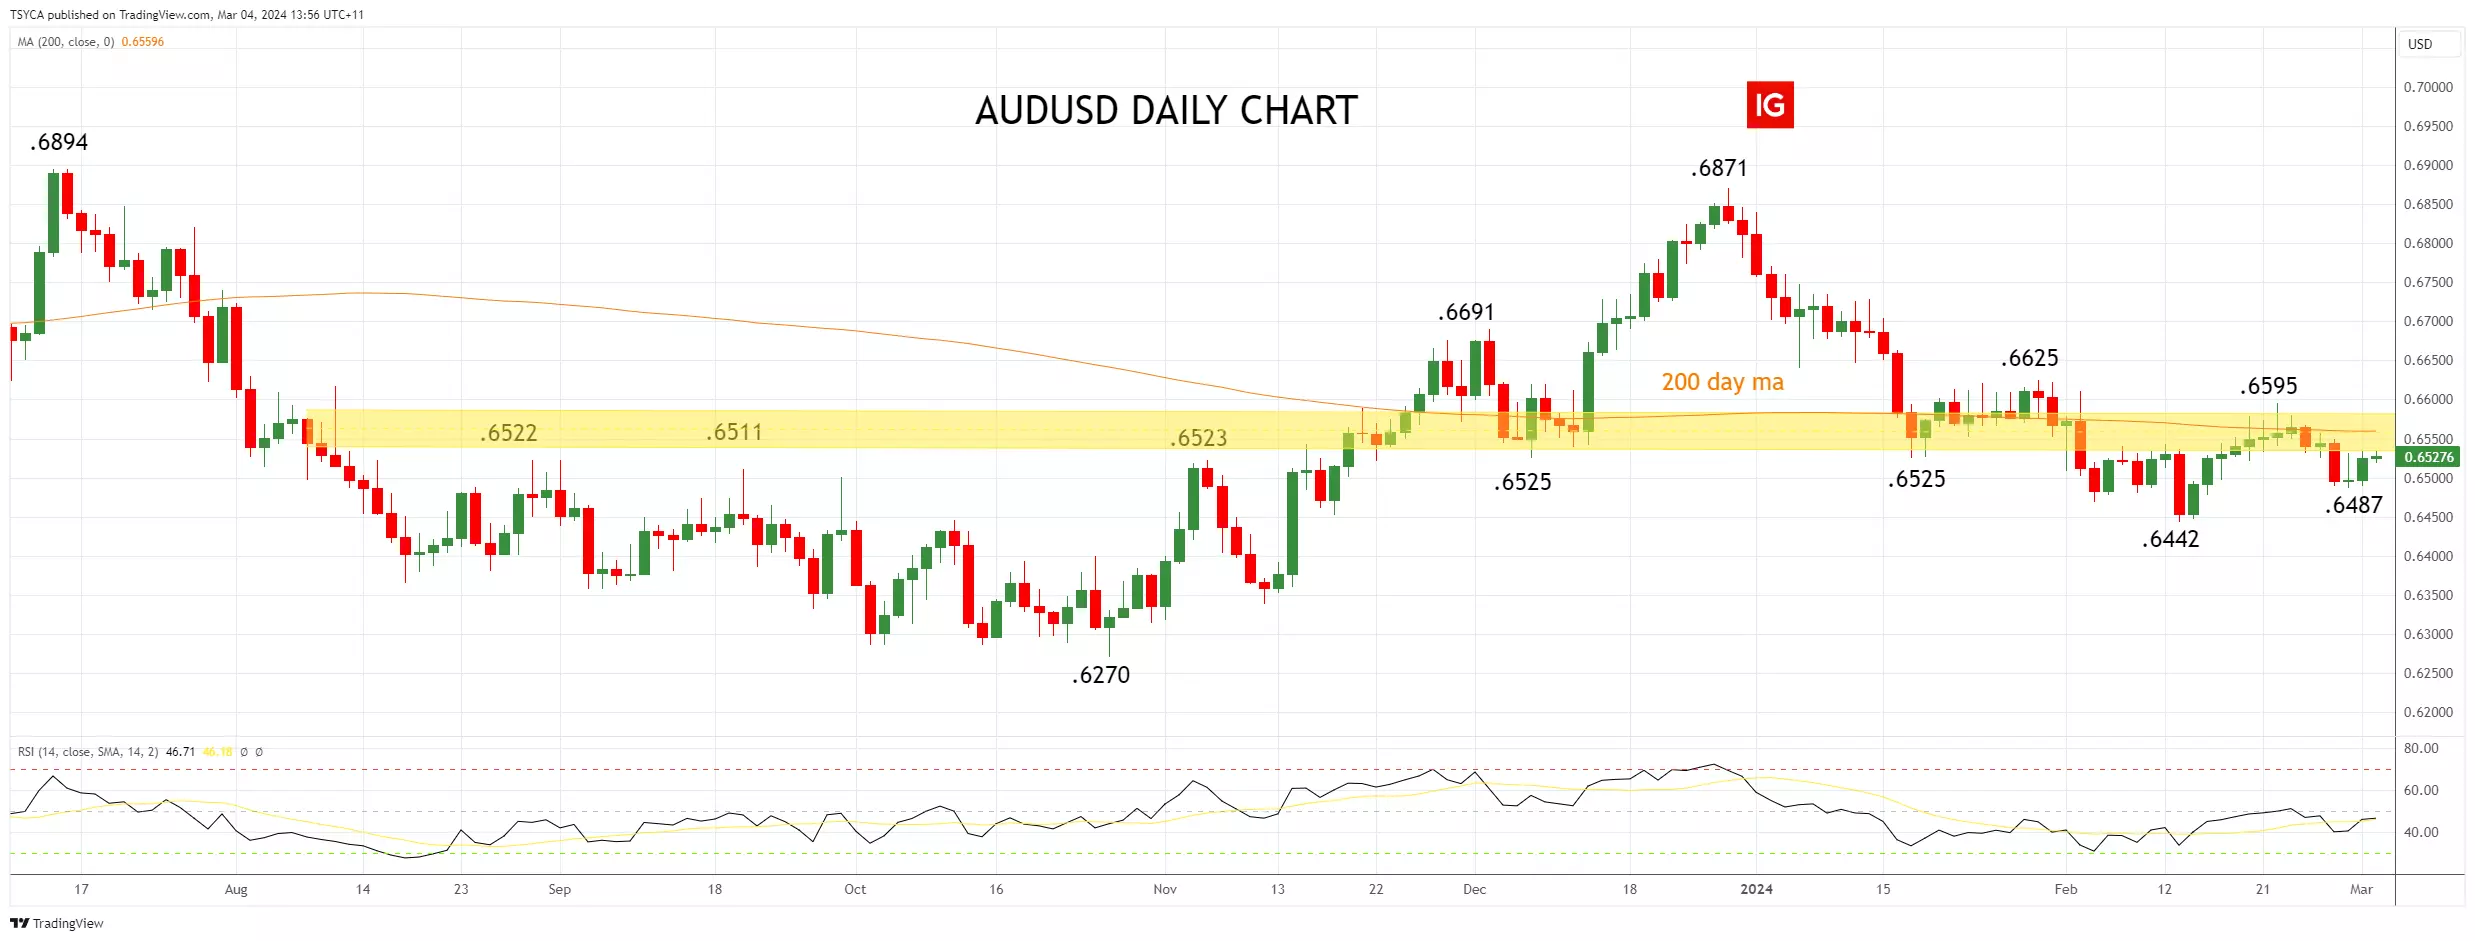
In last week's article, we noted that the AUD/USD had struggled to overcome resistance coming from the 200-day moving average currently at .6560 and said
“The longer it spends lingering under the 200-day moving average, the more chance there is of a retest of the mid-February .6442 low with scope towards weekly support near .6310.”
The scenario above remains our base case, aware that the AUD/USD needs to see a sustained move above the 200-day moving average at .6560 and then above the mid-January .6625 high to negate downside risks and warn that a more robust recovery is underway.
AUD/USD daily chart
 Source: TradingView
- Source:Tradingview. The figures stated are as of 4 March 2024. Past performance is not a reliable indicator of future performance. This report does not contain and is not to be taken as containing any financial product advice or financial product recommendation.
This information has been prepared by IG, a trading name of IG Australia Pty Ltd. In addition to the disclaimer below, the material on this page does not contain a record of our trading prices, or an offer of, or solicitation for, a transaction in any financial instrument. IG accepts no responsibility for any use that may be made of these comments and for any consequences that result. No representation or warranty is given as to the accuracy or completeness of this information. Consequently any person acting on it does so entirely at their own risk. Any research provided does not have regard to the specific investment objectives, financial situation and needs of any specific person who may receive it. It has not been prepared in accordance with legal requirements designed to promote the independence of investment research and as such is considered to be a marketing communication. Although we are not specifically constrained from dealing ahead of our recommendations we do not seek to take advantage of them before they are provided to our clients.
-
Global markets have kicked off the week on a largely positive note ahead of major central bank meetings and data releases that will impact rate hike expectations. Japan's Nikkei index moved on past 40,000, having enjoyed a strong rally so far this year, buoyed by tech and AI stocks like Tokyo Electron. The Nikkei has benefitted from a shift towards tech nearshoring as foreign funds leave Chinese markets. Japanese Tokyo inflation data on Tuesday will test whether price rises are slowing as expected after base effects. Markets expect the Bank of Japan to end negative rates and yield curve control in April given strong wage growth. Japan may also declare an end to deflation this week, further supporting policy tightening. Upbeat Q4 GDP data suggests Japan may have avoided recession after all. China's National People's Congress this week could unveil new stimulus measures and set a 5% 2022 GDP target. Attention will turn to Fed Chair Powell's Congressional testimony midweek for any fresh rate hike signals. Friday's US jobs report could also shift expectations if hiring remains robust in February after January's strong gains.
-
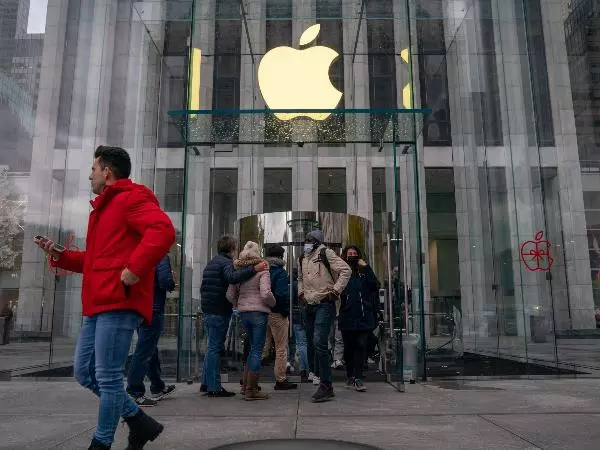
Apple’s recent stock weakness marks a divergence with other members of the Magnificent 7 and the broader Nasdaq 100.
 Source: Bloomberg
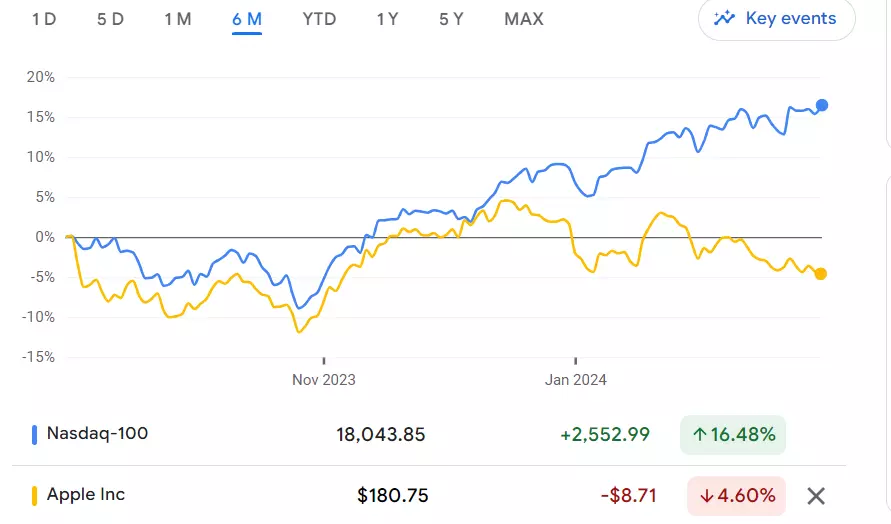 Source: Google Finance
The decline comes as doubts loom about Apple's artificial intelligence (AI) initiatives. Rivals like Microsoft are delivering strong earnings growth tied to burgeoning AI technology. This was highlighted by Tuesday's report that Apple is discontinuing its decade-long electric vehicle project. Back in 2017, Apple CEO Tim Cook called the autonomous car endeavour the "mother of all AI projects."
Stock Underperforms Broader Market
So far in 2024, Apple shares have dropped 3%, trailing the S&P 500's 7% gain and the Nasdaq's 9% climb. Despite its long-term market-beating returns, Apple has recently lagged the S&P 500 on 6-month, 1-year, and 2-year timeframes, according to FactSet data.
After spending most of 2021 to 2023 as the world's most valuable public company by market capitalization, Apple surrendered that crown to Microsoft in January. Microsoft's sales and profit growth have far outpaced Apple's, which posted negative growth in its 2022 fiscal year ending last September.
AI Investment Hints but Details Lacking
At Wednesday's shareholder meeting, Cook suggested Apple is "investing significantly" in generative AI. He said more specifics will be announced later this year. UBS analyst David Vogt predicts Apple's first major AI launch will come in June at its annual Worldwide Developers Conference.
iPhone Sales Weakness Looms
In addition to AI uncertainties, expectations for weak iPhone sales growth continue to weigh on Apple. iPhones accounted for 58% of Apple's total revenue last quarter.
Some See Positives in Car Project Halt
Some analysts see a silver lining in the halt of Apple's electric car plans. It enables the company to refocus AI talent on nearer-term products with greater market potential. To Morgan Stanley, it also shows Apple's "cost discipline."
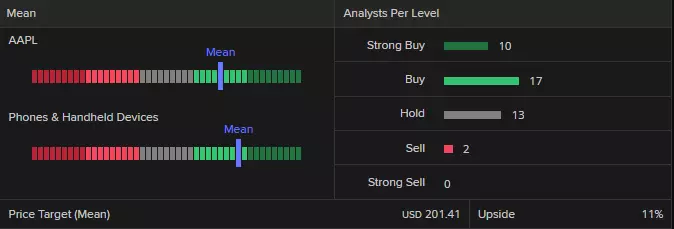
Apple analyst rating
LSEG (formerly known as Refinitiv) data shows a consensus analyst rating of ‘buy’ for Apple with 10 strong buy, 17 buy, 13 hold and 2 sell – and a mean of estimates suggesting a long-term price target of $201.41 for the share, roughly 16% higher than the current price (as of 1 March 2024).
 Source: LSEG
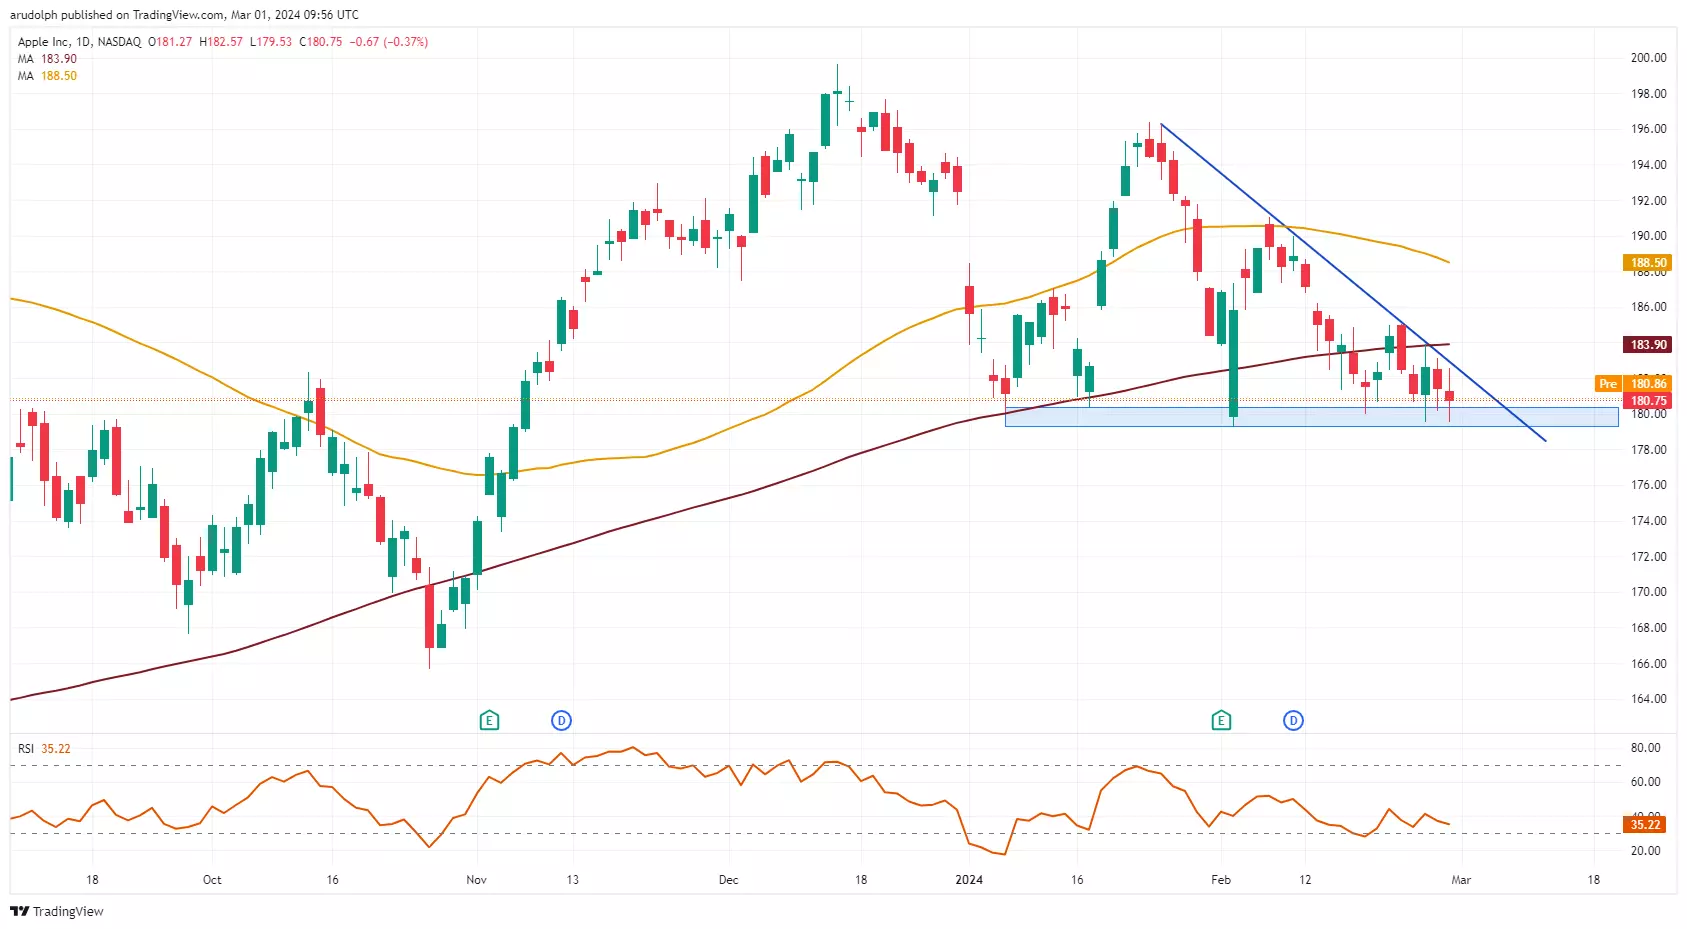
Technical outlook on the Apple share price
The Apple share price continues to precariously weigh on its $180.30 to $179.25 support zone which consists of the January-to-February lows.
A fall through and daily chart close below this area looks increasingly likely and would lead to levels being reached which were last traded in early-November with the 3 November low at $176.65 representing the first downside target.
Apple Daily Candlestick Chart
 Source: TradingView
Further down sits the $174.49 August low below which key support can be spotted between the September and October lows at $167.62 to $165.67.
Were the $180.30 to $179.25 support zone to hold, though, a rise and daily chart close above last week’s high at $185.04 would need to occur, for a recovery off the support area to gain traction. In this scenario the Apple share price would trade back above its 200-day simple moving average (SMA) at $183.90 and target the 55-day SMA at $188.50.
This will continue to favour a fall through support at $179.25 to take place as long as the Apple share price continues to trade below last week’s high at $185.04.
This information has been prepared by IG, a trading name of IG Markets Limited. In addition to the disclaimer below, the material on this page does not contain a record of our trading prices, or an offer of, or solicitation for, a transaction in any financial instrument. IG accepts no responsibility for any use that may be made of these comments and for any consequences that result. No representation or warranty is given as to the accuracy or completeness of this information. Consequently any person acting on it does so entirely at their own risk. Any research provided does not have regard to the specific investment objectives, financial situation and needs of any specific person who may receive it. It has not been prepared in accordance with legal requirements designed to promote the independence of investment research and as such is considered to be a marketing communication. Although we are not specifically constrained from dealing ahead of our recommendations we do not seek to take advantage of them before they are provided to our clients. See full non-independent research disclaimer and quarterly summary.
-
The new month kicked off with several stock market indices hitting record highs on Thursday. Japan's Nikkei Average, the S&P 500, and the Nasdaq all closed at fresh record peaks. The gains were buoyed by tech stocks like NVIDIA and Advanced Micro Devices. Stock markets are in an upbeat mood after US inflation figures came in line with expectations on Thursday. This helped shape forecasts for the timing of future Fed interest rate cuts. It extended the ongoing global equity rally and also pushed Treasury yields lower. The DAX also reached a new all-time high on Thursday. Europe opens today waiting for inflation data that should indicate inflation is moving back toward the 2% target. This comes after data showed inflation dropping in countries like Germany, France and Spain thanks to lower energy and food prices. The ECB has maintained record-high interest rates since September. Also on the calendar today is the US ISM manufacturing PMI.
-
Dow and Nasdaq 100 ease back while Hang Seng bounce hits a wall
US indices continue to tiptoe lower after last week’s highs, while the Hang Seng’s bounce from the January lows is coming under pressure.
 Source: Bloomberg
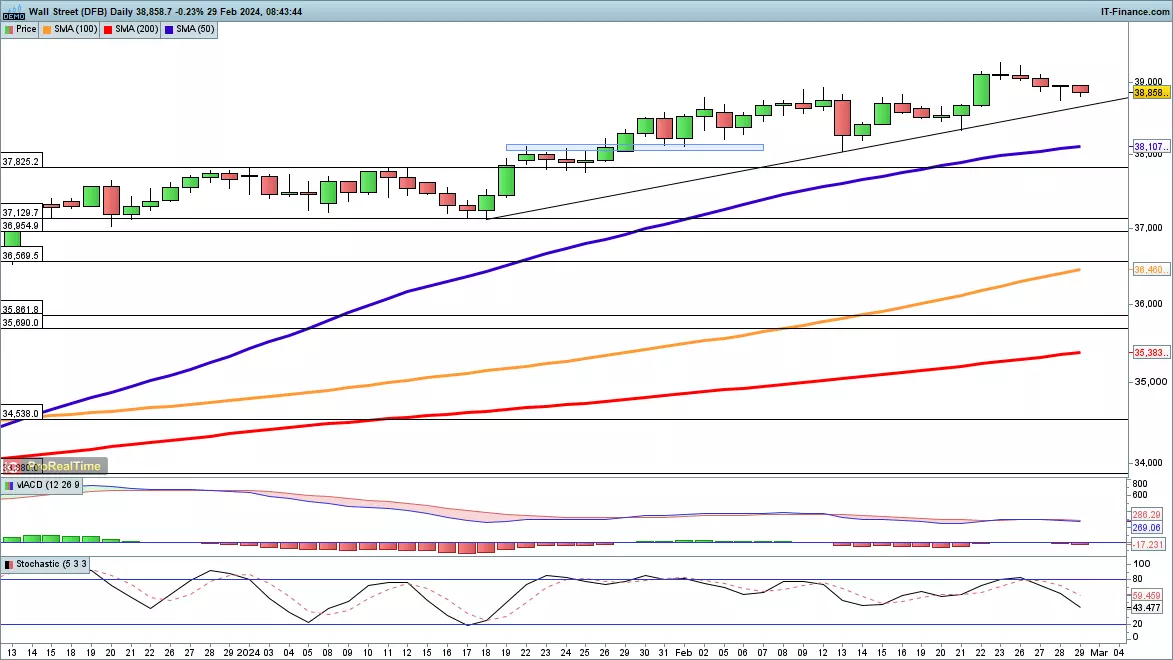
Dow drifts down
The index continues to edge lower, surrendering some of yesterday’s recovery from the lows. In the short-term, we may finally see a test of the still-rising 50-day simple moving average, something that has not happened since the rally began in October. Before this the price may find support at the rising trendline from mid-January. Should this see a bounce develop, then the previous highs at 39,287 come into play, and could clear the way for a test of 40,000.
 Source: ProRealTime
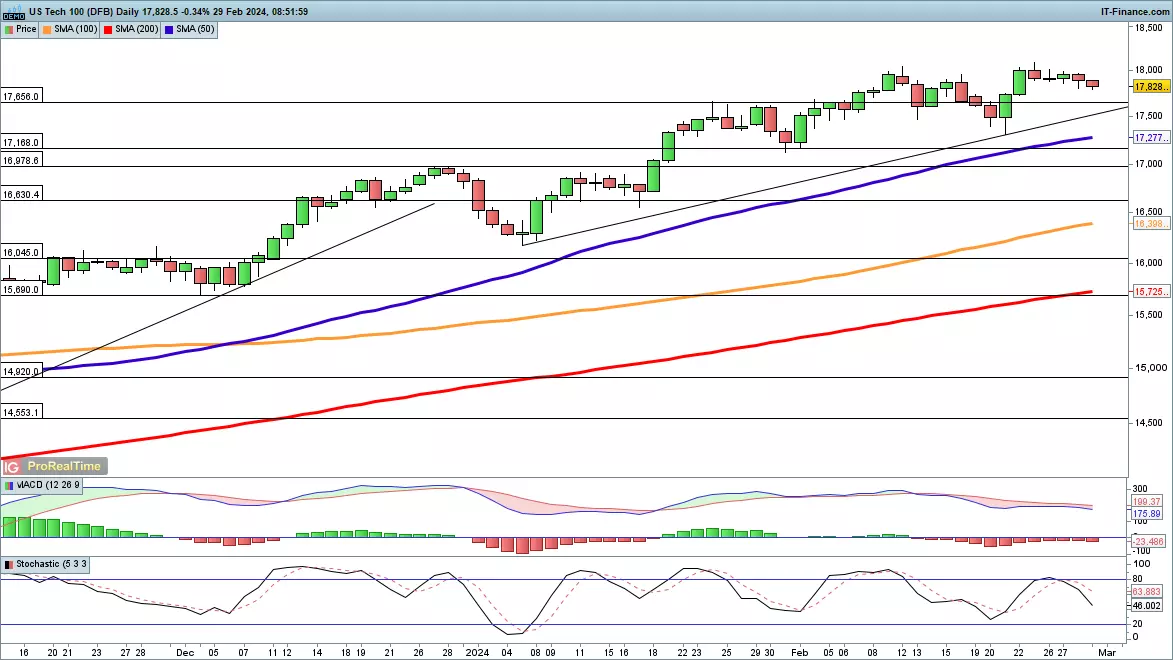
Nasdaq 100 edges down to trendline support
Like the Dow, the Nasdaq 100 is easing back from its recent highs, though the declines here are even more muted. Potential trendline support from early January comes into play near 17,600, while below this is the 50-day SMA and last week’s low at 17,320.
 Source: ProRealTime
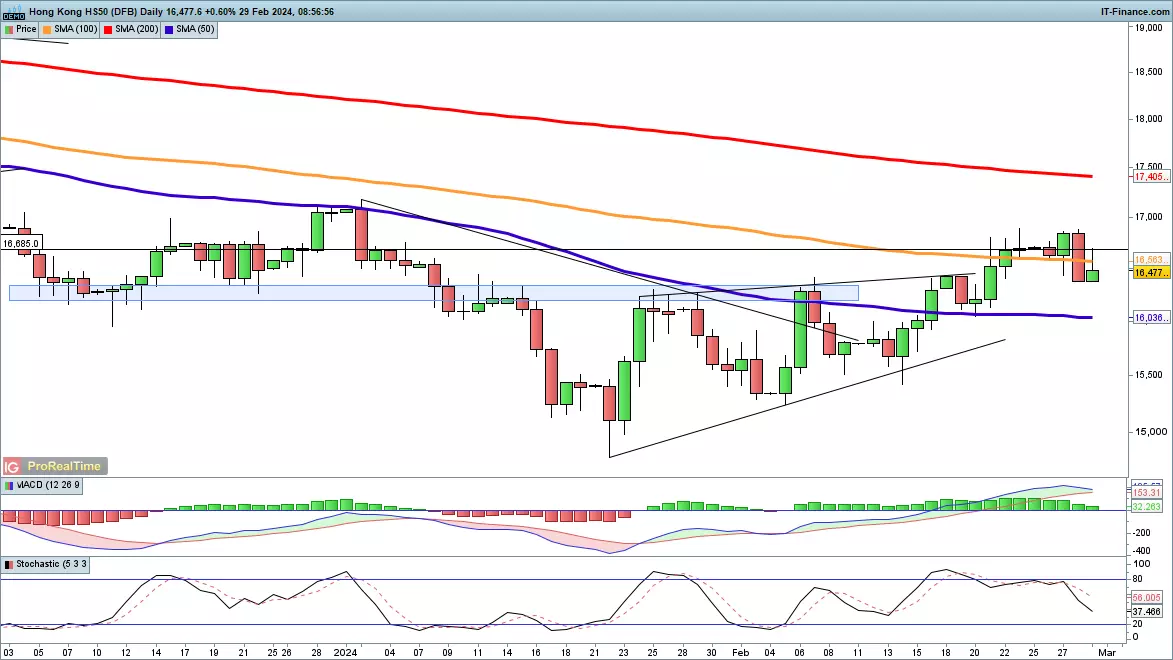
Hang Seng under pressure as rally fades
Those waiting for a fresh leg lower in this index’s ongoing downtrend will have been pleased to see the sharp drop on Wednesday that culminated at a close almost at the lows and back below the 100-day SMA. Further losses below last week’s low at 16,065 would reinforce the bearish view and suggest that the downtrend is back in play, targeting the lows of January at 14,755. Bulls will want to see a close back above 16,900 to indicate that the index is continuing its counter-trend bounce.
 Source: ProRealTime
-
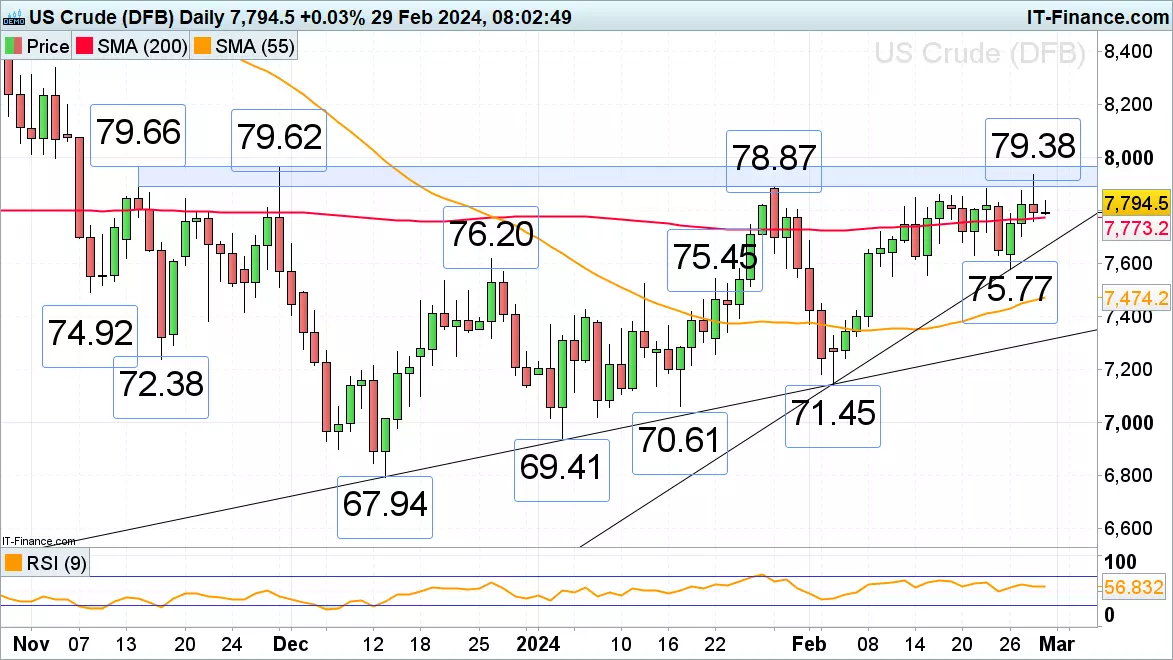
WTI slips on large US stock build while silver price falls and Chicago wheat stays range bound
 Source: Bloomberg
WTI declines on large US stock build
Front month WTI futures have once again been rejected by their mid-November to February 78.87 to 79.62 resistance zone amid a large US stock build. The oil price slid back to the 200-day simple moving average (SMA) at 77.73 around which it is expected to oscillate over the coming days. While this week’s low at 75.77 underpins, the medium-term uptrend will remain intact, though. Minor support ahead of this level sits at the 21 February 76.31 low.
 Source: ProRealTime
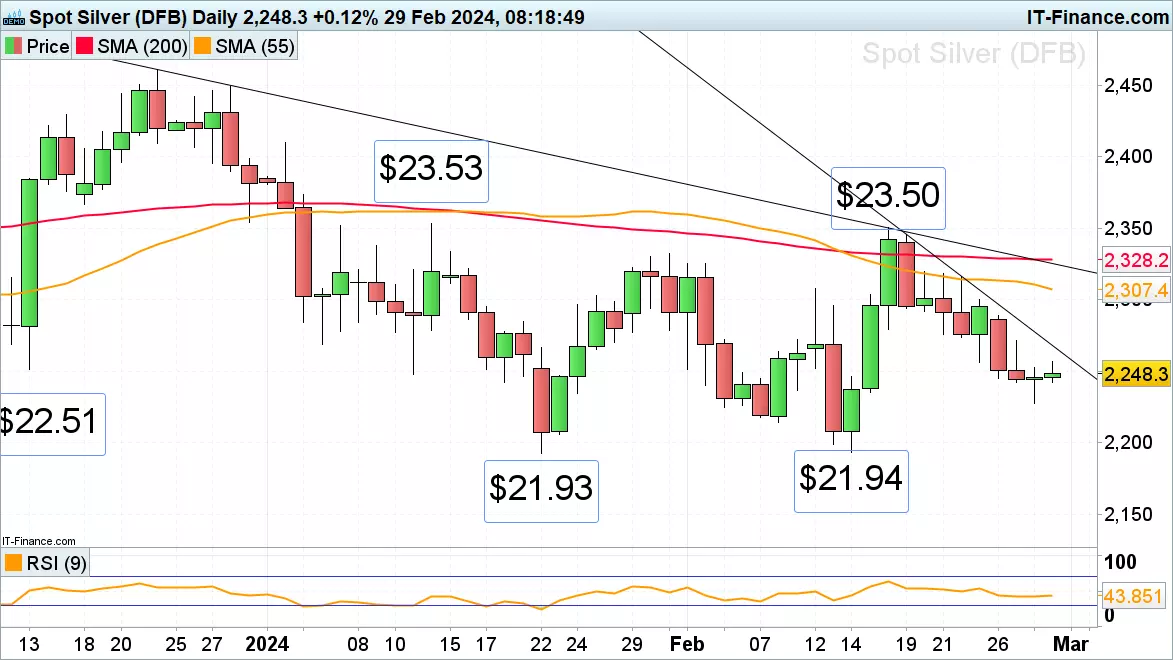
Silver price remains under pressure
Spot silver’s descent from its $23.50 per troy ounce February peak is taking it back to its January and February lows at $21.94 to $21.93. On the way down lies the 8 February low at $22.15. Minor resistance above the February downtrend line at $22.67 sits at the 4 January low at $22.69.
 Source: ProRealTime
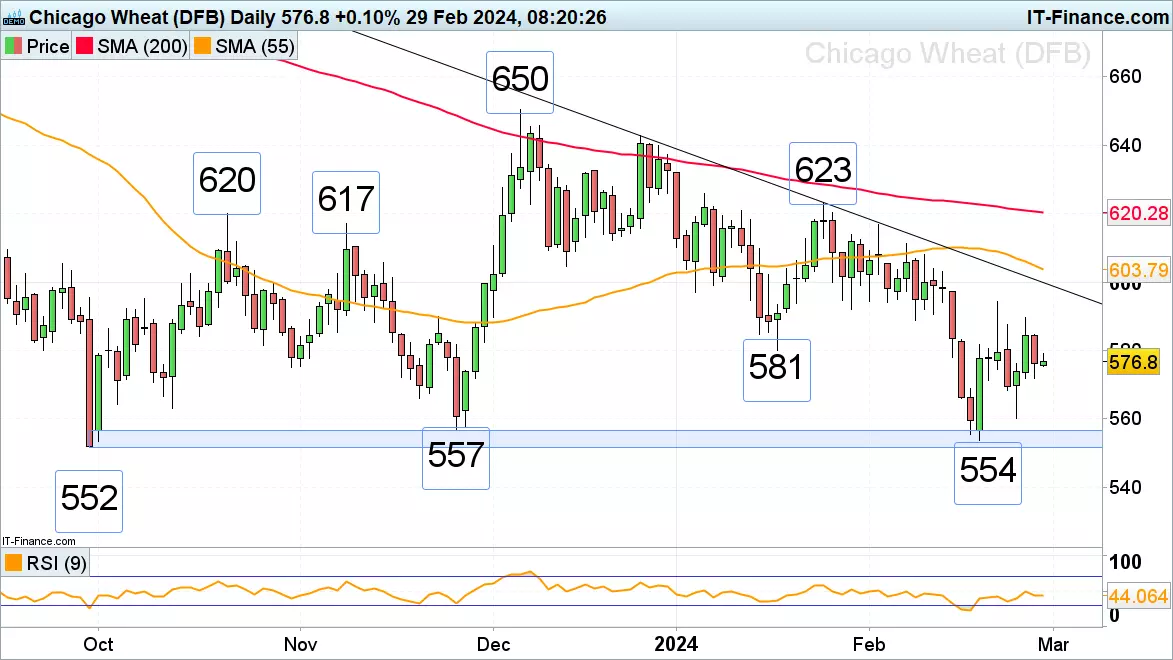
Chicago Wheat prices still hover above major support
Chicago wheat front month futures continue to hold above their key 557 to 552 September and November lows which offered support in February. Further sideways trading above this key support zone and below last week’s 594 high remains at hand. Above it the December-to-February downtrend line can be spotted at 600. Support above the 557 to 552 area lies at last week’s 561 low.
 Source: ProRealTime
-
The US dollar and US indices steadied after a generally positive session in Asia ahead of today's widely anticipated US PCE inflation reading - the Fed's preferred inflation gauge - and as a partial US government shutdown has been averted. Speeches by Fed members Bostic and Mester might provide further colour but will probably have less of an impact. The Japanese Yen got a boost from the BoJ's Takata who hinted at stronger wage growth this year and that the central bank's price target was 'coming into sight.' Other than that the data in Japan was mixed with industrial production coming in worse than expectations but retail sales beating forecasts. German CPI for February and a speech by Bundesbank President Nagel will probably determine whether the DAX 40 will make yet another record high or flatten out like its peers.
-

IG Morning Call
in General Trading Strategy Discussion
Posted
Asian stocks continued their upward momentum on Tuesday, reaching seven-month highs. Many traders were awaiting key US inflation data due later in the day for further direction. Currency markets were largely subdued in Asian hours, except for the Japanese yen which has firmed over the past week on speculation the Bank of Japan could exit negative rates. However, BOJ Governor Ueda struck a cautious tone, saying the economy showed signs of weakness despite recovering. European bourses were poised for a strong open. The US inflation report is the main macro focus, with expectations for a 0.4% monthly rise in the headline CPI and a 3.1% annual rate. Core inflation was seen rising 0.3% to a 3.7% annual pace. In the UK the unemployment rate rose to 3.9% in January, while wage growth in the three months to January slowed to 5.6%.