

MongiIG
-
Posts
9,886 -
Joined
-
Last visited
-
Days Won
41
Content Type
Profiles
Forums
Blogs
Events
Community Tutorials
Store
Posts posted by MongiIG
-
-
1 hour ago, Muhaammaadd said:
Hello Guys.
I am Muhammad and I am totally new in the IG community. I would like to make effective use of this space and be impactful or at the very least be useful to the community. But to do this will require you guys help with heads up. I believe since it will be a fruitful avenue to share experience with newbies and we will all learn from your personal experiences. Please don't hesitate to put something down, i will definitely benefit from your insight!!!
thanks guys
Hi @Muhaammaadd
Welcome to the IG Community! Looking forward to your insightful posts and engagement with other members.
All the best - MongiIG
-
Despite the People's Bank of China (PBoC) cutting its five-year loan prime rate (LPR) by 25bps to 3.95% instead of the expected 15bps Chinese stocks remained under pressure. This even though the cut represented the first rate reduction since June 2023 and the largest since that rate was introduced in 2019. The Reserve Bank of Australia (RBA) minutes of its February monetary minutes which showed that it was appropriate not to rule out another rate hike, had little impact on the Australian dollar. Following Monday's US holiday European stocks hover near their recent multi-year highs amid a light economic calendar.

-
Rolls-Royce on track for significantly improved operating profits.
 Source: Bloomberg
Rolls-Royce on track for significantly improved operating profits.
British engine maker Rolls-Royce is on track to deliver significantly improved operating profits in the second half of 2022, according to forecasts.
The company's major business units are all expected to contribute to the better performance, led by a recovery in commercial aerospace and defence work.
Rolls-Royce's operating profit for the second half of the year will likely come in around £830 million, a major increase from £527 million in the second half of 2021. The gains are being driven primarily by the company's civil aviation segment, where wide-body flying activity has rebounded robustly.
Within civil aviation, Rolls-Royce is forecasting original equipment revenue to climb approximately 7% to £1.4 billion in the second half. More importantly, higher-margin aftermarket service revenue is projected to jump 16% to £2.4 billion. The company is also benefiting from increased business jet engine deliveries.
The defence unit is poised to see its operating profit hit £298 million, as military spending ramps up in Europe and the Middle East amid the conflict in Ukraine. Rolls-Royce is well-positioned to capitalise on demand for defence services, which offer superior margins.
Meanwhile, the power systems division is likely to post a 31% increase in operating profit to £213 million. Growth is expected to be powered by strong gains in aftermarket activity.
Across its major business units, Rolls-Royce is demonstrating an ability to translate increased demand, particularly for high-value aftermarket work, into significantly better profitability. The second half rebound solidifies a recovery story for the company after a turbulent period marked by the pandemic's impact on commercial aerospace.
With its outlook brightening, Rolls-Royce appears on course to continue rebuilding its balance sheet and financial performance. Investors are likely to cheer the better-than-expected profits as a sign of the company's progress in executing its turnaround strategy.
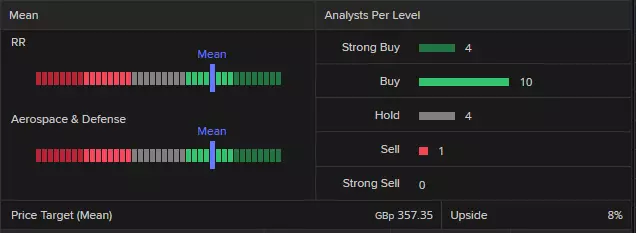
Analyst ratings for Rolls Royce
Refinitiv data shows a consensus analyst rating of ‘buy’ for Rolls Royce with 4 strong buy, 10 buy, 4 hold and 1 sell – and a mean of estimates suggesting a long-term price target of 357.35 pence for the share, roughly 8% higher than the current price (as of 19 February 2024).
 Source: Refinitiv
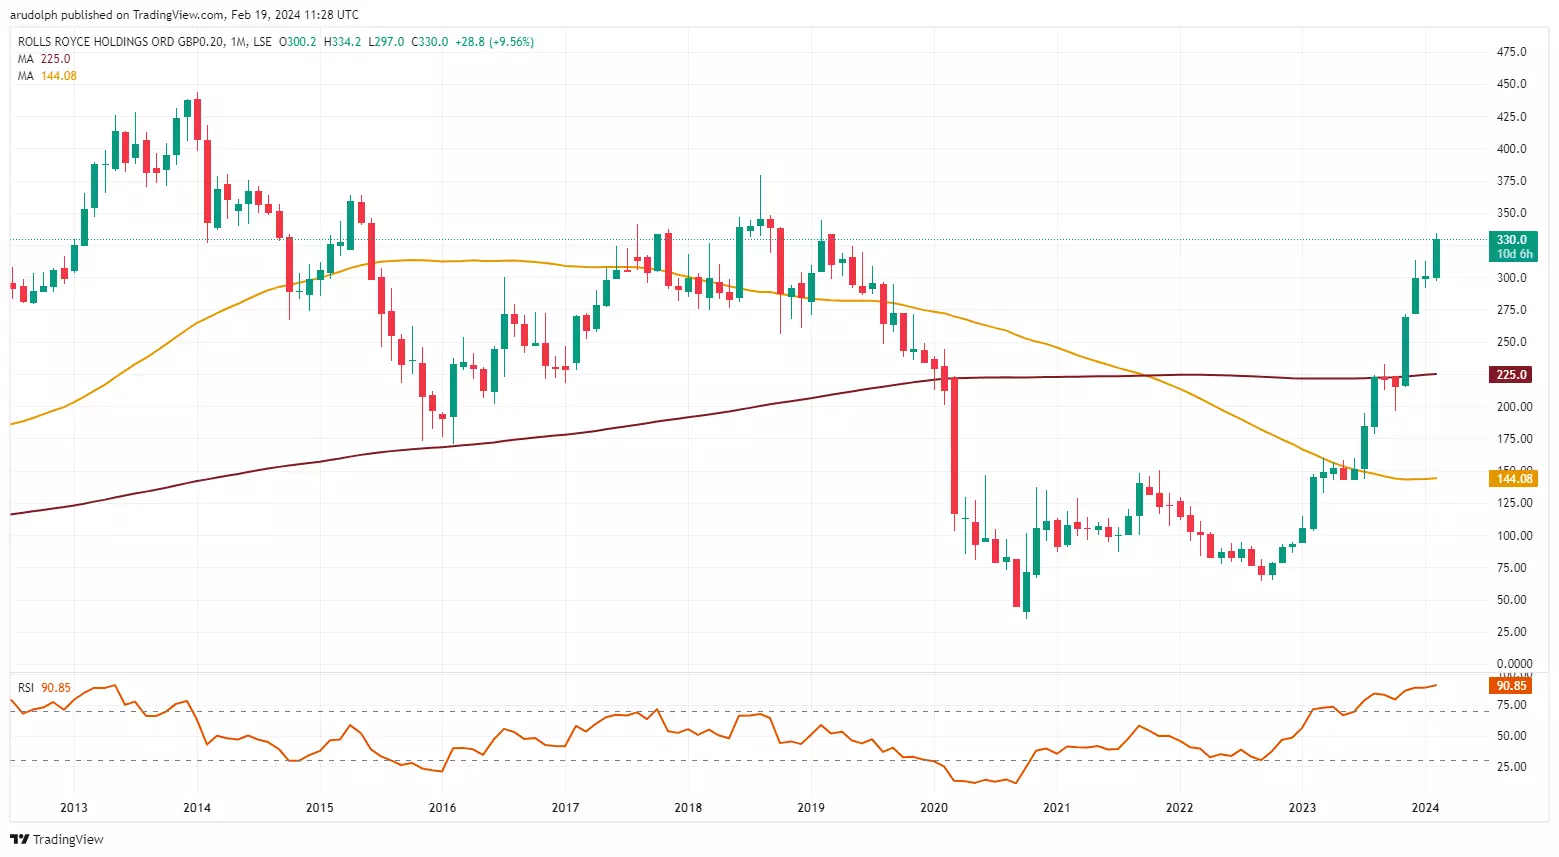
Technical analysis of the Rolls Royce share price
Rolls Royce’s share price remains on track for its August 2018 peak at 379.0p, judging by the swift near 385% ascent it has seen from its October 2022 low.
The British multinational aerospace and defence company’s share price is now grappling with its August 1997 and February 2019 peaks at 341.3p to 344.4p which may short-term, act as resistance.
Rolls Royce Monthly Candlestick Chart
 Source: TradingView
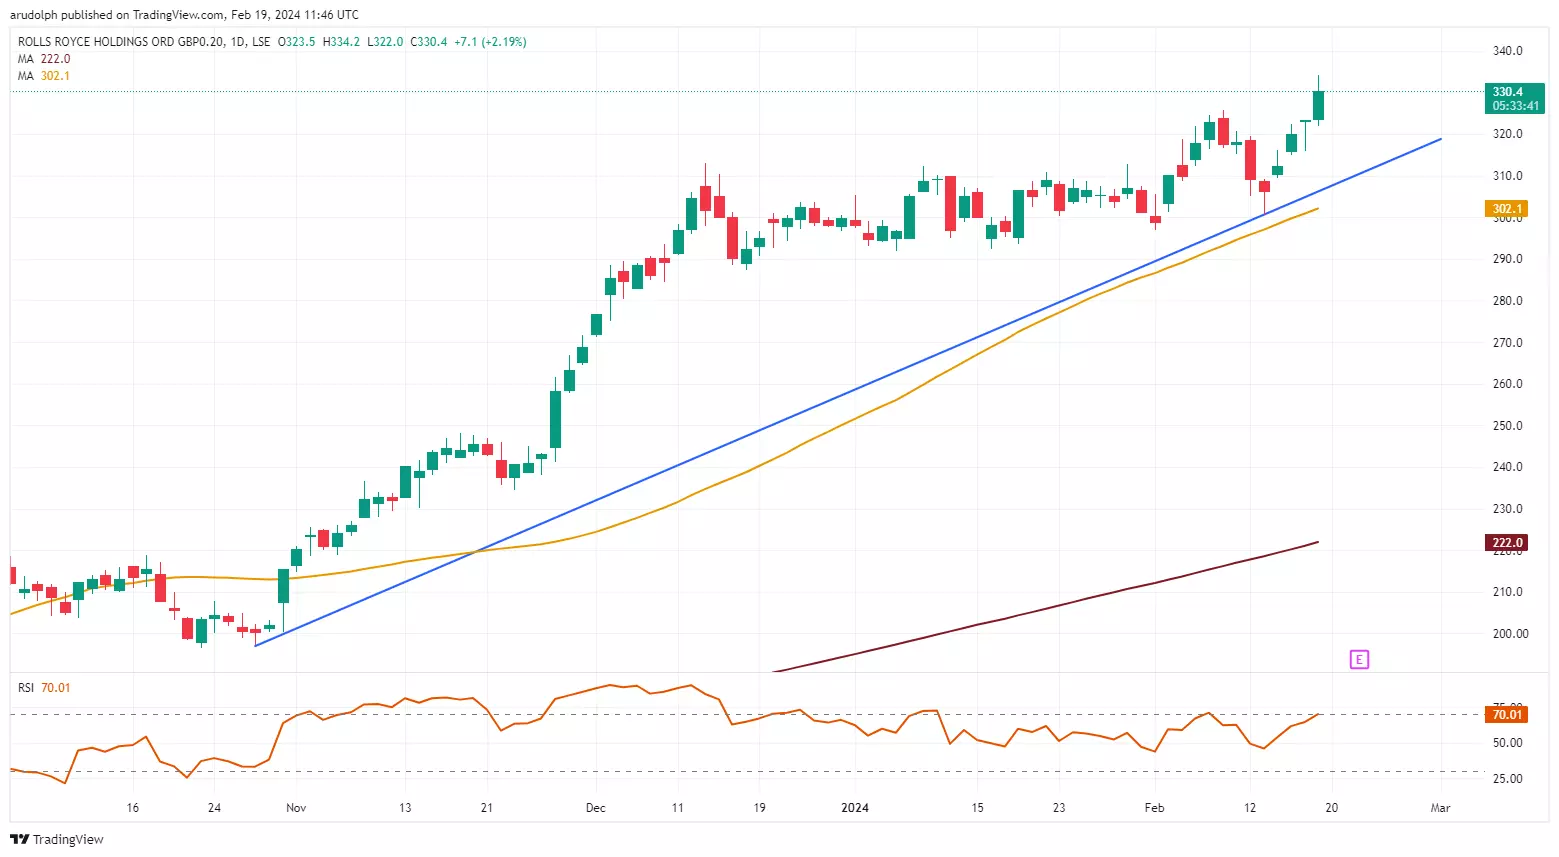
On the daily chart the Rolls Royce share price, which has risen by more than 10% year-to-date, continues to break through resistance and thus advance.
Rolls Royce Daily Candlestick Chart
 Source: TradingView
Monday’s rise above the 8 February high at 325.7p is another stepping stone towards the August 2018 high at 379.0p.
While the October-to-February uptrend line at 306.3p underpins, the medium-term uptrend will remain intact.
For long-term bullish momentum to be maintained, the Rolls Royce share price should ideally remain above its mid-December low at 287.3p.
This information has been prepared by IG, a trading name of IG Markets Limited. In addition to the disclaimer below, the material on this page does not contain a record of our trading prices, or an offer of, or solicitation for, a transaction in any financial instrument. IG accepts no responsibility for any use that may be made of these comments and for any consequences that result. No representation or warranty is given as to the accuracy or completeness of this information. Consequently any person acting on it does so entirely at their own risk. Any research provided does not have regard to the specific investment objectives, financial situation and needs of any specific person who may receive it. It has not been prepared in accordance with legal requirements designed to promote the independence of investment research and as such is considered to be a marketing communication. Although we are not specifically constrained from dealing ahead of our recommendations we do not seek to take advantage of them before they are provided to our clients. See full non-independent research disclaimer and quarterly summary.
-
FTSE 100 probes resistance while DAX and Nikkei consolidate below last week’s highs
Outlook on FTSE 100, DAX 40 and Nikkei 225 as earnings season is coming to an end and US markets are shut for President’s Day.
 Source: Bloomberg
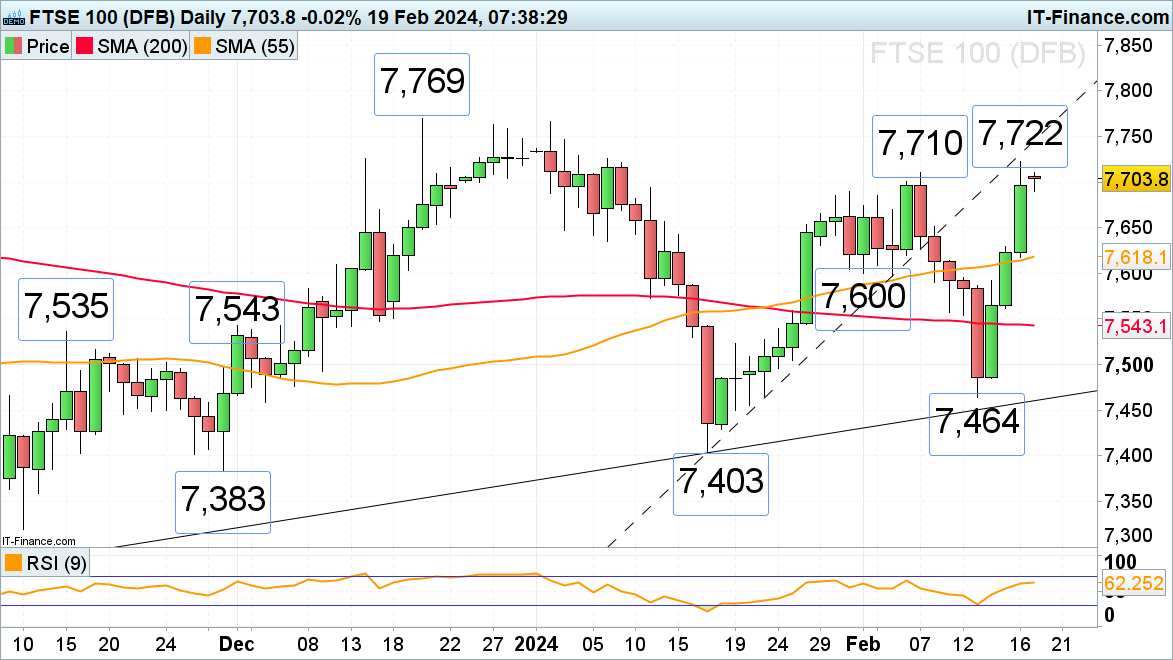
FTSE 100 flirts with resistance zone
The FTSE 100’s swift rally off last week’s 7,464 low amid positive earnings, softer UK inflation and much stronger-than-expected retail sales and despite the country slipping into a technical recession, has taken the index to 7,722, a near six-week high on Friday. This level remains in play on Monday which is likely to be a quiet one as US markets are shut for its President’s day. Minor support below the psychological 7,000 mark is seen along the 55-day simple moving average (SMA) at 7,618.
 Source: ProRealTime
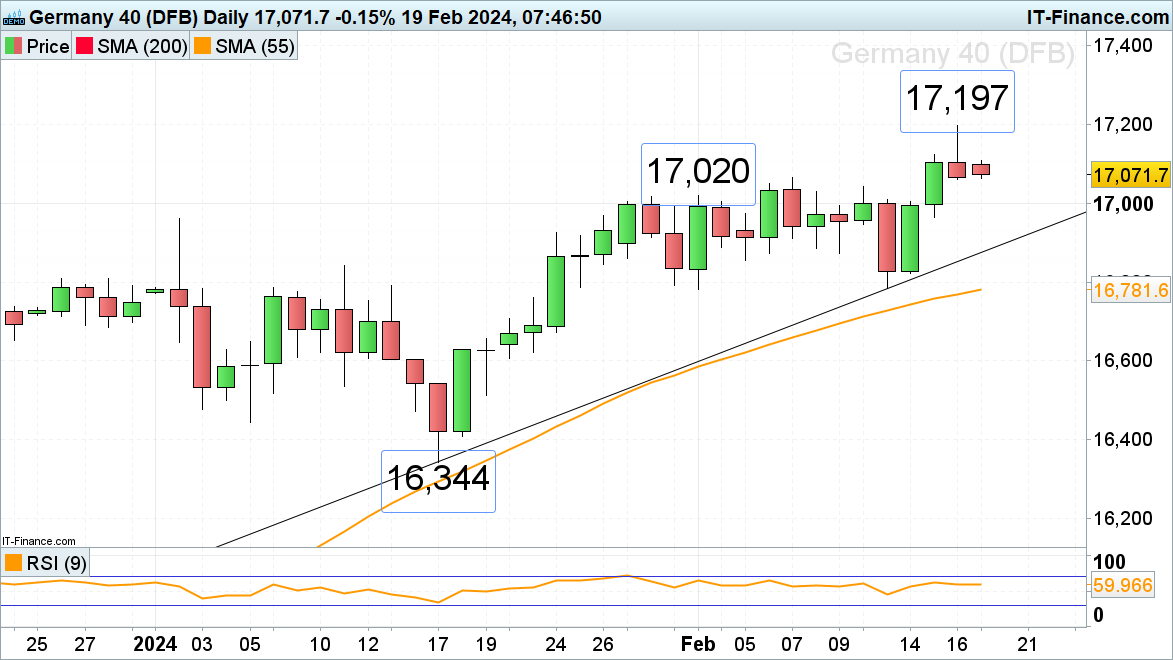
DAX 40 retraces lower from last week’s record high
The DAX 40 index is seen coming off last week’s record high at 17,197 and nears Friday’s 17,060 low. If it were to give way, at least a minor top would be formed with the early February high at 17,020 being back in sight, together with the psychological 17,000 mark. Minor resistance above Monday’s 17,109 intraday high can be found at Thursday’s 17,123 high.
 Source: ProRealTime
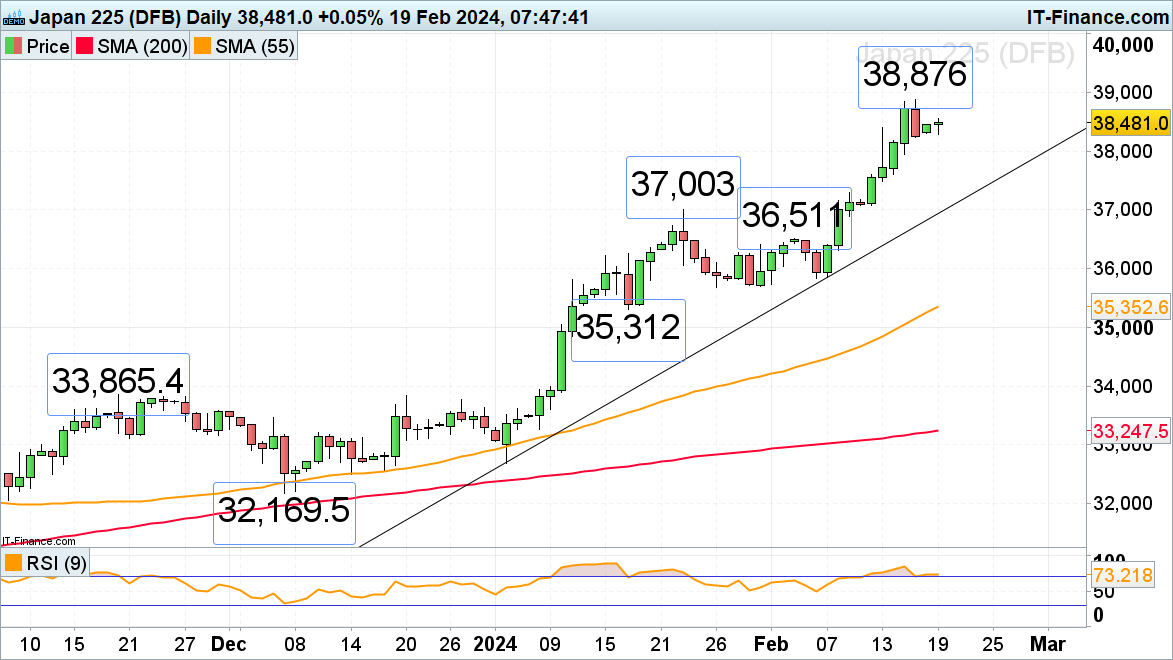
The Nikkei 225 consolidates below its 34-year high
The Nikkei 225’s swift ascent to last week’s 34-year high at 38,876 is taking a breather as the index is short-term consolidating. A rise above 38,876 would put the 1989 all-time record high at 38,957 and also the psychological 40,000 mark on the cards. Slips may find support at Friday’s 38,239 low, a slip through which would put the minor 38,000 mark back on the cards.
 Source: ProRealTime
-
Gold and oil prices still rising but cocoa comes under pressure
While gold and WTI have moved higher in recent sessions, cocoa prices have fallen back from record highs.
 Source: Bloomberg
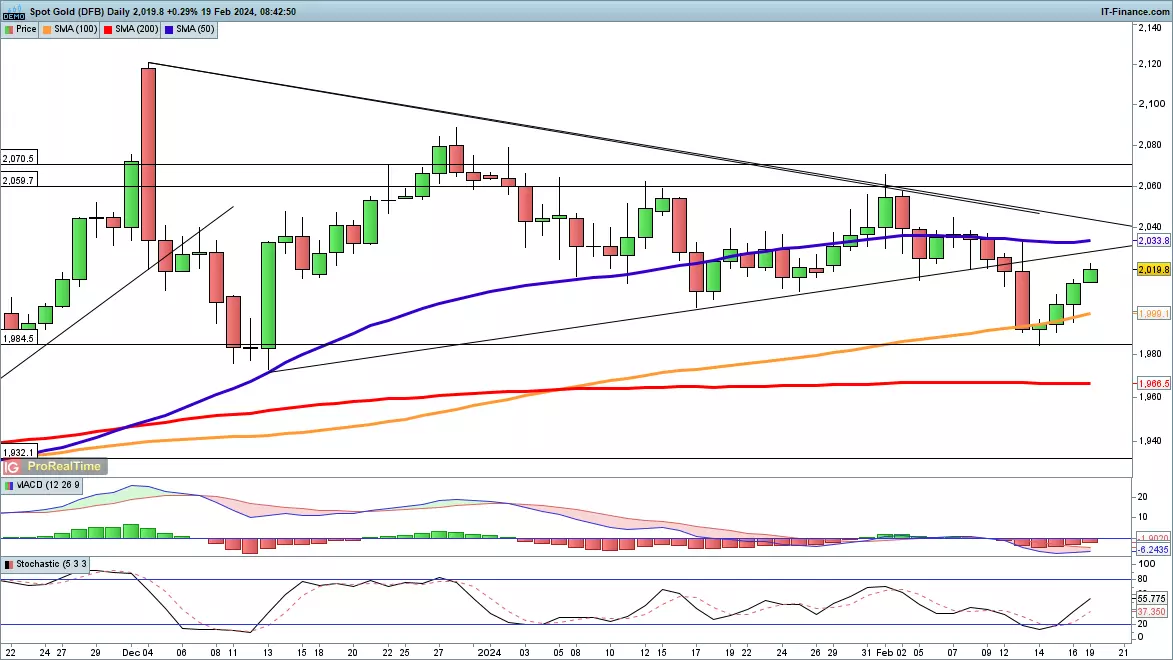
Gold still rising
The price continues to gain, rallying off the lows seen last week, and could now push higher and challenge previously-broken trendline support. Beyond this would like trendline resistance from the early December record high, which held back progress at the beginning of February. From there the price would target horizontal resistance at $2060. A reversal back below the 100-day simple moving average (SMA) might indicate that another test of last week’s low at $1984 was possible.
 Source: ProRealTime
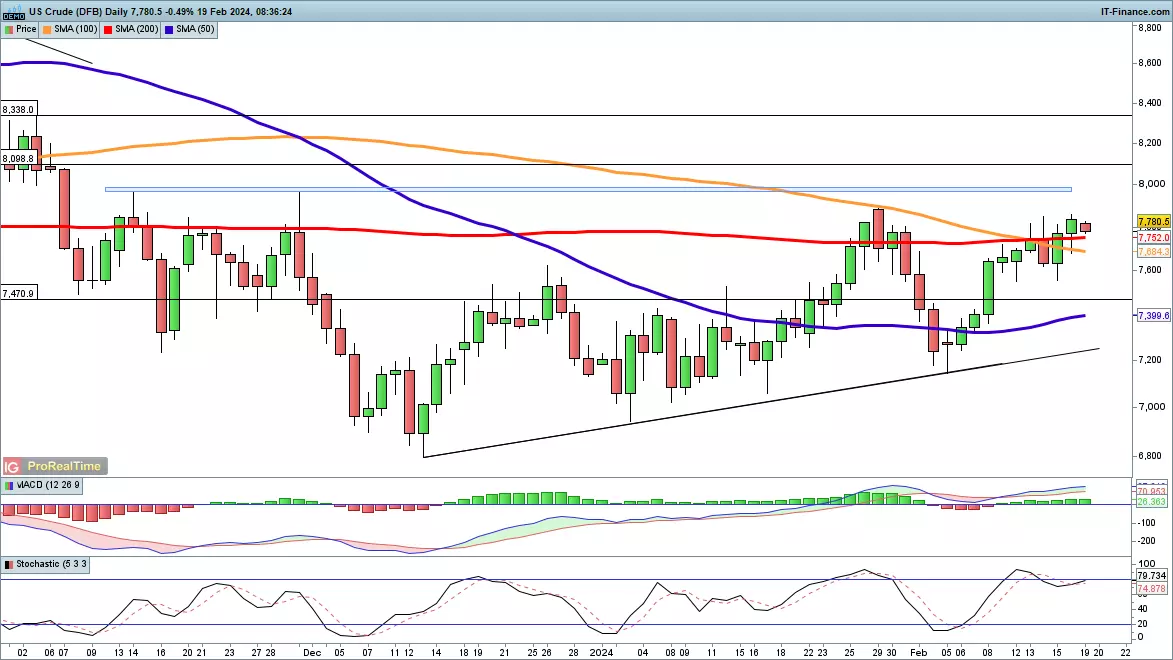
WTI holding above 200-day moving average
Last week saw the price push on and close above the 200-day SMA for the first time in three weeks. Further gains now target the late January high at $78.94, and then on to the $80 high that marked the peak in November. A Overall a short-term bullish view continues to prevail, with the price having created higher highs and higher lows since the December low. With this in mind, a pullback towards trendline support from December could see the price head back below $74 and the 50-day SMA but leave the bullish view intact. A close below $73 might begin to suggest a fresh bearish view, targeting the February low at $71.30.
 Source: ProRealTime
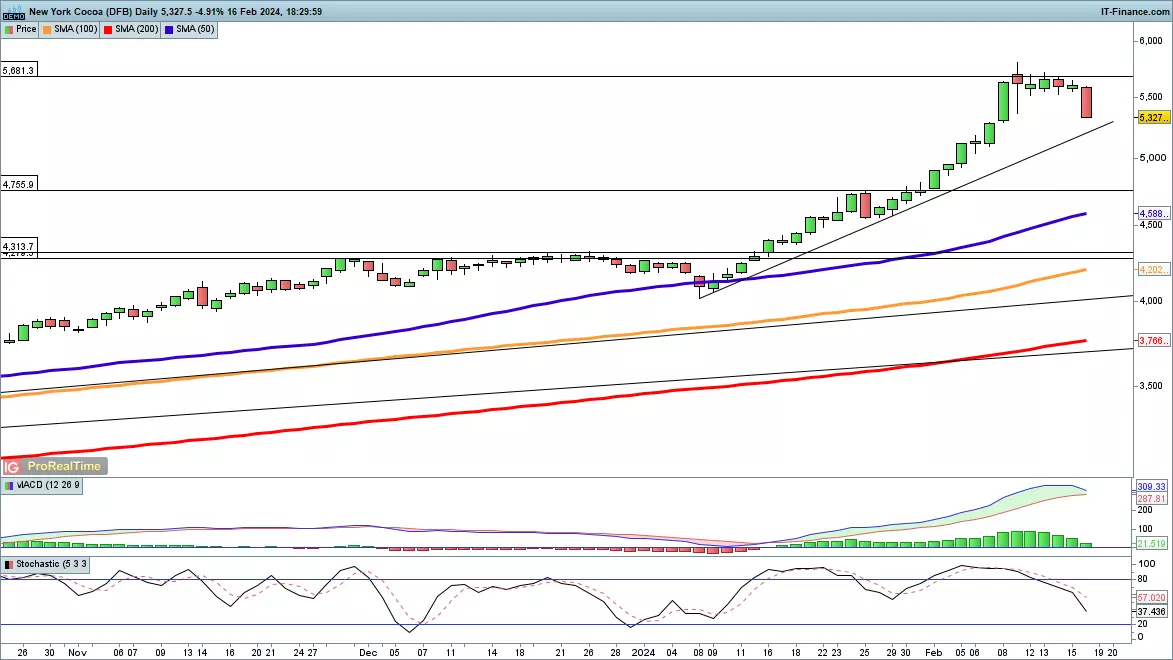
Cocoa prices drop back
Cocoa prices have finally seen a pullback from their record highs, though this only takes them to a one-week low. Short-tern trendline support from the January low comes into view around 5280. A break below this could see the price head back to 4755, or on to the rising 50-day SMA. The solid uptrend seen since the end of 2022 has recently morphed into a more dramatic move higher, though the price could drop back towards 4500 without even beginning to imperil the overall move higher.
 Source: ProRealTime
-
Sentiment amongst retail traders reaches extreme sell territory, while CoT speculators opt to hold on to their heavy buy bias.
 Source: Bloomberg
More disappointing pricing data, and cautious Fed member speak.
Quite a bit to digest late last week, with more disappointing data on the pricing front. PPI (Producer Price Index) for the month of January was hotter than anticipated at 0.9% year-on-year (y/y) headline, with its core up 2%, and anything but controlled growth month-on-month (m/m) with readings of 0.3% and 0.5%, respectively. The preliminary readings out of UoM (University of Michigan) showed consumer inflation expectations up a notch to 3% for the 12-month but held for the five-year at 2.9%, and its consumer sentiment figure rising again, if only slightly this time around, to 79.6. Trade pricing data released the day before that also showed hotter m/m growth, and with retail sales down for the same period by 0.8%, it wasn’t the narrative optimists had hoped for. In Federal Reserve (Fed) member speak, there was Daly advocating patience and three rate cuts this year, and Bostic prior on “returning our policy stance to a more neutral stance in the summer time.”
Large-cap US equity indices were in for a slight retreat, undoing intraweek record highs with tech suffering, while small-cap finished higher. Over in the bond market, Treasury yields finished the week higher, and so too in real terms, breakeven inflation rates creeping up again, and market pricing (CME's FedWatch) closer to fully pricing in a Fed hold next month, via majority holding in May, and looking at the first rate cut in June.
Week ahead: earnings from Nvidia, FOMC minutes, and preliminary PMIs.
As for the week ahead, a light start with a US holiday today, and it’ll remain light until we get minutes out of the latest FOMC (Federal Open Market Committee) meeting on Wednesday. The weekly inventory data out of API and EIA will be pushed out a day to Wednesday and Thursday, respectively. On the latter day is when we’ll also get preliminary PMIs (Purchasing Manager’s Index) where manufacturing and services are expected to remain in expansionary territory even if only just for the former. There will be more housing data, be it the weekly mortgage applications on Wednesday, or existing home sales on Thursday, this after building permits and housing starts released last Friday for the month of January were a clear miss and down on prior readings.
In earnings, there’s Home Depot and retail giant Walmart tomorrow, and the big one on Wednesday with the last of the magnificent seven to report, Nvidia, now the third-largest US company by market capitalization. The implications are far larger for the tech sector, given the investment flows that have been going into tech and AI.
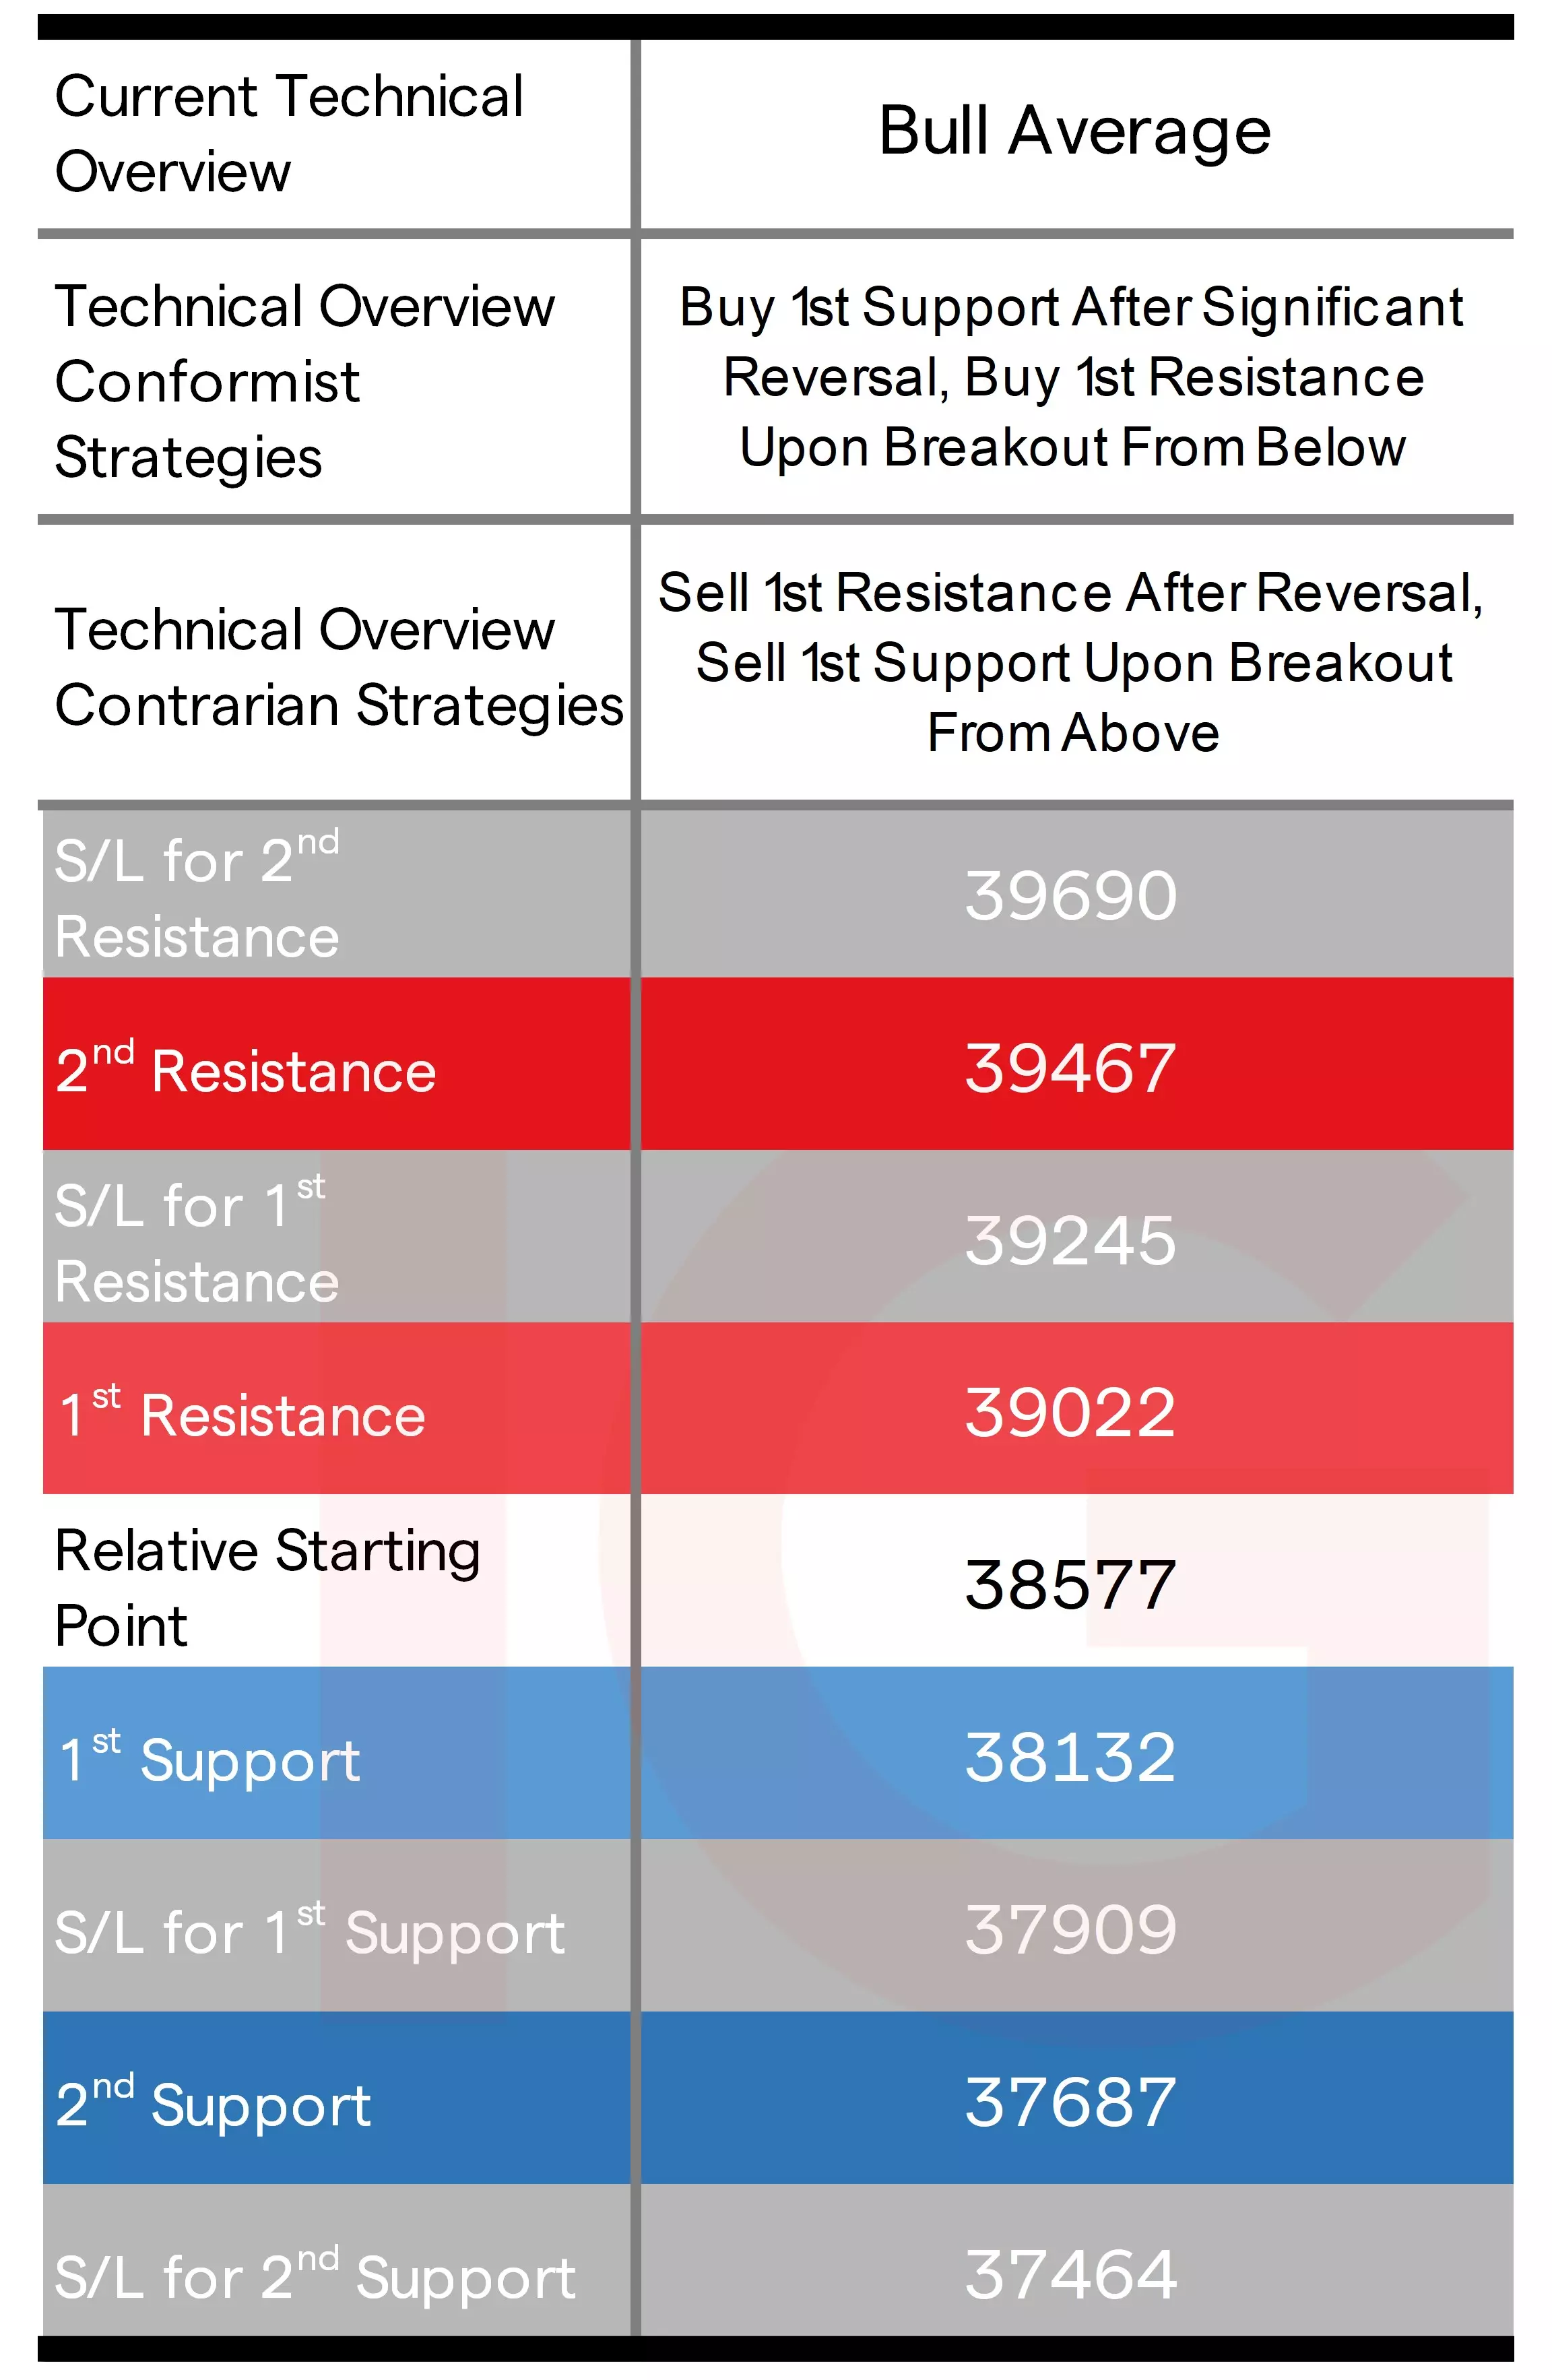
Dow technical analysis, overview, strategies, and levels
Even after last Tuesday's CPI (Consumer Price Index) shock, and its previous weekly 1st Resistance level managed to hold, favoring conformist buy-after-significant reversals, that outperformed on the move back up, with the small weekly change keeping the technical boxes here unchanged and so too its technical overview. As for the daily time frame late last week, going well past Thursday's 1st and 2nd Resistance level before the pullback on Friday brought it back beneath the 2nd Resistance, in all conformist buy-breakouts winning out there, and contrarian sell-after-reversals stopped out.
 Source: IG
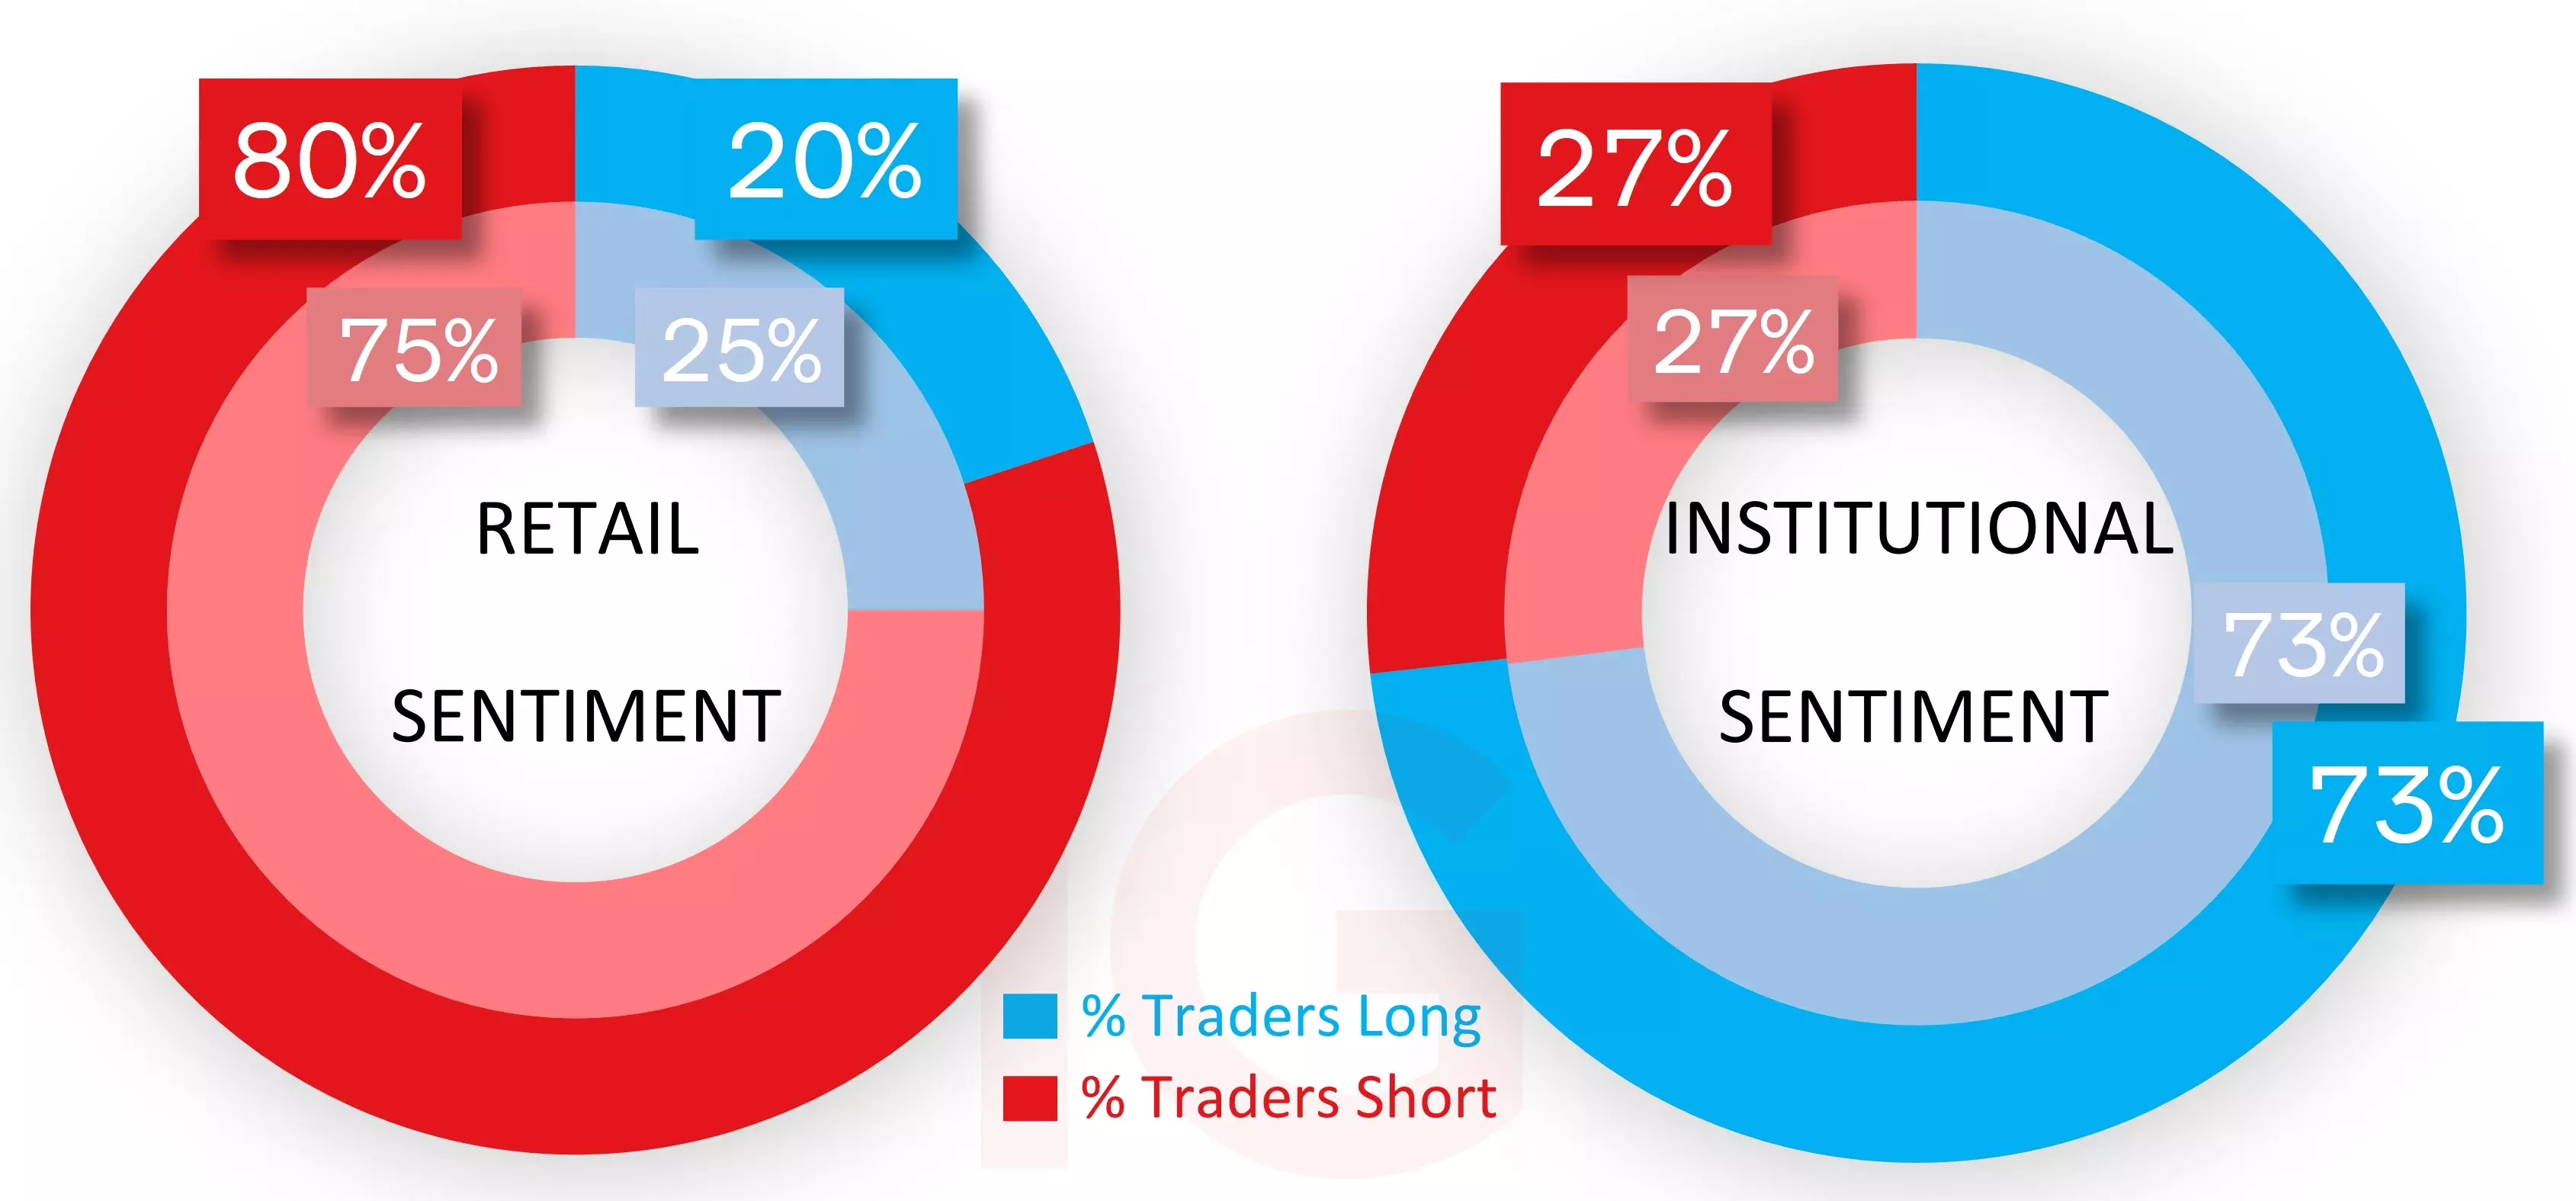
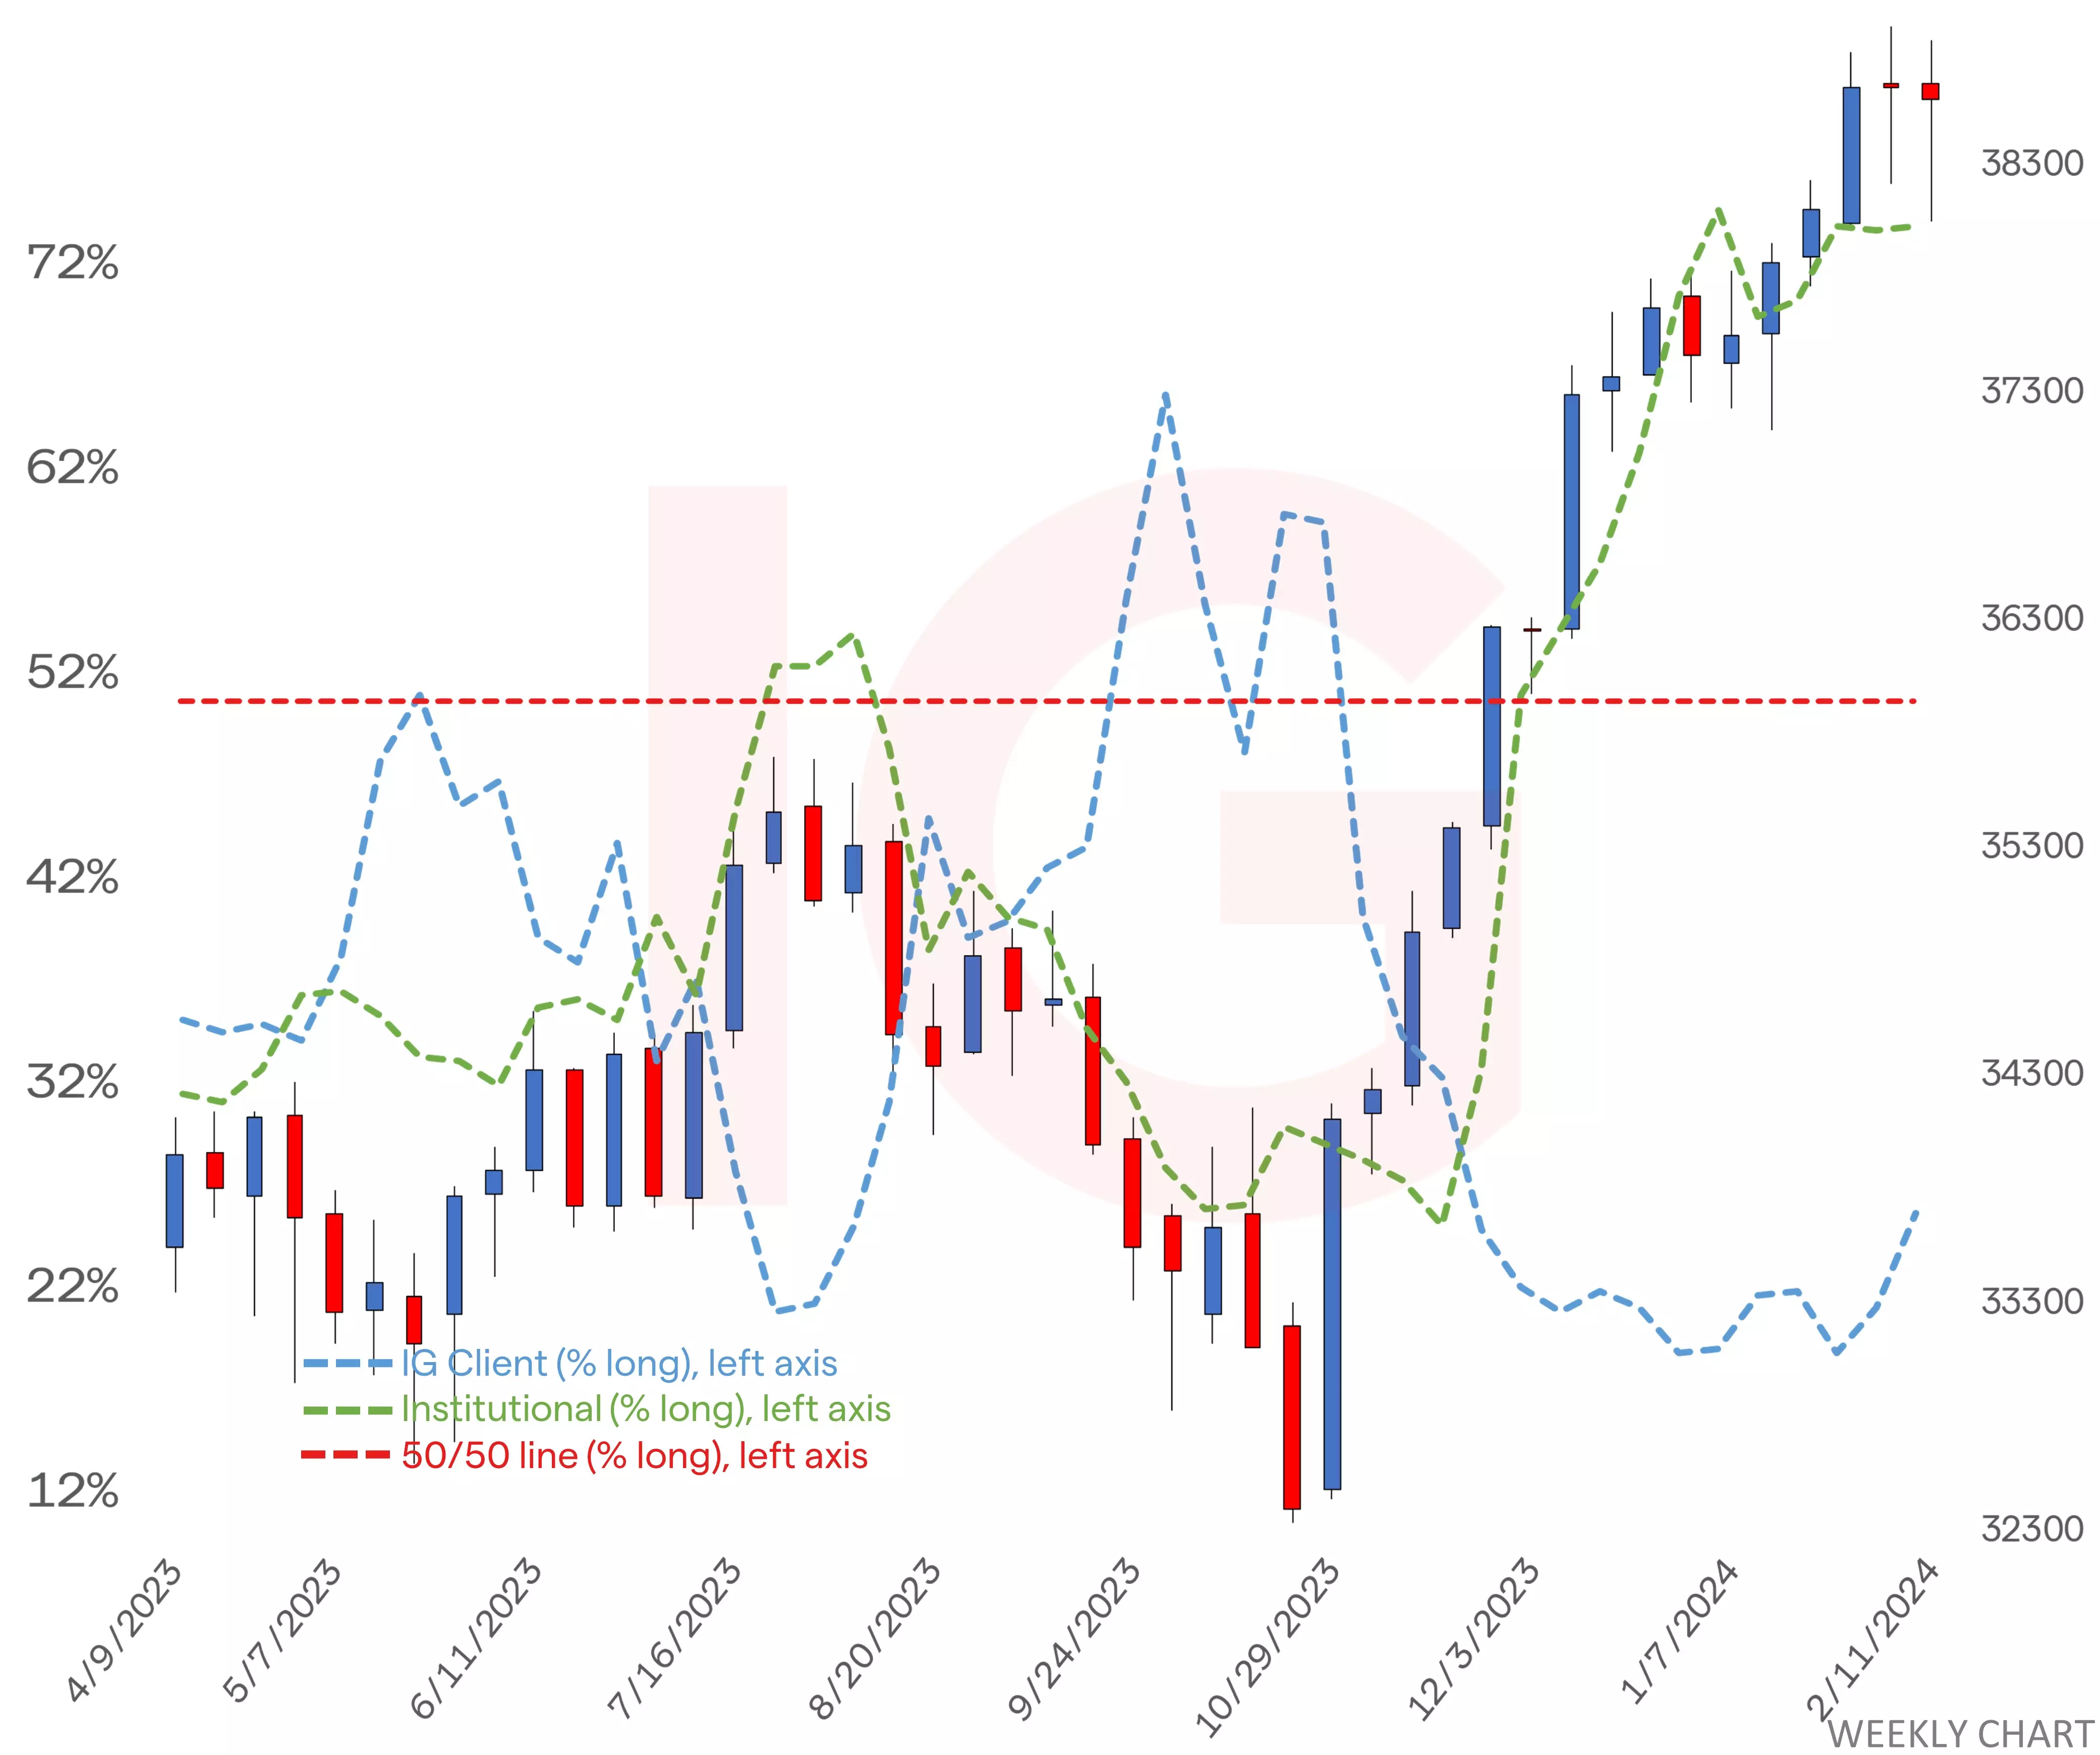
IG client* and CoT** sentiment for the Dow
CoT are on hold in heavy buy territory at 73%, with relatively small changes in both long and short positioning (longs +673 lots, shorts +114). IG clients started off the week beneath extreme sell levels and last Tuesday's price drop was an initial boon, but the recovery thereafter, even if partial, has pushed sentiment to an extreme short 80%.
 Source: IG
Dow chart with retail and institutional sentiment
 Source: IG
- *The percentage of IG client accounts with positions in this market that are currently long or short. Calculated to the nearest 1%, as of the start of this week for the outer circle. Inner circle is from the start of last week.
- **CoT sentiment taken from the CFTC’s Commitment of Traders report, outer circle is latest report released on Friday with the positions as of last Tuesday, inner circle from the report prior.
This information has been prepared by IG, a trading name of IG Australia Pty Ltd. In addition to the disclaimer below, the material on this page does not contain a record of our trading prices, or an offer of, or solicitation for, a transaction in any financial instrument. IG accepts no responsibility for any use that may be made of these comments and for any consequences that result. No representation or warranty is given as to the accuracy or completeness of this information. Consequently any person acting on it does so entirely at their own risk. Any research provided does not have regard to the specific investment objectives, financial situation and needs of any specific person who may receive it. It has not been prepared in accordance with legal requirements designed to promote the independence of investment research and as such is considered to be a marketing communication. Although we are not specifically constrained from dealing ahead of our recommendations we do not seek to take advantage of them before they are provided to our clients.
-
The Australian dollar gains against a softer US dollar, navigating through mixed economic cues and awaiting crucial RBA insights and wage data amidst growing speculation on interest rate adjustments.
 Source: Bloomberg
Last week saw a second straight week of gains for the AUD/USD - a beneficiary of the greenback weakness, that followed softer-than-expected US retail sales data and hotter-than-expected US CPI and PPI data.
The rally in the AUD/USD came despite a softer-than-expected Australian jobs report, as the unemployment rate surged to a two-year high at 4.1.% While the ABS suggested the weakness was a result of changing seasonal dynamics, we think it reinforces the underlying trend of cooling in the labour market. Therefore, increasing the chance of RBA rate cuts in the second half of the year.
This week's critical local economic events for the AUD/USD are Tuesday's RBA meeting minutes, previewed below, and wages data on Wednesday, expected to increase by 0.9% in the quarter and 4.1% annually.
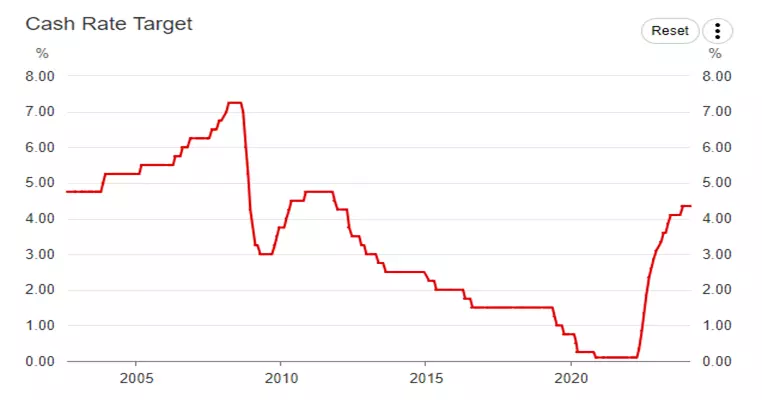
What is expected from this week's RBA meeting minutes (Tuesday, 22 February at 11.30am)
The minutes from the Reserve Bank of Australia’s February meeting are scheduled to be released on Tuesday, 22 February at 11.30am.
At its board meeting in February, the RBA kept its official cash rate on hold at 4.35%, as widely expected. The RBA noted that higher interest rates were working to reduce inflation, and to achieve a better balance between supply and demand.
"Higher interest rates are working to establish a more sustainable balance between aggregate demand and supply in the economy.”
The RBA confirmed that it remains data-dependent and retained a weak tightening bias.
"The path of interest rates that will best ensure that inflation returns to target in a reasonable timeframe will depend upon the data and the evolving assessment of risks, and a further increase in interest rates cannot be ruled out. "
The minutes will be closely scrutinised around what options the RBA board considered at the February meeting, the factors that would prompt the RBA to act on its tightening bias in 2024, and any clues about what might see the bank offer a more neutral bias.
RBA cash rate chart
 Source: RBA
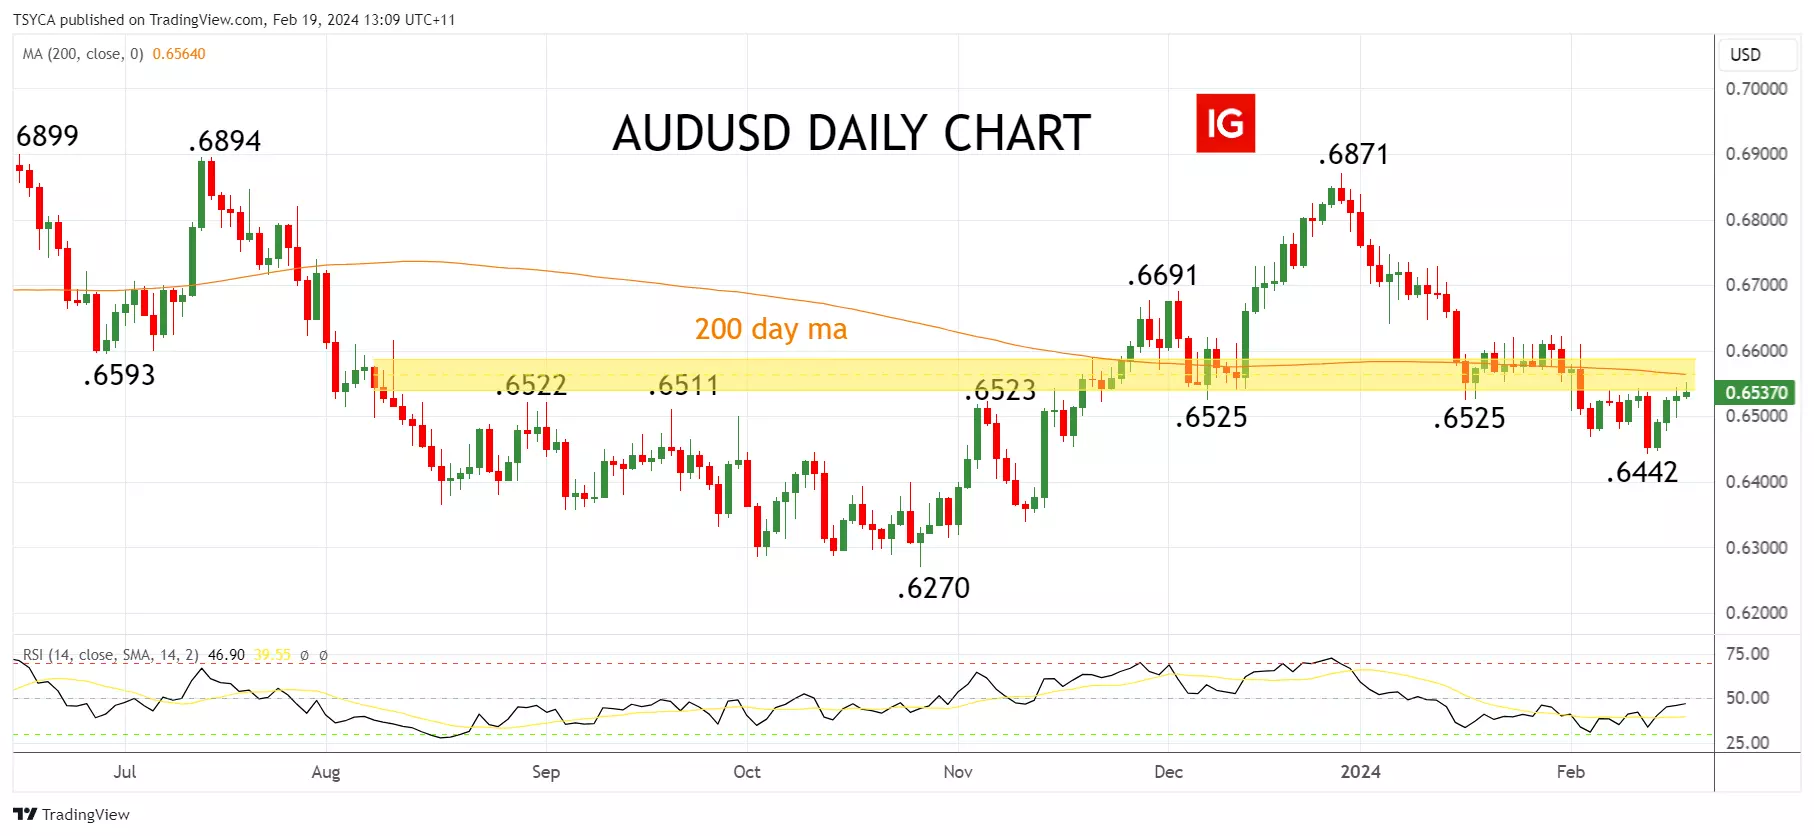
AUD/USD technical analysis
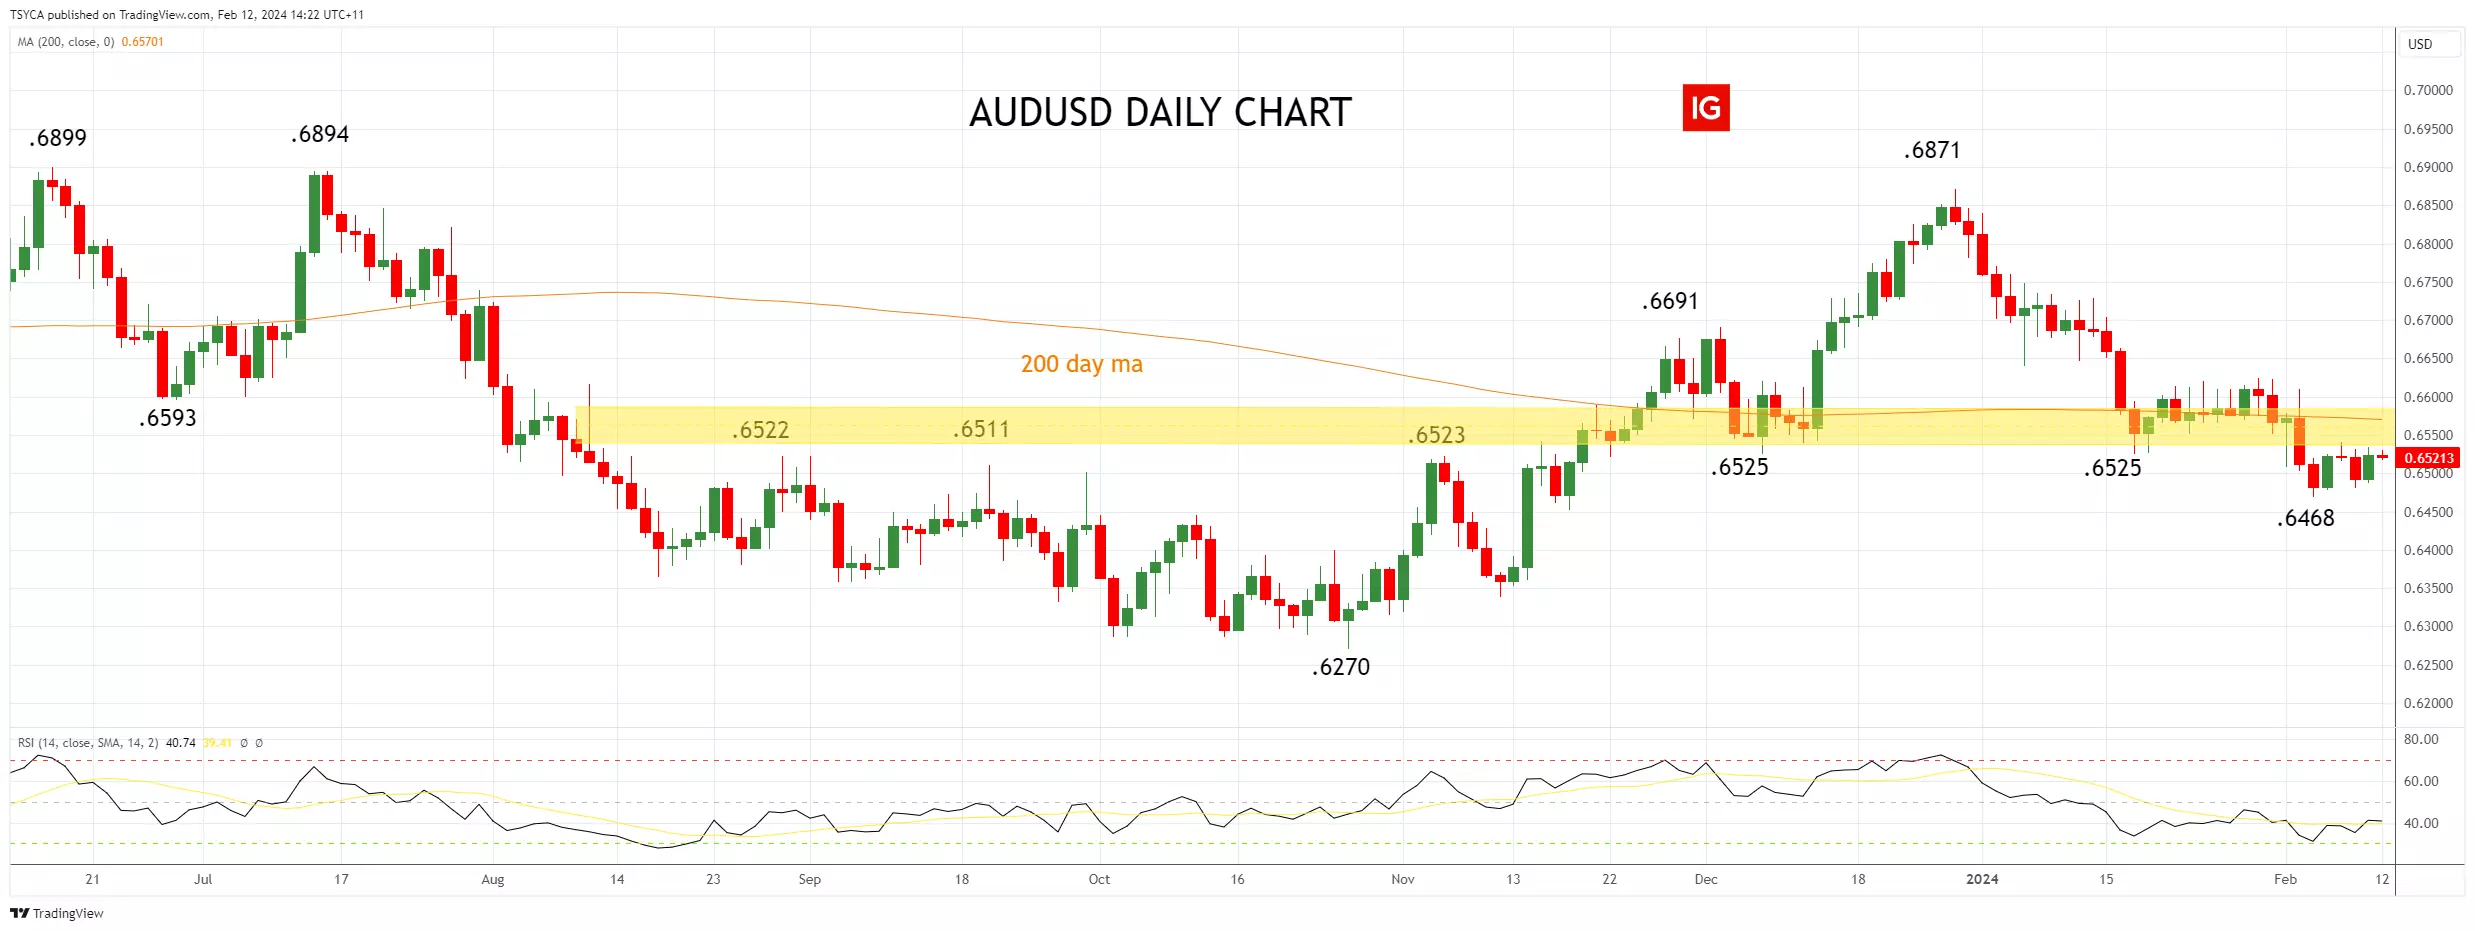
Recently, we have been looking for the AUD/USD to stabilise and move higher based on the idea that the pullback from the December .6871 high is part of a correction rather than a reversal lower.
However, last week's break below .6500c, to Tuesday’s .6442 low has created a degree of technical damage and cast doubt over this interpretation. While the AUD/USD remains below the .6540/65 resistance zone, which includes the 200-day moving average, the risks are for a retest of .6442 low with scope to a lower band of support at .6400/.6380.
Aware that a sustained move above the .6540/65 resistance zone would negate the downside risks and open the way for a stronger recovery towards initial resistance at .6620/30 before .6700c.
AUD/USD daily chart
 Source: TradingView
- Source:TradingView. The figures stated are as of 19 February 2024. Past performance is not a reliable indicator of future performance. This report does not contain and is not to be taken as containing any financial product advice or financial product recommendation.
This information has been prepared by IG, a trading name of IG Australia Pty Ltd. In addition to the disclaimer below, the material on this page does not contain a record of our trading prices, or an offer of, or solicitation for, a transaction in any financial instrument. IG accepts no responsibility for any use that may be made of these comments and for any consequences that result. No representation or warranty is given as to the accuracy or completeness of this information. Consequently any person acting on it does so entirely at their own risk. Any research provided does not have regard to the specific investment objectives, financial situation and needs of any specific person who may receive it. It has not been prepared in accordance with legal requirements designed to promote the independence of investment research and as such is considered to be a marketing communication. Although we are not specifically constrained from dealing ahead of our recommendations we do not seek to take advantage of them before they are provided to our clients.
-
Chinese stocks have seen muted gains so far after the Lunar New Year break, despite hopes for a stronger rebound. More policy stimulus may be needed as deflation looms. Japan's Nikkei index hit near 32-year highs and is outpacing the gains in U.S. indexes. But its market cap remains below giants like Apple and Nvidia. Nvidia's upcoming earnings this week will test its high valuations. Its huge gain has accounted for over a quarter of the S&P 500's rise this year. In Europe, PMIs, sentiment surveys, wage data and inflation expectations will be in focus this week. The ECB is also eying high wage growth warily. Fed speakers and minutes are due this week. Markets have sharply scaled back bets on Fed rate cuts this year as inflation remains stubbornly high. Just 36% chance of a May cut now priced in versus fully priced in earlier. Today's US holiday for Presidents' Day means a quiet session lies ahead for European markets.
-
-
-
The Nikkei 225 has been performing well, trading close to its record high from 1989. Despite Japan slipping into recession and losing its position as the world's third-largest economy, the stock market has continued to rally. The weakening yen has been beneficial for large Japanese companies with global operations, boosting their profits and supporting the export-reliant economy. However, a soft yen also raises the prices of food and energy imports, impacting consumers. The Bank of Japan is facing the challenge of balancing its monetary policy to support economic growth while considering the potential risks of maintaining negative interest rates for an extended period. U.S. stocks have also been performing well, reaching record highs, driven by expectations of rate cuts later in the year and the growth of the tech and AI sectors. Today's data includes the latest US producer price inflation and the preliminary Michigan confidence survey for February.
-
-
-
 1
1
-
-
-
Upcoming mid-April Bitcoin halving: What to expect? Delve into the Bitcoin halving's impact on mining rewards and its historical trend of triggering price surges. How might this event shape Bitcoin's future market value?
 Source: Bloomberg
IG AnalystPublication date:
Source: Bloomberg
IG AnalystPublication date:The Bitcoin halving event is due in mid-April – what does this mean?
Bitcoin halving is a scheduled event that occurs approximately every four years, or after 210,000 blocks have been mined. During this event, the reward for mining new blocks is halved, meaning miners receive 50% fewer bitcoins for verifying transactions. Halving is hard-wired into the Bitcoin protocol to ensure that the total supply of the currency is capped at 21 million, thereby introducing scarcity into the ecosystem. The next Bitcoin halving event is expected in mid-April this year.
Bitcoin mining is a critical process that underpins the functionality and security of the Bitcoin (BTC) network. Mining involves solving complex mathematical problems to validate transactions; and add new blocks to the blockchain. This process is carried out by powerful computers, often referred to as miners, which compete to solve these problems in exchange for rewards in the form of newly minted bitcoins, and transaction fees.
Balancing act: How mining difficulty and market prices shape Bitcoin's economy
Mining difficulty adjusts approximately every two weeks, to ensure that the time between blocks remains around 10 minutes, irrespective of the number of miners and their computational power. This difficulty adjustment can influence miner profitability. When prices are high, more miners are incentivised to compete, increasing the hash rate (the total computational power used to mine and process transactions).
Conversely, if the price drops and mining becomes less profitable, miners may exit the market, which can decrease the hash rate. If the price of Bitcoin falls below the cost of mining, miners may choose to hold onto their bitcoins rather than sell at a loss, potentially creating a supply crunch.
Bitcoin halving events historically lead to bullish market behaviour.
The first Bitcoin halving occurred in November 2012, reducing the mining reward from 50 BTC to 25 BTC. Following the halving, Bitcoin experienced a significant surge in value, going from around $13 to over $1,100 in the next year.
The second halving took place in July 2016, when the reward dropped from 25 BTC to 12.5 BTC after the halving. Bitcoin reached a high of around $20,000 by December 2017. The third halving, in May 2020, reduced the block reward to 6.25 BTC. Bitcoin surpassed its previous all-time high and traded at just over $69,000 in November 2021.
Historical Bitcoin halving price action
November 28th 2012
- Halving Price - $13 --- 2013 Peak Price - $1,125
July 16th 2016
- Halving Price - $664 --- 2017 Peak Price - $19,798
May 11th 2020
- Halving Price - $9,168 --- 2021 Peak Price - $69,000
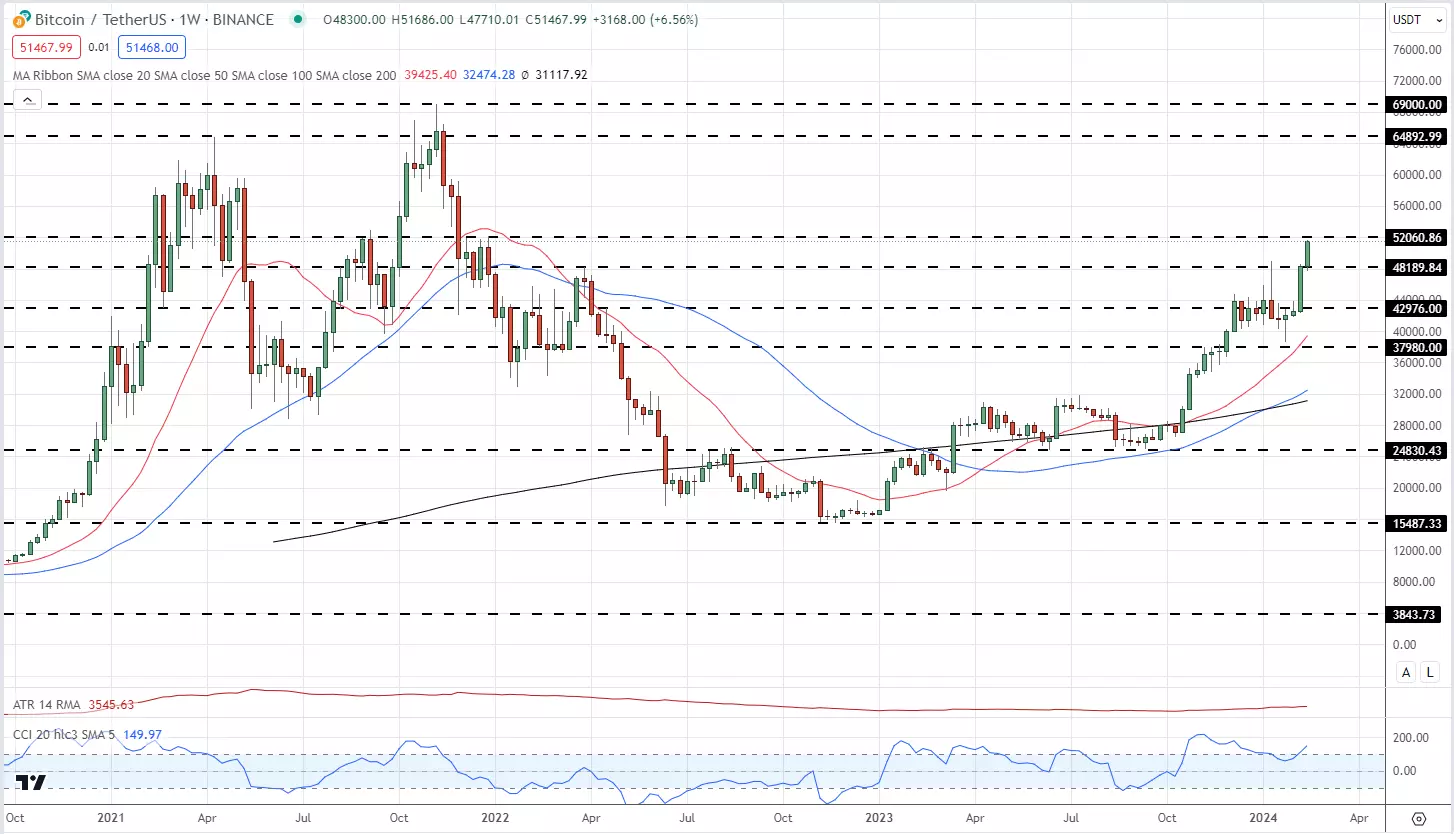
With two months to go before the next halving event, Bitcoin is pushing higher, helped in part by the recent launch of 11 spot Bitcoin ETFs. The strong demand for these ETFs has not only underpinned the spot price of Bitcoin but is also driving the price higher as the halving event nears. Bitcoin has regained the $50k level and may look at testing the all-time-high around $69k after the halving event reduces mining rewards by 50%.
Bitcoin weekly price chart
 Source: TradingView
This information has been prepared by IG, a trading name of IG Australia Pty Ltd. In addition to the disclaimer below, the material on this page does not contain a record of our trading prices, or an offer of, or solicitation for, a transaction in any financial instrument. IG accepts no responsibility for any use that may be made of these comments and for any consequences that result. No representation or warranty is given as to the accuracy or completeness of this information. Consequently any person acting on it does so entirely at their own risk. Any research provided does not have regard to the specific investment objectives, financial situation and needs of any specific person who may receive it. It has not been prepared in accordance with legal requirements designed to promote the independence of investment research and as such is considered to be a marketing communication. Although we are not specifically constrained from dealing ahead of our recommendations we do not seek to take advantage of them before they are provided to our clients.
-
Dive into the latest moves in the tech-heavy index following a slight pullback in yields and gains for heavyweight Nvidia.
 Source: Bloomberg
Light on data, Fed comments, and a slight pullback in yields
There was little to process in terms of economic data out of the US, with the weekly mortgage applications from the MBA falling 2.3%. This shift meant attention was focused on Federal Reserve (Fed) members speaking. The Fed's Barr discussed the potential "bumpy" path to their 2% inflation target following Tuesday’s higher CPI (Consumer Price Index) readings, stating it's "very early to say whether we end up with a soft landing or not". Goolsbee expressed opposition to "waiting until inflation on a 12-month basis has already reached 2% before beginning to cut rates".
As for Treasury yields, they closed the session lower, reversing some of Tuesday's gains and falling back in real terms, which is seen as a positive for risk appetite. Breakeven inflation rates edged slightly higher, and market pricing (CME's FedWatch) anticipates the US central bank will maintain its current policy in May, even if by a slim majority that isn’t too far from a coin toss.
More Fed members are scheduled to speak today, alongside the 10-year TIPS auction, but there's also a significant amount of US data on the docket, including retail sales for January, which are forecasted to show a slight contraction. Important data is also expected tomorrow with producer prices and the University of Michigan's (UoM) preliminary readings for consumer sentiment and inflation expectations.
Sector performance places tech near the top, Nvidia overtakes Alphabet
Most sectors concluded yesterday's session positively, with industrials leading, closely followed by communications, technology, and consumer discretionary. This resulted in gains for the tech-heavy Nasdaq 100, which outperformed both the S&P 500 and Dow 30 for the session.
By the close, component performance saw Illumina and Netflix leading, with AMD close behind. On the other end, Kraft Heinz suffered the most due to a revenue miss, and after hours, Cisco's cautious guidance sent its share price tumbling. It was a session where Nvidia surpassed Alphabet to become the third most valuable company on the US stock market, with notable gains for other major players like Meta and Tesla.
Nasdaq technical analysis, overview, strategies, and levels
Price eventually settled above Wednesday’s daily 2nd Resistance level favoring conformist buy-breakouts and stopping out contrarian sell-after-reversals, but that hasn’t meant caution on pullbacks in price after what was witnessed last Tuesday even if the catalyst then was a significant fundamental event. The technical overview remains ‘bull average’ in both daily and weekly time frames.
 Source: IG
IG client* and CoT** sentiment for the Nasdaq
In terms of sentiment, retail traders are predominantly short, having reduced their sell bias to 63% rather than increasing it as is typical following significant price gains. They started the week with a substantial 70% sell bias, with some traders exiting their short positions after last Tuesday's price drop.
Since then, they have been cautious about selling into price gains. In contrast, CoT speculators hold a majority buy position. The latest positioning data indicates they are choosing to decrease their long bias at these price levels.
 Source: IG
Nasdaq chart with retail and institutional sentiment
 Source: IG
- *The percentage of IG client accounts with positions in this market that are currently long or short. Calculated to the nearest 1%, as of today morning 8am for the outer circle. Inner circle is from the previous trading day.
- **CoT sentiment taken from the CFTC’s Commitment of Traders report, outer circle is latest report released on Friday with the positions as of last Tuesday, inner circle from the report prior.
This information has been prepared by IG, a trading name of IG Australia Pty Ltd. In addition to the disclaimer below, the material on this page does not contain a record of our trading prices, or an offer of, or solicitation for, a transaction in any financial instrument. IG accepts no responsibility for any use that may be made of these comments and for any consequences that result. No representation or warranty is given as to the accuracy or completeness of this information. Consequently any person acting on it does so entirely at their own risk. Any research provided does not have regard to the specific investment objectives, financial situation and needs of any specific person who may receive it. It has not been prepared in accordance with legal requirements designed to promote the independence of investment research and as such is considered to be a marketing communication. Although we are not specifically constrained from dealing ahead of our recommendations we do not seek to take advantage of them before they are provided to our clients.
-
The tech-fuelled rally in Asia, led by TSMC, has given a boost to equities in the region. Taiwan stocks reached a record high, with chip shares catching up with their global counterparts. Nvidia's surge in value, surpassing Google-parent Alphabet and becoming the third-most valuable US company, has also contributed to the positive sentiment in the tech sector. TSMC, a major supplier to Nvidia, experienced a significant increase in stock price, while the IT stocks index in Asia-Pacific outside Japan jumped 3%. The Nikkei continued to climb, supported by chip stocks, despite data which showed the Japanese economy fell into recession, contracting by 0.1% after Q3's 0.8% fall. The data from Japan has raised doubts about the timing of the Bank of Japan's exit from ultra-loose policy. The yen strengthened slightly but remains in the 150 per dollar region. In Europe, the afterglow of Nvidia's rise may also lift bourses, with futures indicating a higher open. The UK economy slipped into recession in Q4, shrinking by 0.3% after Q3's 0.1% fall. Interest rate futures are currently pricing in a 50% chance of a Bank Rate cut in June, but today's data will likely push that number higher.
-
We’ve launched a new video series titled "Technical cheat sheet", where one of our top-traded markets is selected for an in-depth analysis of its technical aspects, including key indicators, an overview, levels, and strategies.
We examine the main fundamental events that might challenge shorter-term technicals, as well as sentiment amongst IG clients and CoT speculators.
This information has been prepared by IG, a trading name of IG Markets Limited. In addition to the disclaimer below, the material on this page does not contain a record of our trading prices, or an offer of, or solicitation for, a transaction in any financial instrument. IG accepts no responsibility for any use that may be made of these comments and for any consequences that result. No representation or warranty is given as to the accuracy or completeness of this information. Consequently any person acting on it does so entirely at their own risk. Any research provided does not have regard to the specific investment objectives, financial situation and needs of any specific person who may receive it. It has not been prepared in accordance with legal requirements designed to promote the independence of investment research and as such is considered to be a marketing communication. Although we are not specifically constrained from dealing ahead of our recommendations we do not seek to take advantage of them before they are provided to our clients. See full non-independent research disclaimer and quarterly summary.
-
This month’s consumer price inflation (CPI) is expected to show a further slowing of inflation pressures, but a March rate cut is still very unlikely.
 Source: Bloomberg
Price growth to slow
Consumer price inflation (CPI) is projected to slow in January when the data is released on 13 February, bolstering the Federal Reserve's (Fed) view that cuts will happen this year, though it is unlikely to do much for hopes of a March rate cut.
The headline CPI rate (year-over-year) is expected to dip below 3% for the first time in nearly three years (since March 2021). Most of that deceleration should come from retreating energy prices and a further slide in food inflation.
Home rents drive core inflation
Core CPI, excluding food and energy, is expected at 3.8% year-over-year in January, down slightly from December's 3.9%. But a disproportionate share of that increase still stems from higher home rents. Shelter cost growth will keep slowing as lower market rents gradually pass through into leases. Price increases for goods have fallen back to around zero, as the impact of severe global supply chain strains earlier continues to ease.
Markets are no longer expecting any action from the Fed in March, and even weaker inflation is unlikely to push the chance of a March cut much higher. The CME Fed Watch tool shows just a 15% chance of a March cut, down from 77% a month ago:
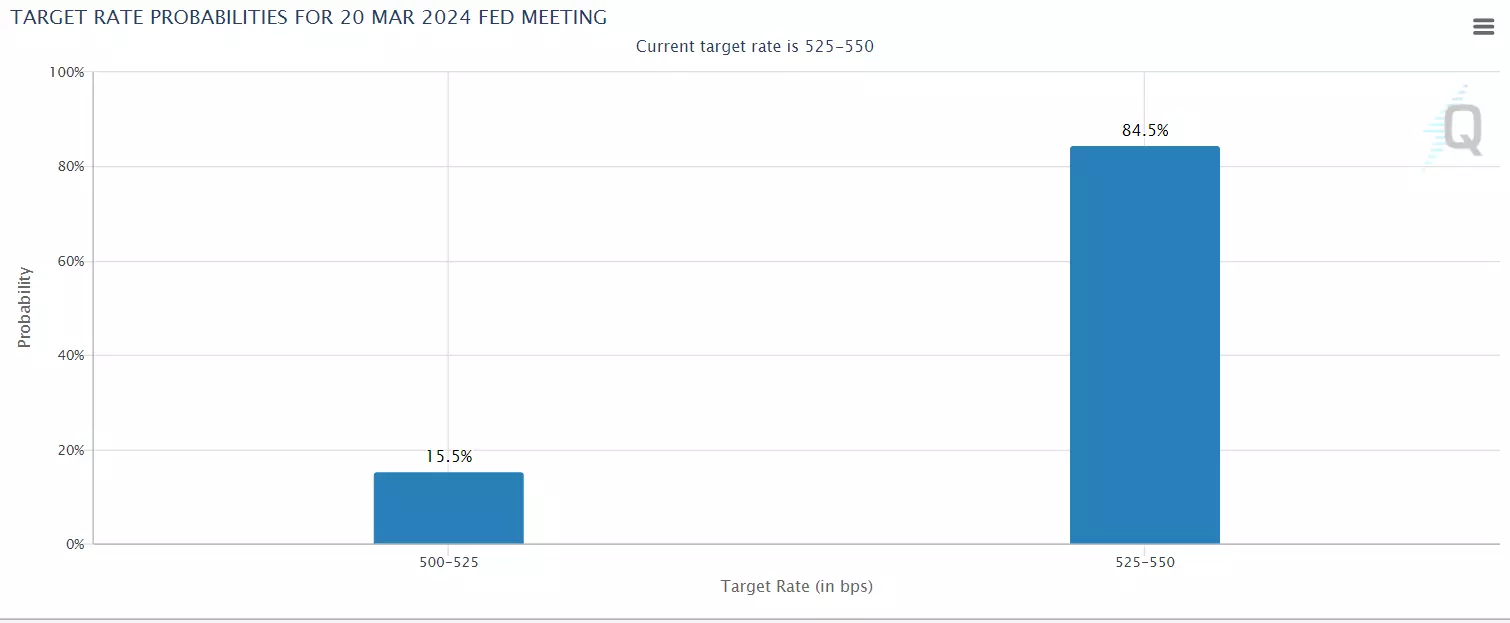 Source: CME Fed Watch
In January, the CPI report is expected to show a moderation in inflation, which could instil confidence among economists. The decline in energy prices and a slowdown in food inflation are likely to contribute to a reduction in the overall inflation rate. However, the persistently high rent increases may prevent a significant drop in the "core" CPI, which excludes food and energy. Core inflation measures are important indicators for policymakers as they provide insights into future price trends.
The upcoming inflation data will be crucial for financial markets, as they hope for relief from the Fed's benchmark interest rate, which has remained at a 23-year high since July. The Fed's rate hikes, initiated in March 2022, were aimed at curbing inflation but led to interest rates on various loans reaching multi-decade highs.
Market participants are eagerly looking for signs of a substantial slowdown in inflation to bolster expectations that the Fed might pause or even reverse some of its aggressive tightening measures. If there is more evidence indicating that underlying price pressures are easing, it could reassure investors that the central bank will not need to maintain restrictive interest rates for as long as previously anticipated.
This information has been prepared by IG, a trading name of IG Markets Limited. In addition to the disclaimer below, the material on this page does not contain a record of our trading prices, or an offer of, or solicitation for, a transaction in any financial instrument. IG accepts no responsibility for any use that may be made of these comments and for any consequences that result. No representation or warranty is given as to the accuracy or completeness of this information. Consequently any person acting on it does so entirely at their own risk. Any research provided does not have regard to the specific investment objectives, financial situation and needs of any specific person who may receive it. It has not been prepared in accordance with legal requirements designed to promote the independence of investment research and as such is considered to be a marketing communication. Although we are not specifically constrained from dealing ahead of our recommendations we do not seek to take advantage of them before they are provided to our clients. See full non-independent research disclaimer and quarterly summary.
-
An ongoing bullish technical overview in both time frames ahead of the fundamental event.
 Source: Bloomberg
CPI revisions, Fed members speaking, and the S&P’s 5,000 breach
There were a few items to digest late last week, including the revisions from the Bureau of Labor Statistics (BLS) for the Consumer Price Index (CPI), which was slightly higher for October and November but lower for December. More Federal Reserve (Fed) members speak, with Logan discussing the “tremendous progress” in bringing down inflation but “not seeing any urgency to make any additional adjustments at this time” and to “take time here to continue to look at the data”. Prior to that, Barkin also favored patience, relying on the buffer of “robust demand and a historically strong labor market”, giving “time to build that confidence before we begin the process of toggling rates down”.
Key US equity indices finished higher again for the week, and this time around, small-cap also enjoyed gains, though it was the S&P 500 taking most of the attention with the breach of its 5,000 level. Over in the bond market, Treasury yields finished the week higher and, on the further end, reversing losses from the week before that, in real terms averaging closer to 2% for the 5Y through 30Y, and market pricing (CME’s FedWatch) anticipating the first rate cut out of the US central bank in May via an unhealthy majority.
Week ahead: CPI, retail sales, PPI, and more earnings
As for the week ahead, it starts off very light with little to get excited about later today aside from more Fed members speaking, but picks up tomorrow with a heavyweight as we get January’s CPI readings. Expectations are for year-on-year (y/y) growth to drop from 3.4% headline to 3%, month-on-month (m/m) to rise by 0.2%, and when excluding food and energy, to see increases of 3.8% and 0.3%, respectively (Cleveland Fed’s ‘nowcasts’ at 2.94%, 0.13%, 3.81%, and 0.32%).
Trade pricing data will be released on Thursday, where you can expect the attention to be on retail sales, already enjoying six consecutive beats, but forecasts are for a slight drop this time around. Producer prices for the same month will be on Friday, an ongoing story of sub-2% headline and core readings y/y, and forecasts are for m/m growth of just 0.1% for both. Consumer inflation expectations out of UoM (University of Michigan) have been trending in the right direction and not too far off pre-pandemic averages, and while consumer sentiment rising has been an added plus, it still requires a climb to touch 100 as it did in early 2020. The preliminary readings will also be released on Friday, preceded by a couple of items out of the housing market.
For those trading energy, the weekly API, EIA, and Baker Hughes figures will be on offer on their respective days, but add to it OPEC’s monthly report tomorrow and IEA’s on Thursday, and whether the gap in demand forecasts for this year between the two will remain wide. It’ll be relatively quieter on the US earnings front and includes Coca-Cola on Tuesday, Cisco on Wednesday, and Coinbase on Thursday.
Dow technical analysis, overview, strategies, and levels
The intraweek highs and lows were within its previous weekly 1st levels, lacking a play for conformist and contrarian strategies, but where key technical indicators and its overview remain unchanged in this time frame. As for the daily time frame late last week, Thursday's 1st Resistance held on Friday, causing conformist buy-breakout strategies to fail and lacking a trigger for contrarian sell-after-reversals, though nowhere near derailing the ‘bull average’ technical overview there.
This information has been prepared by IG, a trading name of IG Australia Pty Ltd. In addition to the disclaimer below, the material on this page does not contain a record of our trading prices, or an offer of, or solicitation for, a transaction in any financial instrument. IG accepts no responsibility for any use that may be made of these comments and for any consequences that result. No representation or warranty is given as to the accuracy or completeness of this information. Consequently any person acting on it does so entirely at their own risk. Any research provided does not have regard to the specific investment objectives, financial situation and needs of any specific person who may receive it. It has not been prepared in accordance with legal requirements designed to promote the independence of investment research and as such is considered to be a marketing communication. Although we are not specifically constrained from dealing ahead of our recommendations we do not seek to take advantage of them before they are provided to our clients.
-
Gold, Brent and natural gas prices all struggle
Commodity prices have been unable to make much headway this morning, with even oil prices seeing their recent rally begin to falter.
 Source: Bloomberg
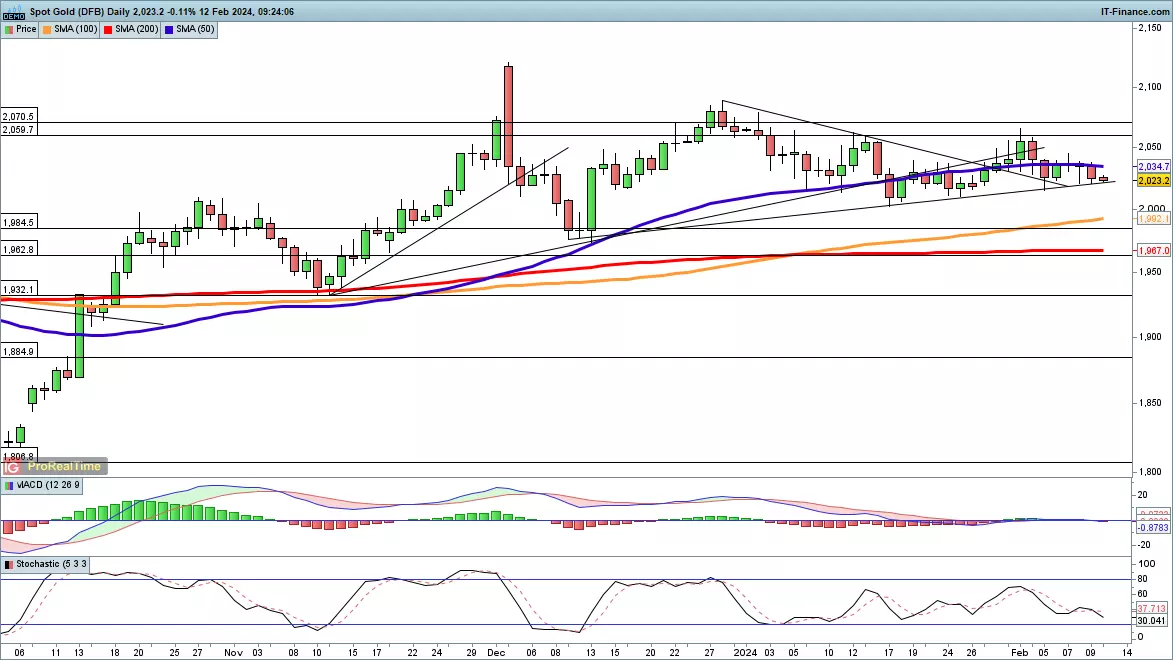
Gold clings to trendline support
Gold’s period of disappointing performance continues, though it has been able to hold rising trendline support from early December. A close back above the 50-day simple moving average (SMA) would open the way to another test of recent highs at $2060, and then on to $2070 and then the December high at $2086. A close below the trendline would mark a bearish development and suggest a move towards $2000, or down to the December lows.
 Source: ProRealTime
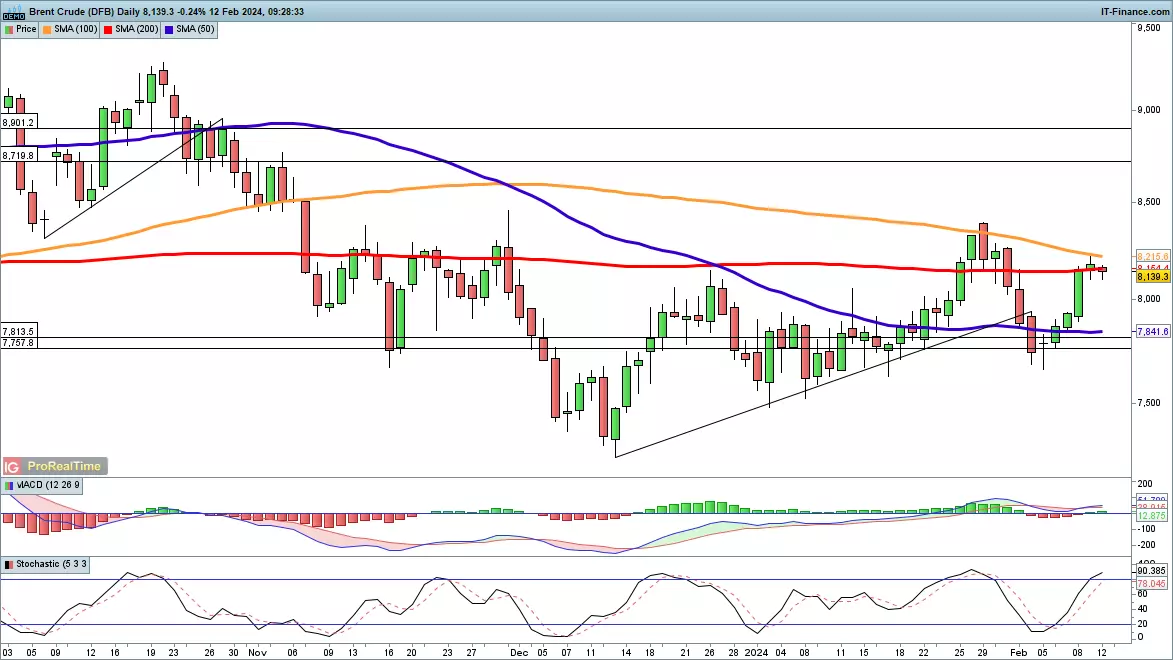
Brent rally stalls
After four days of gains, the price has returned to the 200-day SMA. Friday saw the price move above this level and just about hold above it, but the 100-day SMA appeared to act as a resistance. A close back below $80 could signal that the price has formed a lower high, and that a return to the lows of last week could develop. A close above the 100-day SMA would help maintain the bullish outlook and open the way to the $84, the late January high.
 Source: ProRealTime
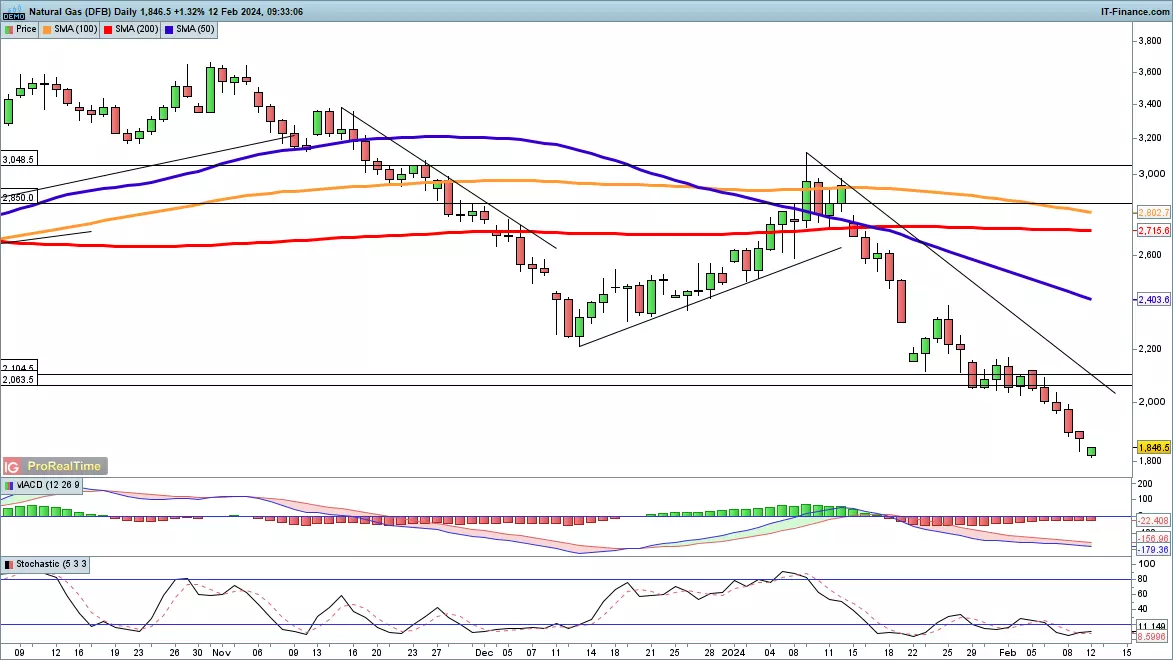
Natural Gas slumps
The major decline in natural gas prices goes on. The price has broken through the early 2023 lows, and now further declines towards the 1644 support level beckon, while beyond this lies the 1517 low from mid-2020. After such sharp losses over the past week, a rebound could develop, but for now trendline resistance from early January stands in the way of any further upside.
 Source: ProRealTime
-
Gold, Brent and natural gas prices all struggle
Commodity prices have been unable to make much headway this morning, with even oil prices seeing their recent rally begin to falter.
Source: Bloomberg
Gold clings to trendline support
Gold’s period of disappointing performance continues, though it has been able to hold rising trendline support from early December. A close back above the 50-day simple moving average (SMA) would open the way to another test of recent highs at $2060, and then on to $2070 and then the December high at $2086. A close below the trendline would mark a bearish development and suggest a move towards $2000, or down to the December lows.
Source: ProRealTime
Brent rally stalls
After four days of gains, the price has returned to the 200-day SMA. Friday saw the price move above this level and just about hold above it, but the 100-day SMA appeared to act as a resistance. A close back below $80 could signal that the price has formed a lower high, and that a return to the lows of last week could develop. A close above the 100-day SMA would help maintain the bullish outlook and open the way to the $84, the late January high.
Source: ProRealTime
Natural Gas slumps
The major decline in natural gas prices goes on. The price has broken through the early 2023 lows, and now further declines towards the 1644 support level beckon, while beyond this lies the 1517 low from mid-2020. After such sharp losses over the past week, a rebound could develop, but for now trendline resistance from early January stands in the way of any further upside.
Source: ProRealTime
-
FTSE 100 struggles while DAX and Dow hold steady
The FTSE 100 remains under pressure in early trading, while both the Dax and Dow hold on near their previous highs.
Source: Bloomberg
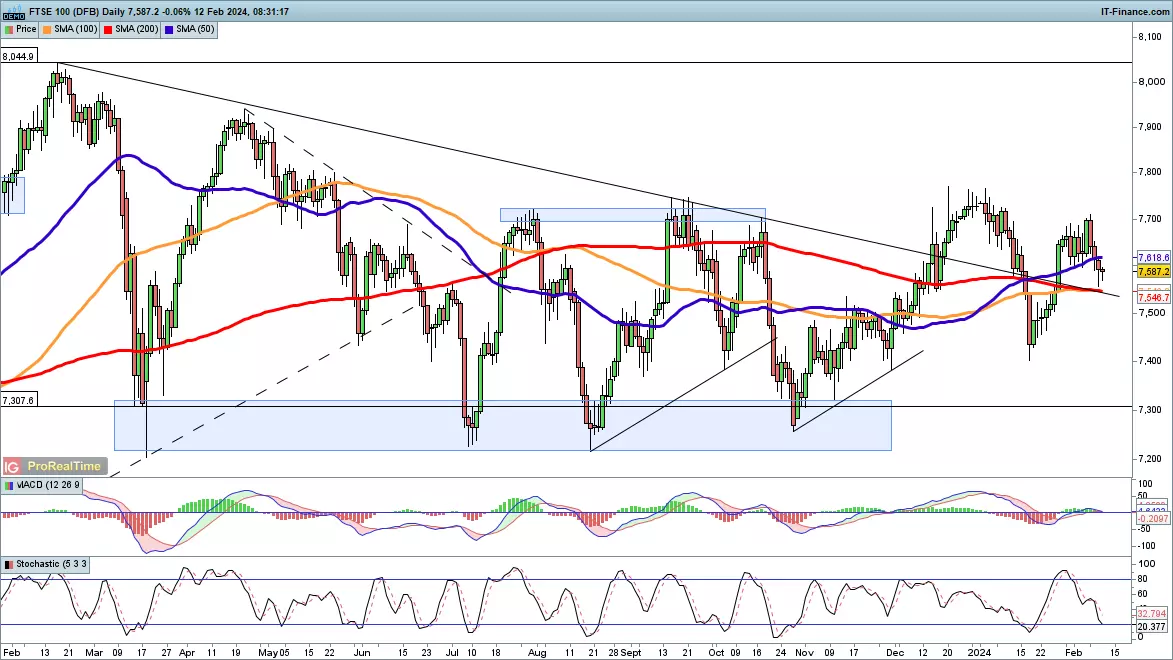
FTSE 100 under pressure
The index has fallen back for several days, retreating from 7700 and the lower high of early February. Having broken above trendline resistance from the 2023 highs during the course of late January, the price may now retest the broken trendline from above. This would also coincide with the 200-day simple moving average (ISMA). A recovery above 7600 might yet signal that a low has been formed. Additional declines target the late January low at 7400, and below this down towards 7250 and the support zone that lasted throughout 2023.
 Source: ProRealTime
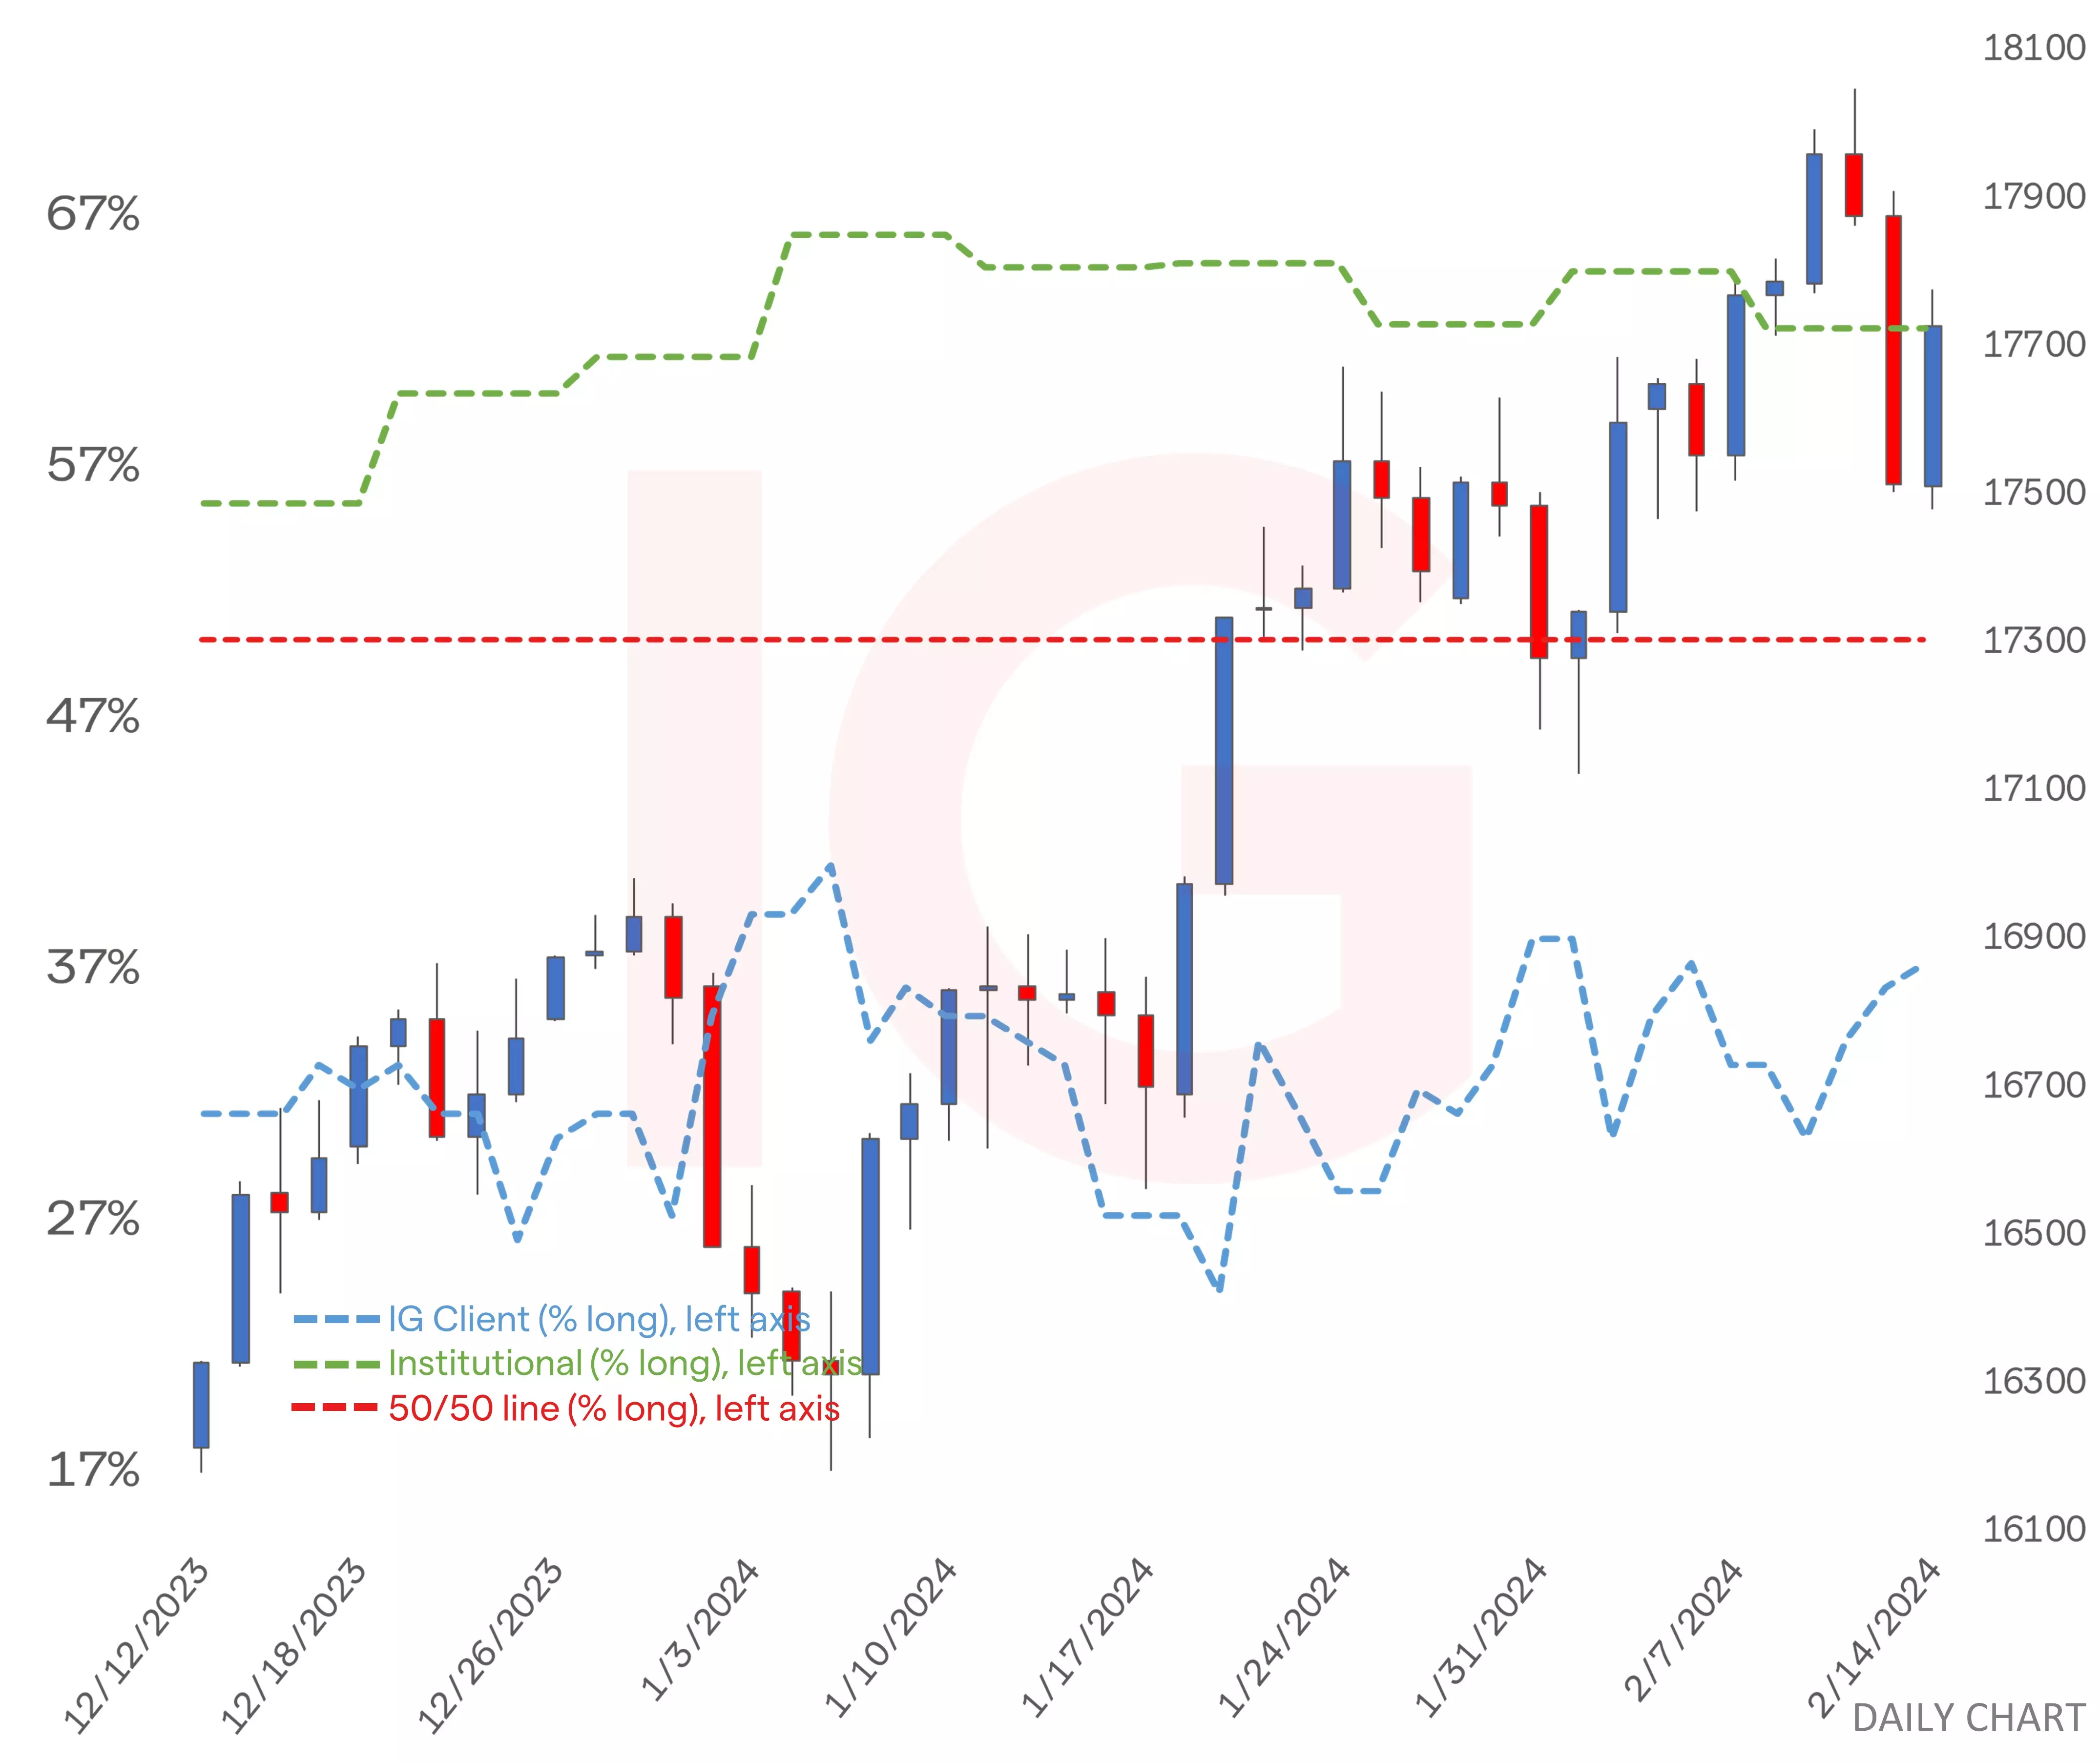
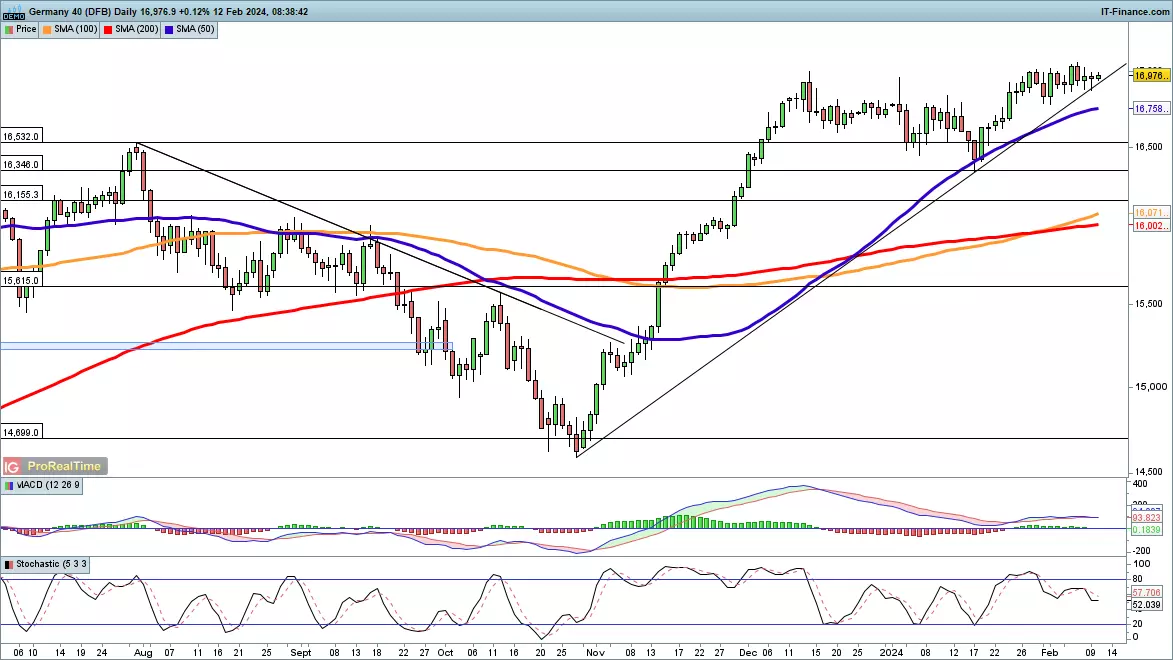
DAX holds near 17,000
The Dax continues to consolidate around 17,000, but remains above trendline support from the October low. Mid-January weakness found buyers at the 50-day SMA, and in the short-term a push to a fresh record high seems likely. A near-term retracement requires a close back below the 50-day SMA to open the path to January’s low at 16,345, with some possible support before this at the previous record high of 16,532.
 Source: ProRealTime
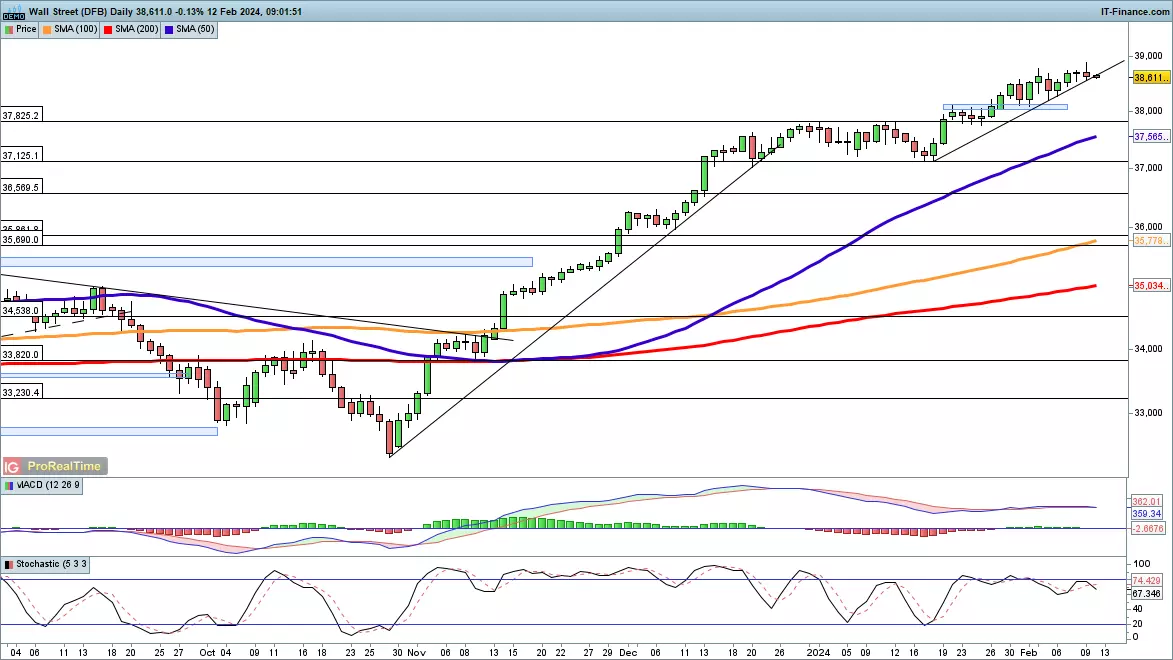
Dow drifts through trendline support
In what might be seen as a portentous development, the Dow is testing support from the mid-January low. In the short-term, further weakness could follow, potentially clearing the way to another test of the previous highs at 37,825. Below this lies the 50-day SMA, and then down to 37,125, the lows of December.
 Source: ProRealTime
-
The AUD/USD ends its losing streak buoyed by a hawkish RBA and record credit growth in China, setting the stage for Australia's pivotal job report.
Source: Bloomberg
Last week saw the AUD/USD snap a five-week losing streak, following a more hawkish than expected RBA meeting, and as China credit data beat expectations.
Despite the RBA keeping the cash rate unchanged at 4.35%, and revising down its forecasts for core inflation (3.1% by end-24, from 3.3% previously), the RBA retained its tightening bias, noting that “a further increase in interest rates cannot be ruled out”.
Data released on Friday in China showed that Chinese banks extended CNY 4.92 trillion in new yuan loans in January, a record high since records began in 2004. At the same time, Total Social Financing (TSF), a broader measure of credit and liquidity, reached a record high of CNY 6.5 trillion in January, well above forecasts for CNY 5.55 trillion. The stronger-than-expected credit data will provide much-needed support from the embattled Chinese economy.
This week's critical local economic event for the AUD/USD is Thursday's labour force report for January.
What is expected from this week's Labour Force Report (Thursday, February 15th at 11.30pm)
Last month, the Australian economy lost a sizeable 65.1k jobs in December vs. the 15k gain expected. The unemployment rate remained unchanged at 3.9% due to a significant drop in the participation rate from 67.1% to 66.8%.
David Taylor, ABS head of labour statistics, said: "The fall in employment in December followed larger than usual employment growth in October and November, a combined increase of 117,000 people, with the employment-to-population ratio and participation rate both at record highs in November."
This month, the market is looking for the economy to add 37.5k jobs and for the participation rate to increase to 66.9%. This would see the unemployment rate rise to 4.0%, the highest since February 2022 and keep intact our view for two 25bp rate cuts in 2024, the first in August.
AU unemployment rate chart
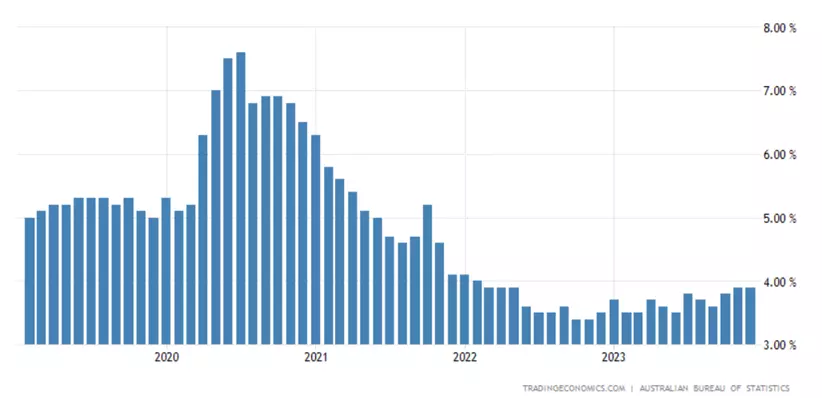 Source: TradingEconomics
AUD/USD technical analysis
Recently, we have been looking for the AUD/USD to stabilise and move higher based on the idea that the pullback from the December .6871 high is part of a correction, rather than a reversal lower. However, last week's break below .6500c has created a degree of technical damage and cast doubt over this interpretation, leaving us with a more neutral bias.
To restore a more positive outlook, the AUD/USD must see a sustained move above last week's .6540 high and then above the 200-day moving average at .6570. Aware that while below the .6540/70 resistance zone, the risks are for a test of support at .6400/.6380.
AUD/USD daily chart
 Source: TradingView
- Source:TradingView. The figures stated are as of 12 February 2023. Past performance is not a reliable indicator of future performance. This report does not contain and is not to be taken as containing any financial product advice or financial product recommendation.
This information has been prepared by IG, a trading name of IG Markets Limited. In addition to the disclaimer below, the material on this page does not contain a record of our trading prices, or an offer of, or solicitation for, a transaction in any financial instrument. IG accepts no responsibility for any use that may be made of these comments and for any consequences that result. No representation or warranty is given as to the accuracy or completeness of this information. Consequently any person acting on it does so entirely at their own risk. Any research provided does not have regard to the specific investment objectives, financial situation and needs of any specific person who may receive it. It has not been prepared in accordance with legal requirements designed to promote the independence of investment research and as such is considered to be a marketing communication. Although we are not specifically constrained from dealing ahead of our recommendations we do not seek to take advantage of them before they are provided to our clients. See full non-independent research disclaimer and quarterly summary.
Market update: historic rate rise on track despite recession, USD/JPY contained
in Foreign Exchange (FX)
Posted
As Japan faces recession, markets remain optimistic about a historic interest rate hike by the Bank of Japan in April, despite recent inflation trends and sharp increases in yen short positions amidst FX intervention warnings.
Markets anticipate April for potential rate hike
Markets have remained unfazed by Japan's recent entry into a recession, continuing to signal a high likelihood that the Bank of Japan will opt to increase interest rates by 0.1% in an effort to exit its prolonged negative interest rate policy.
The Bank's conditions for this significant hike include establishing a "virtuous relationship" between wages and prices. Inflation has stayed above the 2% target for more than a year, although it has decreased in the latest two reports, raising questions about the sustainability of price pressures above the 2% target.
Wage negotiations are in progress, expected to conclude by mid-March. This is the foundation for market speculation that the April meeting will bring the crucial rate hike.
CoT report indicates significant increase in yen shorts despite FX intervention warnings
Recent CoT data shows a surge in yen short positions, contradicting last week's warnings from Japan's principal currency official, Kanda, and the Bank of Japan's Deputy Governor, Shun’ichi Suzuki. Both officials have voiced their concerns over sharp and volatile FX movements (yen depreciation), with Kanda even suggesting FX intervention as a potential measure.
Positioning via Commitment of Traders Report (includes data up to 13 Feb)
USD/JPY cautiously maintains the 150 level
Despite warnings of FX intervention, USD/JPY continues to hold the 150 level. Indeed, current price action is creating a pennant-like formation, indicating a possible bullish continuation under normal market conditions. However, the potential for intervention poses a significant risk, making upward movements a gamble with a low risk-to-reward ratio, as historical FX interventions have typically caused the yen to shift by approximately 500 pips, mostly downward.
Should bulls manage to push prices towards 146.50, it may prompt scrutiny from the finance ministry, potentially leading to requests for FX quotes from banks. This approach has historically preceded large-scale yen purchases. Support is currently at 146.50, with resistance noted at the recent peak of 150.88, followed again by 146.50.
USD/JPY daily chart
This information has been prepared by IG, a trading name of IG Australia Pty Ltd. In addition to the disclaimer below, the material on this page does not contain a record of our trading prices, or an offer of, or solicitation for, a transaction in any financial instrument. IG accepts no responsibility for any use that may be made of these comments and for any consequences that result. No representation or warranty is given as to the accuracy or completeness of this information. Consequently any person acting on it does so entirely at their own risk. Any research provided does not have regard to the specific investment objectives, financial situation and needs of any specific person who may receive it. It has not been prepared in accordance with legal requirements designed to promote the independence of investment research and as such is considered to be a marketing communication. Although we are not specifically constrained from dealing ahead of our recommendations we do not seek to take advantage of them before they are provided to our clients.