

MongiIG
-
Posts
9,858 -
Joined
-
Last visited
-
Days Won
41
Content Type
Profiles
Forums
Blogs
Events
Community Tutorials
Store
Posts posted by MongiIG
-
-
Apple Q3 results are expected to show a marked decline from the previous quarter.
 Source: Bloomberg
When are the Apple results?
Apple Inc. the world’s largest company by market capitalisation in the UK, is set to report quarter three (Q3) 2021 earnings on 27 July 2021.
What ‘the Street’ expects from Apple Q3 2021 results?
Due to the Covid-19 pandemics' disruption on global business and in turn supply chains, Apple Inc. currently does not issue forward guidance for its quarterly results. However, Q3 2021 results do follow on from what was a very strong second quarter for the group, where record revenue was reported in each of the company’s geographic segments.
Q3 is however expected to see chip shortages due to supply chain disruption affecting Ipad and Mac sales. This could provide a $3 billion to $4 billion headwind in revenue for new product lines within this segment, which have seemingly drawn increased demand in 2021. iPad and Mac sales account for just over 15% in group revenue.
iPhone sales account for around 60% of total revenue and early indications are that sales within the groups largest market, North America, have been robust. Consumer intelligence research partners have suggested that Apple’s third quarter iPhone sales in the US could have captured around 63% of the market over this period.
Year on year (YoY) revenue growth for the company could be in excess of 20%, although the expectation is for a notable decline quarter on quarter (q/q).
A consensus of estimates for the upcoming Q3 2021 Apple results arrive at the following:
- Revenue for the quarter of $72.780 billion
- Earnings per share (EPS) for the quarter of $0.99
How to trade Apple results
In terms of an institutional view as of 20 July 2021, a Refinitiv poll of 41 analysts have an average rating of ‘buy’ for Apple, with a long-term price target (mean) of $159.73.
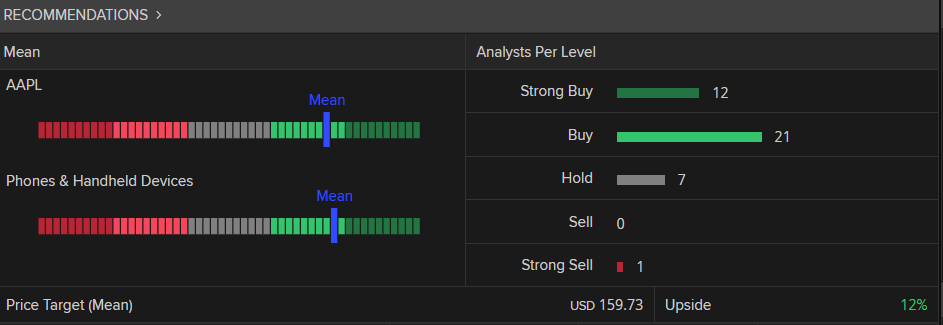 Source: Refinitiv
In terms of a retail trading view, as of 20 July 2021, IG client sentiment data shows 88% of IG clients with open positions expect the price to rise in the short term, while 12% expect the price to fall in the near term.
 Source: IG
Apple share price – technical view
The share price of Apple has recently broken out of a bullish triangle consolidation pattern. The triangle and breakout is a suggestion that the longer-term uptrend is being continued. In the short term however, the index is correcting from overbought territory.
The short-term correction within the longer-term uptrend suggests a second opportunity for long entry for breakout traders. The correction is however still underway with a confluence of both triangle and trend line support at around the $132.50 level. Traders of the pattern might prefer to see a bullish price reversal closer to the confluence of support ($132.50) before considering new long entries into Apple. In this scenario, $160.50 becomes a longer-term projected target, while a close below the support low instead at $122.75, would consider the bullish assumptions to have failed.
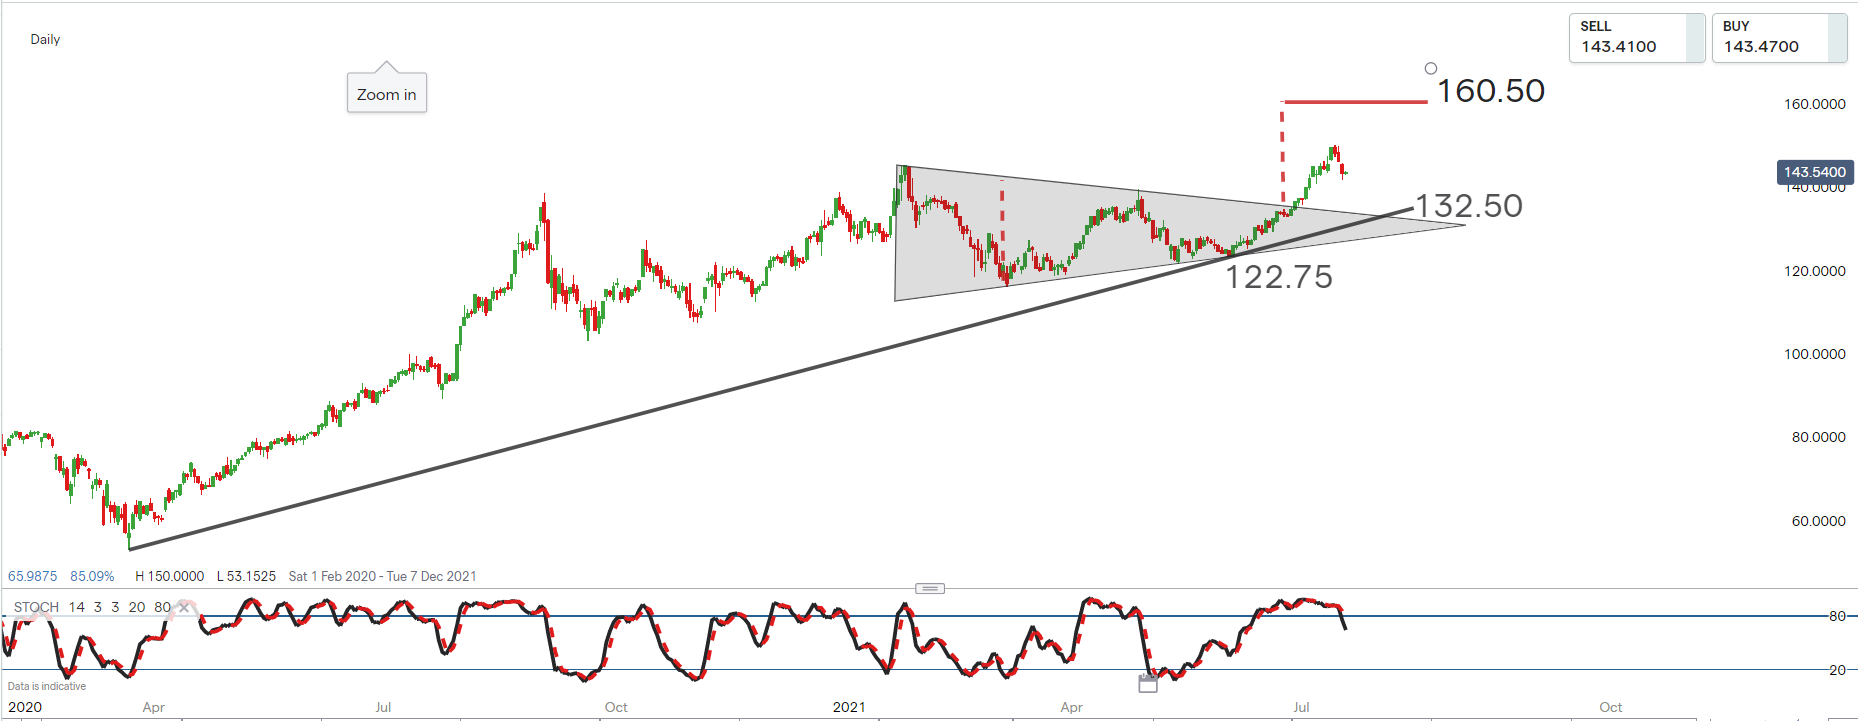 Source: IG charts
Summary
- Q3 2021 results are scheduled for the 27 July
- Supply chain disruptions are expected to impact iPad and Mac sales over the period
- Revenue for the quarter is estimated at $72.780 billion
- EPS for the quarter are estimated at $0.99
- The average broker rating for Apple Inc. remains ‘buy’
- The average long-term broker price target for Apple is $159.73
- The majority of IG clients with open positions on Apple expect the price to rise in the near term
- The long-term trend for Apple remains up, although the share price is currently correcting from overbought territory
-
Gold’s bounce stalls as oil recovers
Expectations of more gains in gold have been stymied, while oil prices have made further gains after stabilising yesterday.
 Source: Bloomberg
Gold
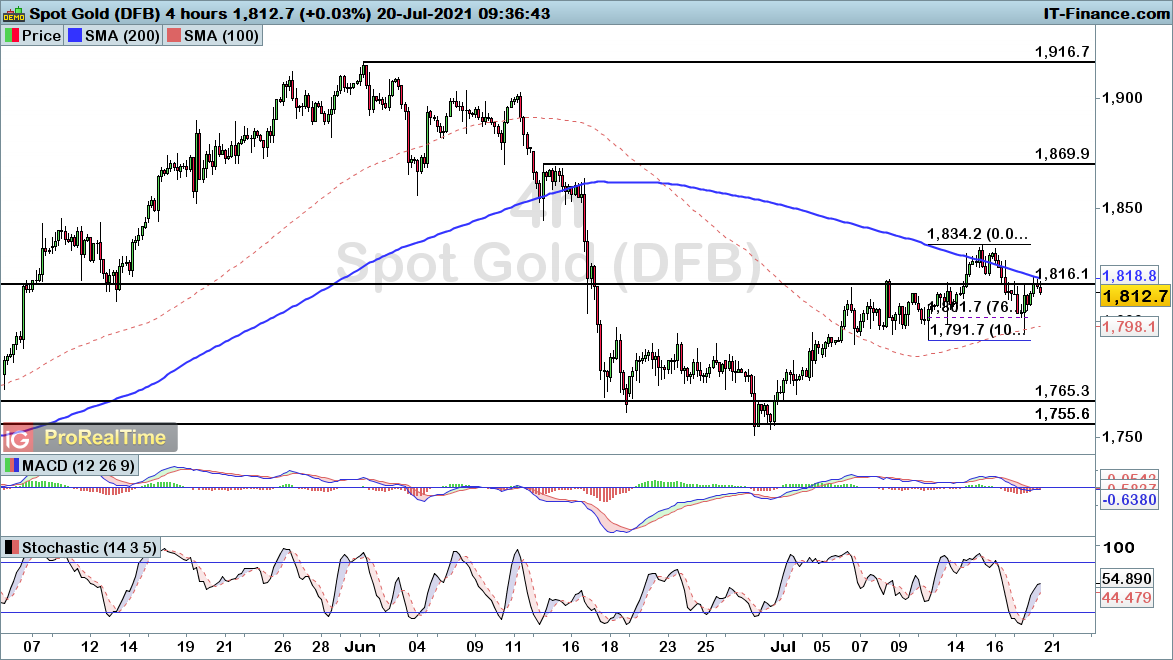
Hopes of a rebound in gold have been dashed after Tuesday’s session saw the price retreat from the 200-day simple moving average (SMA) at $1825, simultaneously failing to hold the highs of the session.
While a full-blown retracement has yet to develop it does look rather unpromising for the longs; a rally back above $1820 would help to revive the bullish view, while sellers expect further declines below $1800 that will strengthen the bearish case.
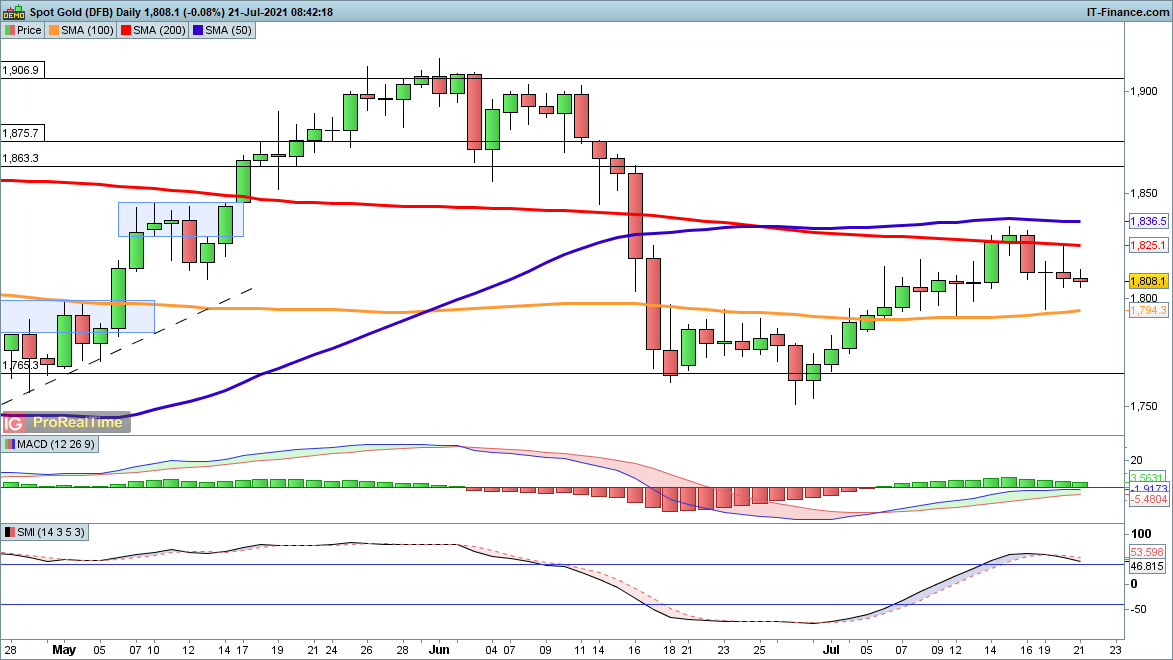 Source: ProRealTime
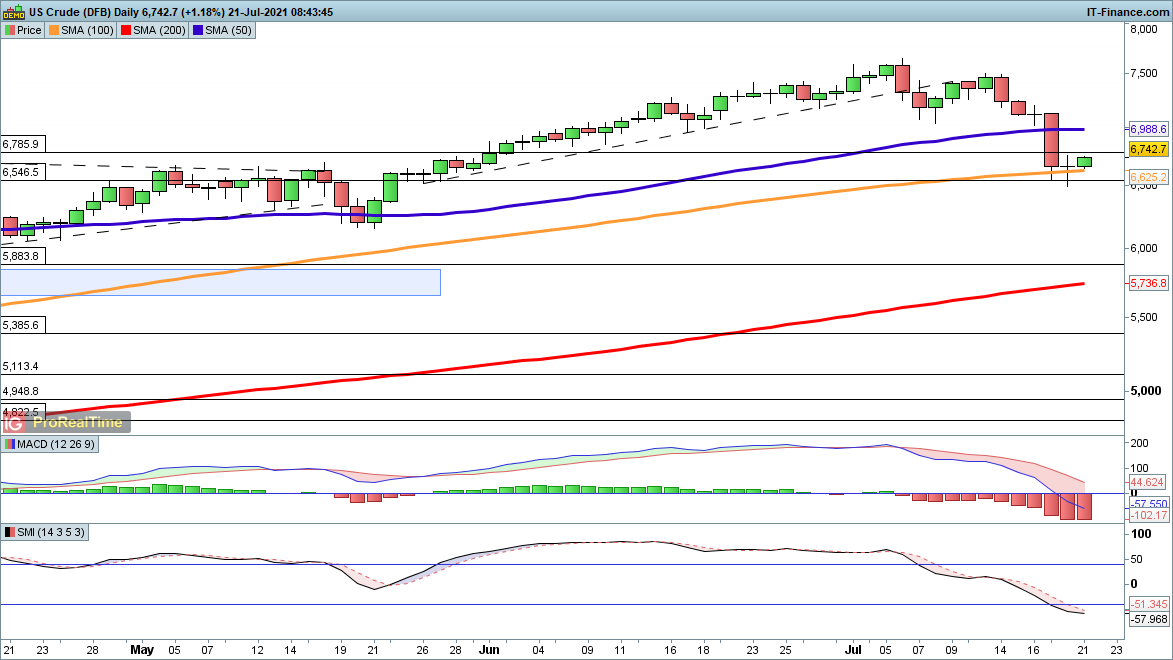
WTI
Oil found its footing yesterday, recovering from a brief trip below Monday’s low.
It continues to hold above the 100-day SMA ($66.52), giving hope for bulls that a higher low can be formed, with a new push back to the early July highs contemplated in due course. This view is negated if the price reverses course and falls back below $65.
 Source: ProRealTime

See opportunity on a commodity?
This information has been prepared by IG, a trading name of IG Markets Limited. In addition to the disclaimer below, the material on this page does not contain a record of our trading prices, or an offer of, or solicitation for, a transaction in any financial instrument. IG accepts no responsibility for any use that may be made of these comments and for any consequences that result. No representation or warranty is given as to the accuracy or completeness of this information. Consequently any person acting on it does so entirely at their own risk. Any research provided does not have regard to the specific investment objectives, financial situation and needs of any specific person who may receive it. It has not been prepared in accordance with legal requirements designed to promote the independence of investment research and as such is considered to be a marketing communication. Although we are not specifically constrained from dealing ahead of our recommendations we do not seek to take advantage of them before they are provided to our clients. See full non-independent research disclaimer and quarterly summary.
-
Netflix beats on paid subscriber growth, but misses earnings expectations.

Shares of Netflix recovered from an initial dip and were up nearly 1% after the bell Tuesday after the company reported earnings that missed on the bottom line. The company’s revenue slightly beat estimates, and it confirmed speculation that it will expand more into gaming.
![Netflix Has 45% Fewer Movies (and 400% More TV Shows) Than it Did in 2010 - TV[R]EV](https://i2.wp.com/tvrev.com/wp-content/uploads/2020/02/thibault-penin-AWOl7qqsffM-unsplash-scaled.jpg?fit=2560%2C1709&ssl=1)
Here’s what the company reported versus expectations:
- Earnings per share (EPS): $2.97 vs $3.16 expected, according to Refinitiv survey of analysts
- Revenue: $7.34 billion vs $7.32 billion expected, according to Refinitiv
- Global paid net subscriber additions: 1.54 million vs 1.19 million expected, according to Street Account
By Jessica Bursztynsky, 20 July 2021. CNBC
-
Indices look to continue Tuesday’s rebound
After the quick recovery on Tuesday, buyers are looking to press their advantage and make further headway.
 Source: Bloomberg
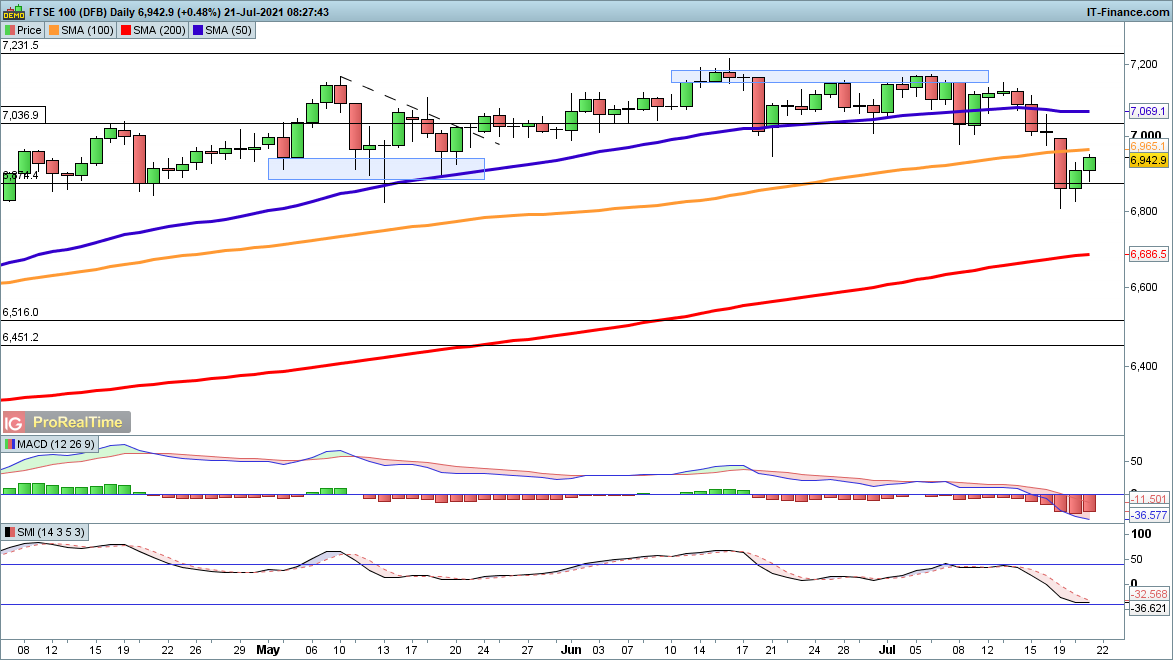
FTSE 100
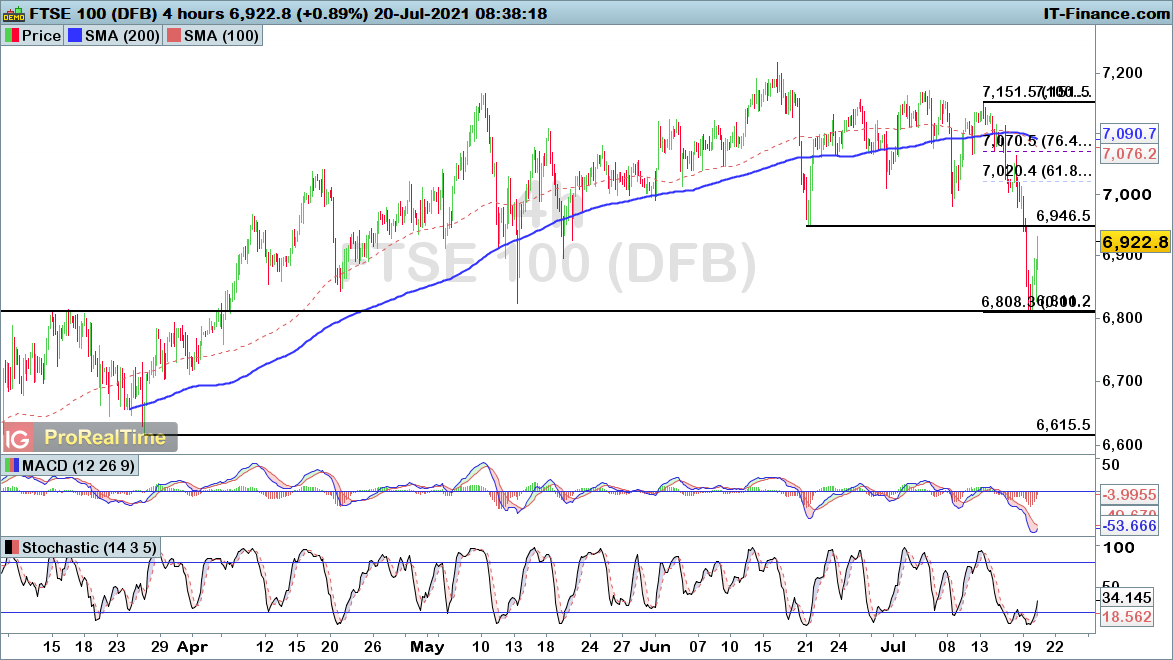
The FTSE 100 has rallied from the Monday lows, and has made further gains in early trading. Gains now target 7040, and then on to the 50-day simple moving average (SMA) at 7069.
Buyers stepped in to defend 6800, providing a low for now, and while this remains intact a move higher, accompanied by stochastic and moving average convergence divergence (MACD) crossovers, seems likely. A recovery above 6946 solidifies the bullish view.
 Source: ProRealTime
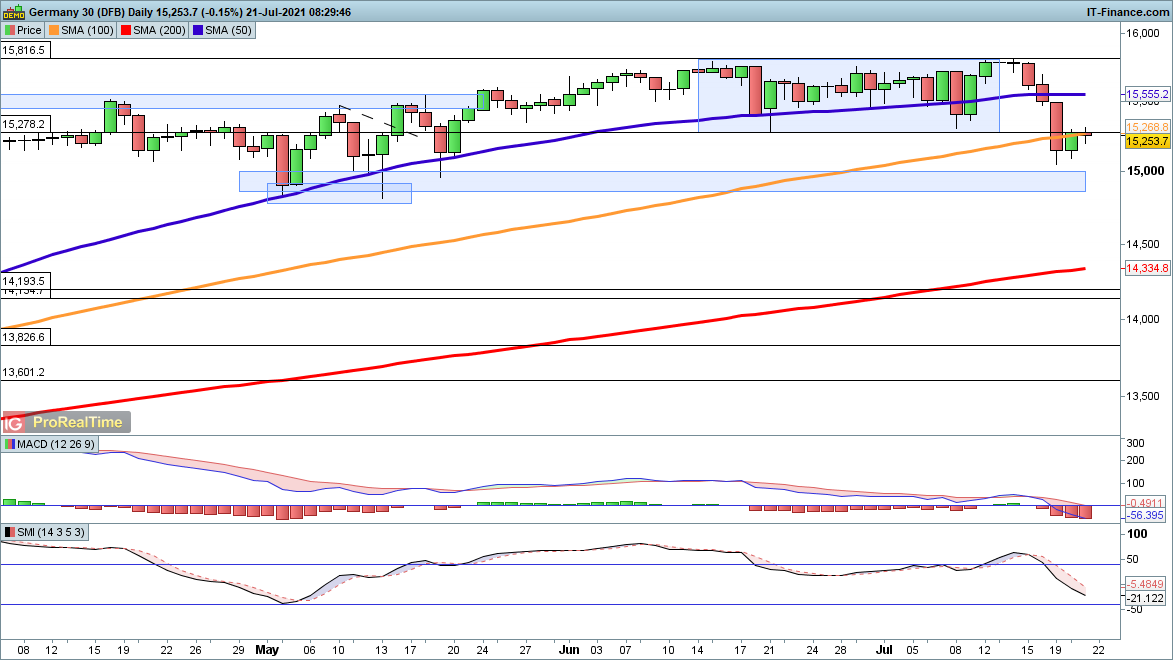
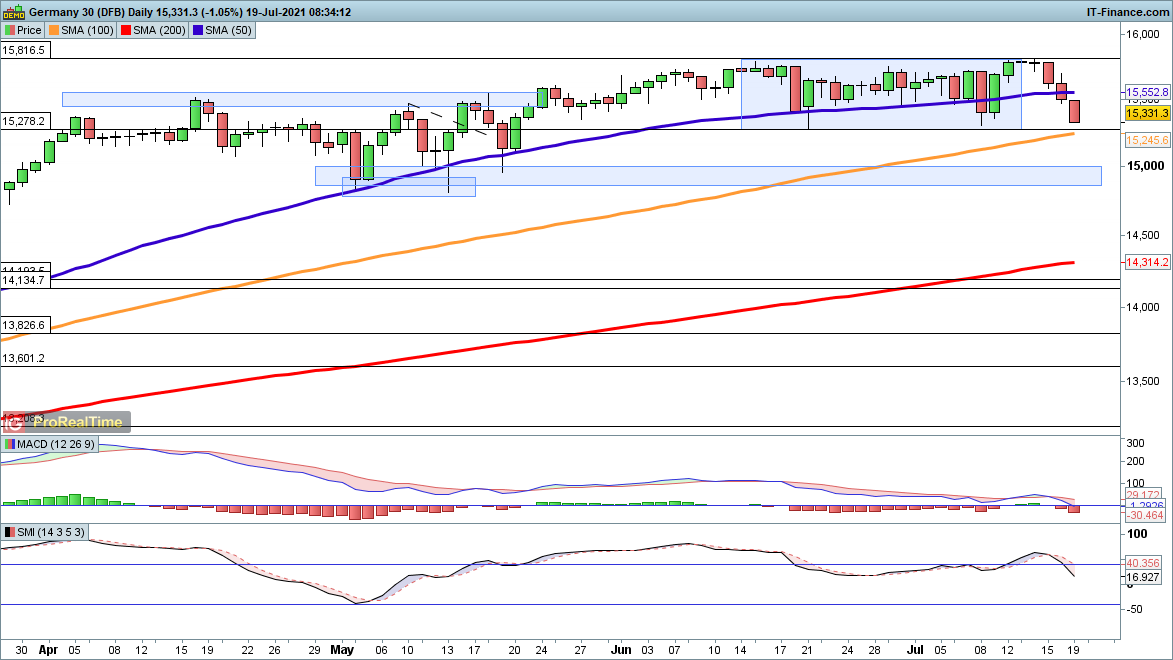
DAX
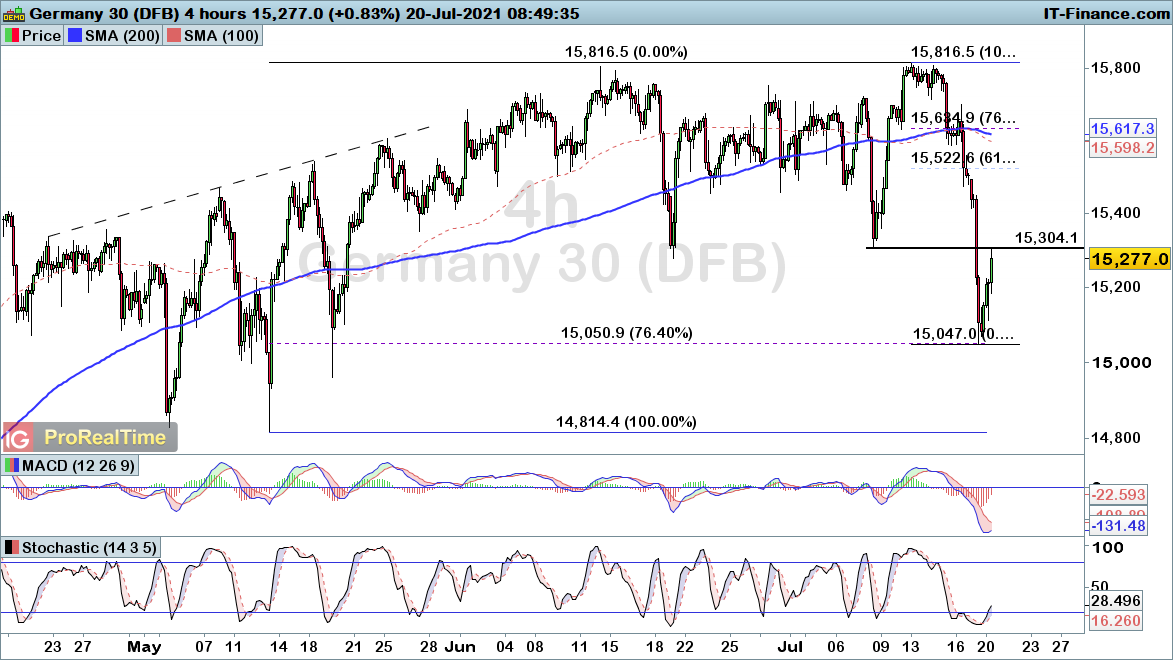
Gains are more muted here, with the price yet to rally back above 15,280 and move back into the zone that prevailed in June. Above 15,280 the price heads onwards to 15,800.
Sellers will be looking for a reversal back below 15,100 and then on to sub-15,000 in order to open the way to a deeper retracement.
 Source: ProRealTime
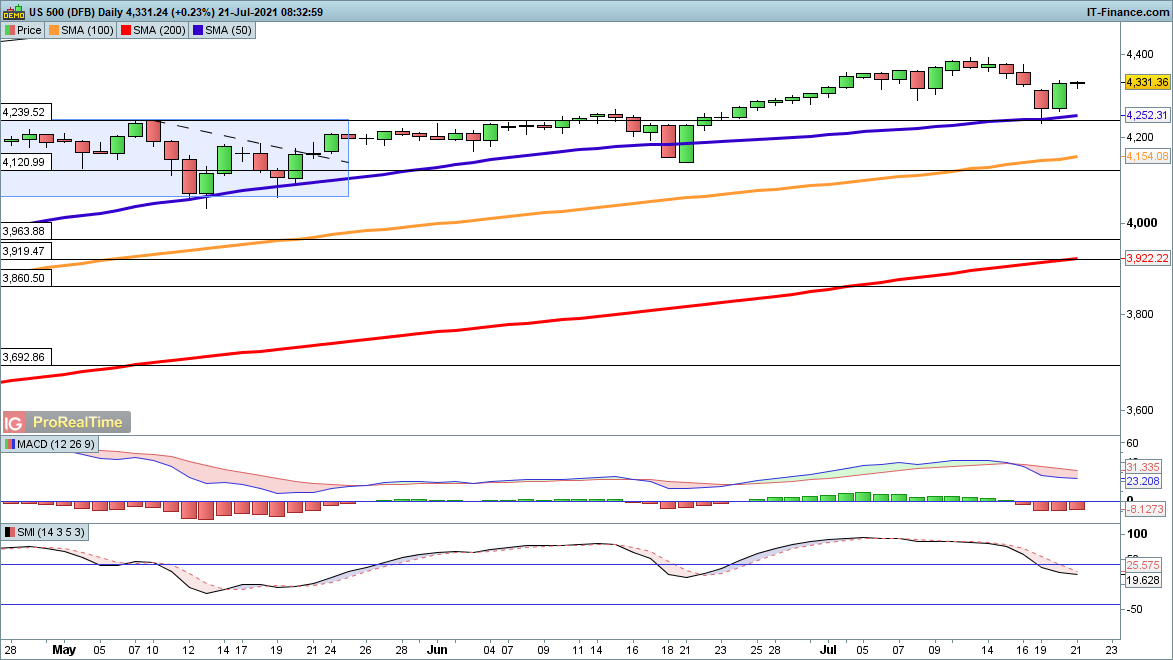
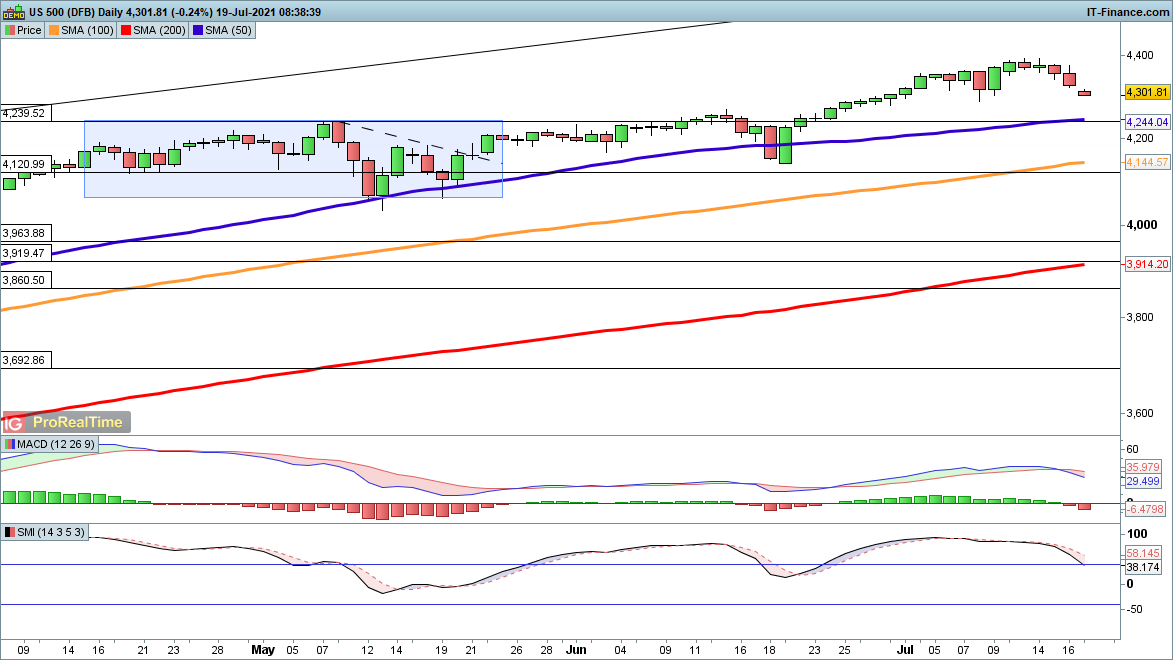
S&P 500
Traders will be asking if that was it for the S&P 500 in terms of the July selloff, after a Tuesday rebound that saw Monday’s losses recovered. This now puts the 4395 peak in sight.
Any more bearish view requires a reversal back below the 50-day SMA at 4252.
 Source: ProRealTime

See opportunity on an index?
-
For more up to date news on how markets will open, the latest earnings and economic news, watch IGTV live in the platform at 07:30am UK.

Today’s coverage:
Indices: Rebound short lived. Europe expected to slip at the start.
FX: DXY haven builds on 3½ mth high pushing GBPUSD down to January levels. AUDUSD & USD NOK at levels not seen since November 2020. EURUSD holds 117.72 support for a second day
Equities: NFLX little moved missed earnings. Awaiting RMG trading statement and earnings from JNJ & KO. ASML raises its sales growth target
Commods: Gold/Silver ratio at highest since November as AG slips, supporting a risk-off attitude to trading. Oil holds 2mth lows
-
Cryptocurrency News

The price of Bitcoin dropped below $30,000 for the first time since 22nd June on Tuesday morning as the selloff in cryptocurrencies deepened.
Other major cryptocurrencies were also trading lower with Ethereum below $1,800 and XRP below $0.53.
There was no major fundamental catalyst for the move lower in the cryptocurrency space but some analysts have cited the broad risk-off tone in the market as the reason for the latest leg lower.
Yesterday saw heavy selling pressure in equity markets across the globe, with the Dow Jones falling 2.1% and the FTSE 100 lower by 2.3%. However, European indices have shown some signs of recovery on Tuesday morning, with the FTSE 100 up 1.1% and the DAX up 0.9%.
Fears over the strength of the global economic recovery, amid the continued spread of the Delta variant, continues to weigh on riskier assets and there are few assets that are more risky than Bitcoin and cryptocurrencies.
When Bitcoin dropped below $30,000 last month, the retreat below the level lasted just a few hours before bouncing and returning above that level.
On a technical basis, the next level of support to the downside could be the $29,000 level before a test of the 22nd June low at $28,900.
Below that and some analysts are calling for a drop to as low as $20,000. However, some have argued that the lower price of Bitcoin and cryptocurrencies might attract increased institutional investment.
At 08:50BST, Bitcoin was trading at $29,800, down 5.8% in the last 24 hours. Ethereum was trading at $1,760, down 7% and XRP at $0.53, down 9%.
By Samuel Indyk, 20 July 2021. Investing.com
-
Gold and Brent crude weakening after initial rebound
Gold and Brent crude are losing traction following a period of stabilisation in the wake of Monday’s declines.
 Source: Bloomberg
Gold losing traction as it attempts to recover
Gold fell back into the 76.4% Fibonacci support level yesterday, with the price turning upwards from marginally above the prior swing-high of $1791.
While that managed to stave off a bearish breakdown signal, there is a risk of another move lower as price turns lower here. As such, the outlook will be better determined by a break through either $1791 (bearish) or $1834 (bullish).
 Source: ProRealTime
Brent crude easing back after initial Fibonacci support rebound
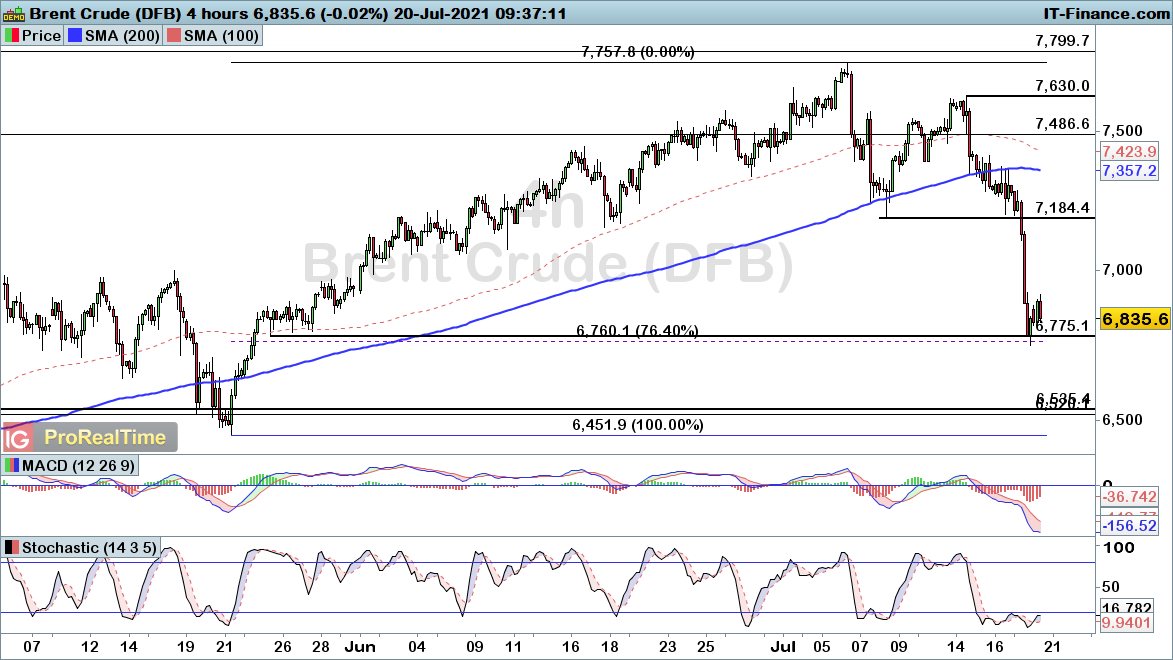
Brent crude found support on the 76.4% Fibonacci support level yesterday, following a sharp decline at the start of the week.
While that rebound did start to gain some traction at first, we are seeing some selling pressure come into play here. As such, the ability to remain above that $67.60 level will be key to determining where we go from here.
 Source: ProRealTime
-
Delta variant worries but markets mostly watch monetary policy and inflation

While the Delta variant has been spreading for several months now, investors now seem to be worried about the consequences for the recovery of economic growth.
Indeed, the number of cases in Asia but also in the United Kingdom or in other countries where vaccination campaigns are going well, could lead governments to order new restrictions, or even targeted lockdowns. Australia has also just announced that a third region is entering lockdown and that the one decided in Sydney will be postponed, although it was due to end today.
The number of daily cases at the global level published yesterday shows a high since last May, according to data from Johns Hopkins University.
Beyond the epidemic, it is the inflation data that worries investors, as the general rise in prices continues to accelerate and should lead, sooner or later, central banks to act to prevent an explosion of it.
To this end, we will follow the monetary policy decision of the European Central Bank on Thursday. Christine Lagarde will have to try to reassure the markets about the transitional effect of the rise in inflation, in order to justify a monetary policy that is still very accommodative, essential to the continuation of the upward trend in the markets over the past year.
The next FOMC will take place next week, followed by household consumer price data. A tense week is to be expected for markets.
This week other data will be closely monitored, with the manufacturing PMIs in both Europe and the United States and these could show a slight slowdown, although still firmly in expansion territory.
In the oil market, yesterday's sharp drop due to investor concern about the rise in the number of cases of the Delta variant coinciding with the announcement of the agreement on the Opec+ production increase seems to be calming down today.
But if the risks regarding the epidemic continue, it could lead to a further decline, as supply increases (OPEC+ agreement) and demand could find itself under pressure (Variant Delta) naturally leading to a downward price balancing.
On another topic, we will be paying attention to earnings season, as many S&P500 companies will release their figures for the first half of this week, including Netflix and Philip Morris on Tuesday, Johnson and Johnson, Coca-cola and Verizon communications on Wednesday or Intel, AT&T, American Express and Twitter on Thursday.
But next week will be the most intensive regarding earnings, with nearly 50% of the S&P500 in terms of capitalization publishing their results. Remember that next week will also be the week of the Fed's monetary policy decision and the PCE figures.
Finally, the cryptocurrency market will be monitored with great attention. The break of the $30,000 threshold, which kept hope of a possible rebound in the short term, has just been broken and this could lead to a sharp acceleration towards the $20,000 target.
The break of the $ 28,800, which served 2 times of support on the BTC, will be the important test and its crossing should lead to a return to the old historical high observed in 2017.
Vincent BOY
Market Analyst Paris, 20 July 2021
IG France
-
FTSE 100, DAX and Dow regaining ground after sharp selloff
FTSE, DAX, and Dow are back on a more positive footing after a sharp decline yesterday. However, risks remain after breakdown below key support.
 Source: Bloomberg
FTSE 100 rebounds from key support
The FTSE 100 saw dramatic losses yesterday, with the index falling to a three-month low in the process.
However, we are currently seeing a rebound from the key 6811 region, which represents both the March peak and May low. Despite this, the recent break below 6946 does provide a warning sign that we could see further weakness despite this current rebound.
As such, while we could see further short-term upside, a break through 7151 would be required to bring about a more reliable bullish outlook. Until then, this current rebound could falter as we move towards horizontal (69.46) and Fibonacci (7020-7070) resistance.
 Source: ProRealTime
DAX rebounds from Fibonacci support
The DAX has similarly experienced a bout of selling of late, with the index hitting a two-month low yesterday.
However, that selloff has taken us back into the 76.4% Fibonacci support level which held up as new support. Much like the FTSE, the subsequent rebound has now taken us back into the previous breakdown level (15304).
This will be a key line in the sand for us to break through if the index is going to continue its ascent. A break up through that level would signal a potential protracted move higher towards the 15522-15634 deep Fibonacci zone.
 Source: ProRealTime
Dow Jones on the rise after sharp slump into Fibonacci support
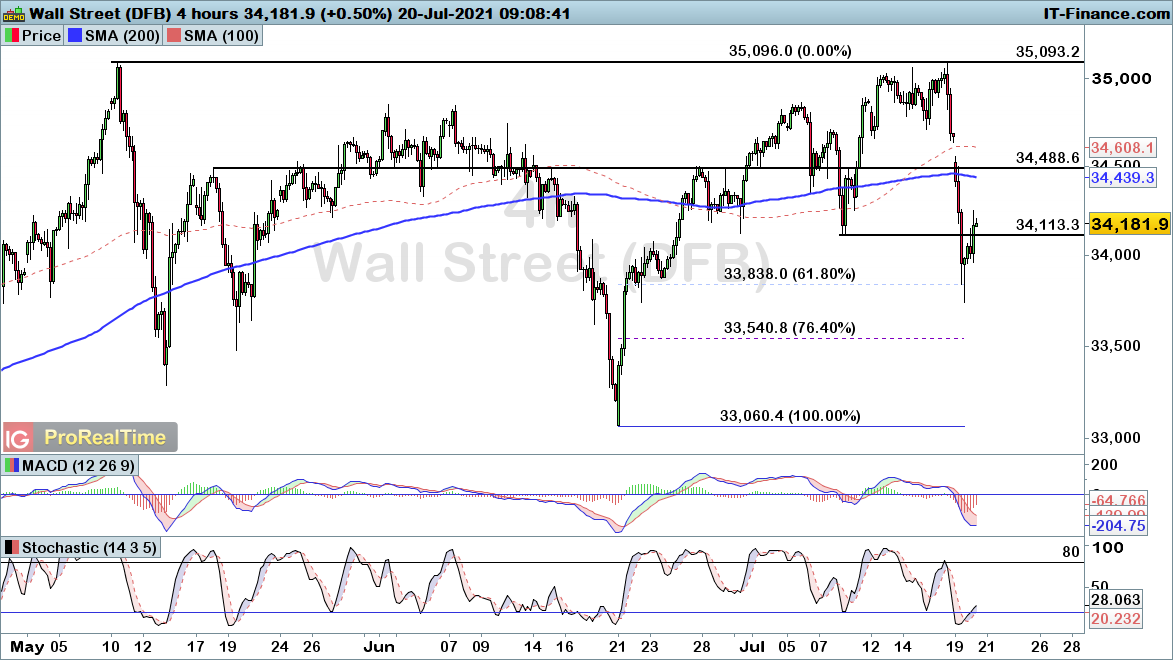
The Dow fell back below the 34113 support level yesterday, with price retracing into the wider 61.8% threshold at 33838.
With a clear long-term uptrend still in play, this latest pullback looks likely to resolve with a move higher unless we see a break below the June low of 33060. As such, there is a good chance we could see the index bottom out here.
However, we should also be aware of the risk that price falls back towards the 76.4% Fibonacci support at 33540. For now, it looks likely we will see further upside to retrace more of the ground lost since Friday’s peak of 35093.
 Source: ProRealTime
-
IBM Earnings, Revenue beat in Q2
 © Reuters. IBM Earnings, Revenue beat in Q2
Investing.com - IBM (NYSE:IBM) reported on Monday second quarter earnings that beat analysts' forecasts and revenue that topped expectations.
IBM announced earnings per share of $2.33 on revenue of $18.75B. Analysts polled by Investing.com anticipated EPS of $2.32 on revenue of $18.29B.
IBM shares are up 9% from the beginning of the year and are trading at $140.75 , down-from-52-week-high.They are under-performing the S&P 500 which is up 13.46% from the start of the year.
IBM shares gained 1.96% in after-hours trade the report.
IBM follows other major Technology sector earnings this month
IBM's report follows an earnings missed by Taiwan Semiconductor on Thursday, who reported EPS of $0.929 on revenue of $13.35B, compared to forecasts EPS of $0.9296 on revenue of $13.23B.
Accenture had beat expectations on June 24 with third quarter EPS of $2.4 on revenue of $13.26B, compared to forecast for EPS of $2.24 on revenue of $12.81B
-
For more up to date news on how markets will open, the latest earnings and economic news, watch IGTV live in the platform at 07:30am UK.
Today’s coverage:
Volatility hits 2mth high as markets crushed by Covid fears
Indices: Europe & US trading today’s 24hr mkts at yesterday’s closing lows NKY and ASX initially fell but now seeing some buying
FX: USD safety choice at 3½ mth high. EURUSD testing 117.72 support. GBPUSD testing 136.70 support. Cmdty FX continue to break new short ground
Equities: BLT down 2% in Aus on update, UBS beats Q2 ests. Awaiting EZJ. IBM stk up 4% on strongest rev in 3yrs. NFLX today. AAPL delays return to work on Covid. COIN the way to play BTC below $30k
Commods: Brent crashes below $70 on demand worries. Gold initially down but ended holding its ground. Base metals and Lumber up
-
Alphabet has made huge gains over the past year, and has found a new lease on life as money flows back into growth names. But will earnings meet already-high expectations?
 Source: Bloomberg
When does Alphabet report earnings?
Alphabet publishes its most recent earnings on 27 July.
Alphabet earnings – what to expect
Revenue is expected to rise 46% to $56 billion, while earnings per share (EPS) are forecast to rise 90% to $19.26.
Advertising revenue continues to be the main slab of revenue for Apple, allowing it to fund loss-making expansion in areas such as cloud-computing, in which it competes with Amazon and Microsoft. For Alphabet, regulatory scrutiny continues to loom large, and will continue to be a major headache in coming quarters. But while fines may keep coming, they still amount to a drop in the ocean in terms of Alphabet’s revenue, and if not accompanied with real regulatory action, will represent only a passing trouble in the longer term, an excuse for regular selloffs but not a fundamental change in direction.
Alphabet – valuation and broker ratings
Like others in the growth/tech space, Alphabet continues to trade on a relatively high price-to-earnings (P/E) ratio, at 32.11, with no dividend yield at present. Brokers rate Alphabet highly, with 16 ‘strong buys’ and 28 ‘buys’, and just two ‘hold’ recommendations.
Alphabet share price
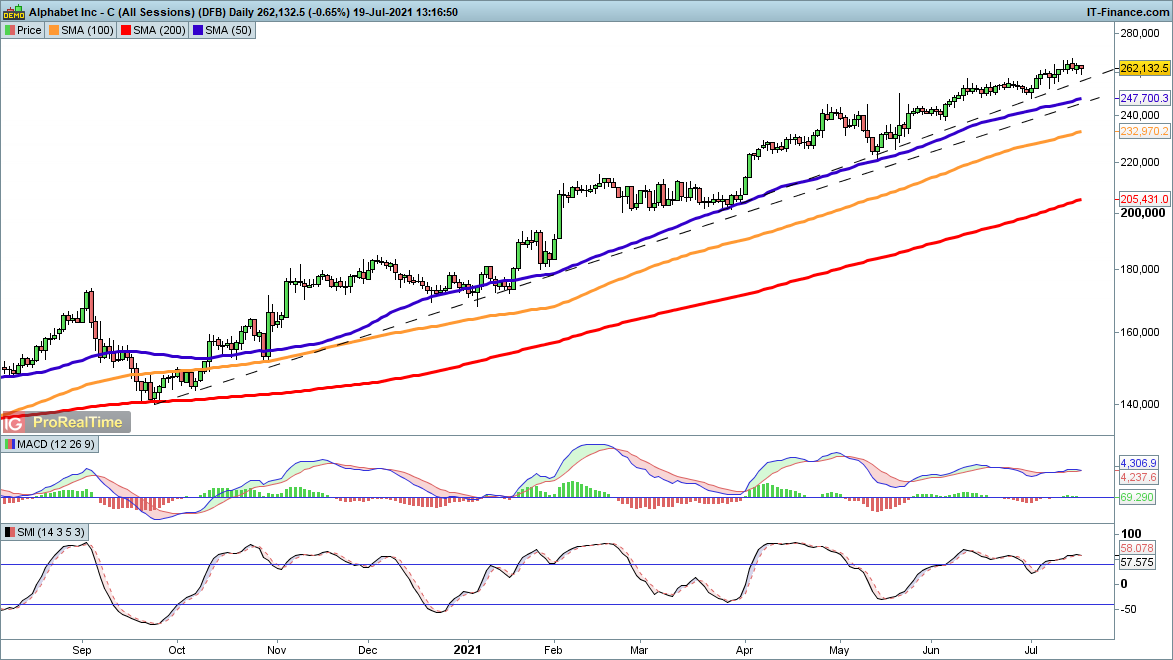
Alphabet seems unstoppable, having enjoyed a tremendous rally since September. Dips have been bought repeatedly, and since May a steady and quiet rally has provided very little chance for dip buyers to get involved. The price sits close to a new record high, having bounced in early May from the 50-day simple moving average (SMA), currently $2470. It is unlikely that this quiet rally will go on forever, so some caution might be warranted now, but with a clear eye on the steady trend.
 Source: ProRealTime
Alphabet strides ahead
Fundamentals and technicals continue to back Alphabet, with the ad business powering expansion elsewhere. Growth stocks are still in high demand, and the recent inflow back into tech stocks since May seems to suggest a return to growth stocks after the ‘value’ mania of the early part of 2021.
-
Find out what to expect from Boeing’s earnings results, how they will affect Boeing share price, and how to trade Boeing’s earnings.
 Source: Bloomberg
When is Boeing’s results date?
Boeing is expected to report its second quarter earnings on Wednesday, 28 July, before the market open.
Boeing share price: forecasts from Q2 results
The focus since the start of the year has been on the reflation and reopening trade, and while the second quarter (Q2) saw fresh record highs for the Wall Street, it hasn’t translated into price gains for Boeing, the aircraft manufacturer whose share price is hardly up since the start of the year and definitely down since the start of last quarter, and as of late an underperformer of the key index.
International travel, while picking up in comparison to last year remains tested globally, and more specifically in regions that have yet to fully re-open, and that’s not including current (or future) Covid-19 variants keeping lockdowns in place, or forcing governments into increasing restrictions.
There’s plenty to digest that’ll be factored into future earnings, as the latest hasn’t been positive for the airplane maker, cutting its delivery target for the 787 Dreamliner planes and reducing production rates temporarily on a new defect that will force it to spend more time on those within its inventory yet to be delivered. There’s also the partial cancellation of the 737 MAX order from flydubai.
The positives for the past quarter have been that deliveries have no doubt improved with the first half 156 planes, nearly the amount for all of last year, also picking up on the orders front thanks to the 270 order from United Airlines, 200 of which going to Boeing’s 737 MAX. Big orders don’t translate into bigger profit margins however and especially when significant bulk orders from a few key airlines gives the latter the negotiation power, a theme to note in what remains a tested industry that’s still very much vulnerable.
So what about the numbers?
Earnings per share (EPS) haven’t been positive since the last quarter of 2019, and that trend of negative figures look set to continue for an EPS reading averaged at -$0.72, not as bad as losses suffered in recent quarters, but a figure below zero nonetheless. And, there have been plenty of cases where actual numbers veered far from expectations. Revenue is expected to move higher from $15.2 billion to nearly $18 billion. Its share price is near the lower end of price targets from analysts, testing their majority buy recommendations (source: finance.yahoo.com).
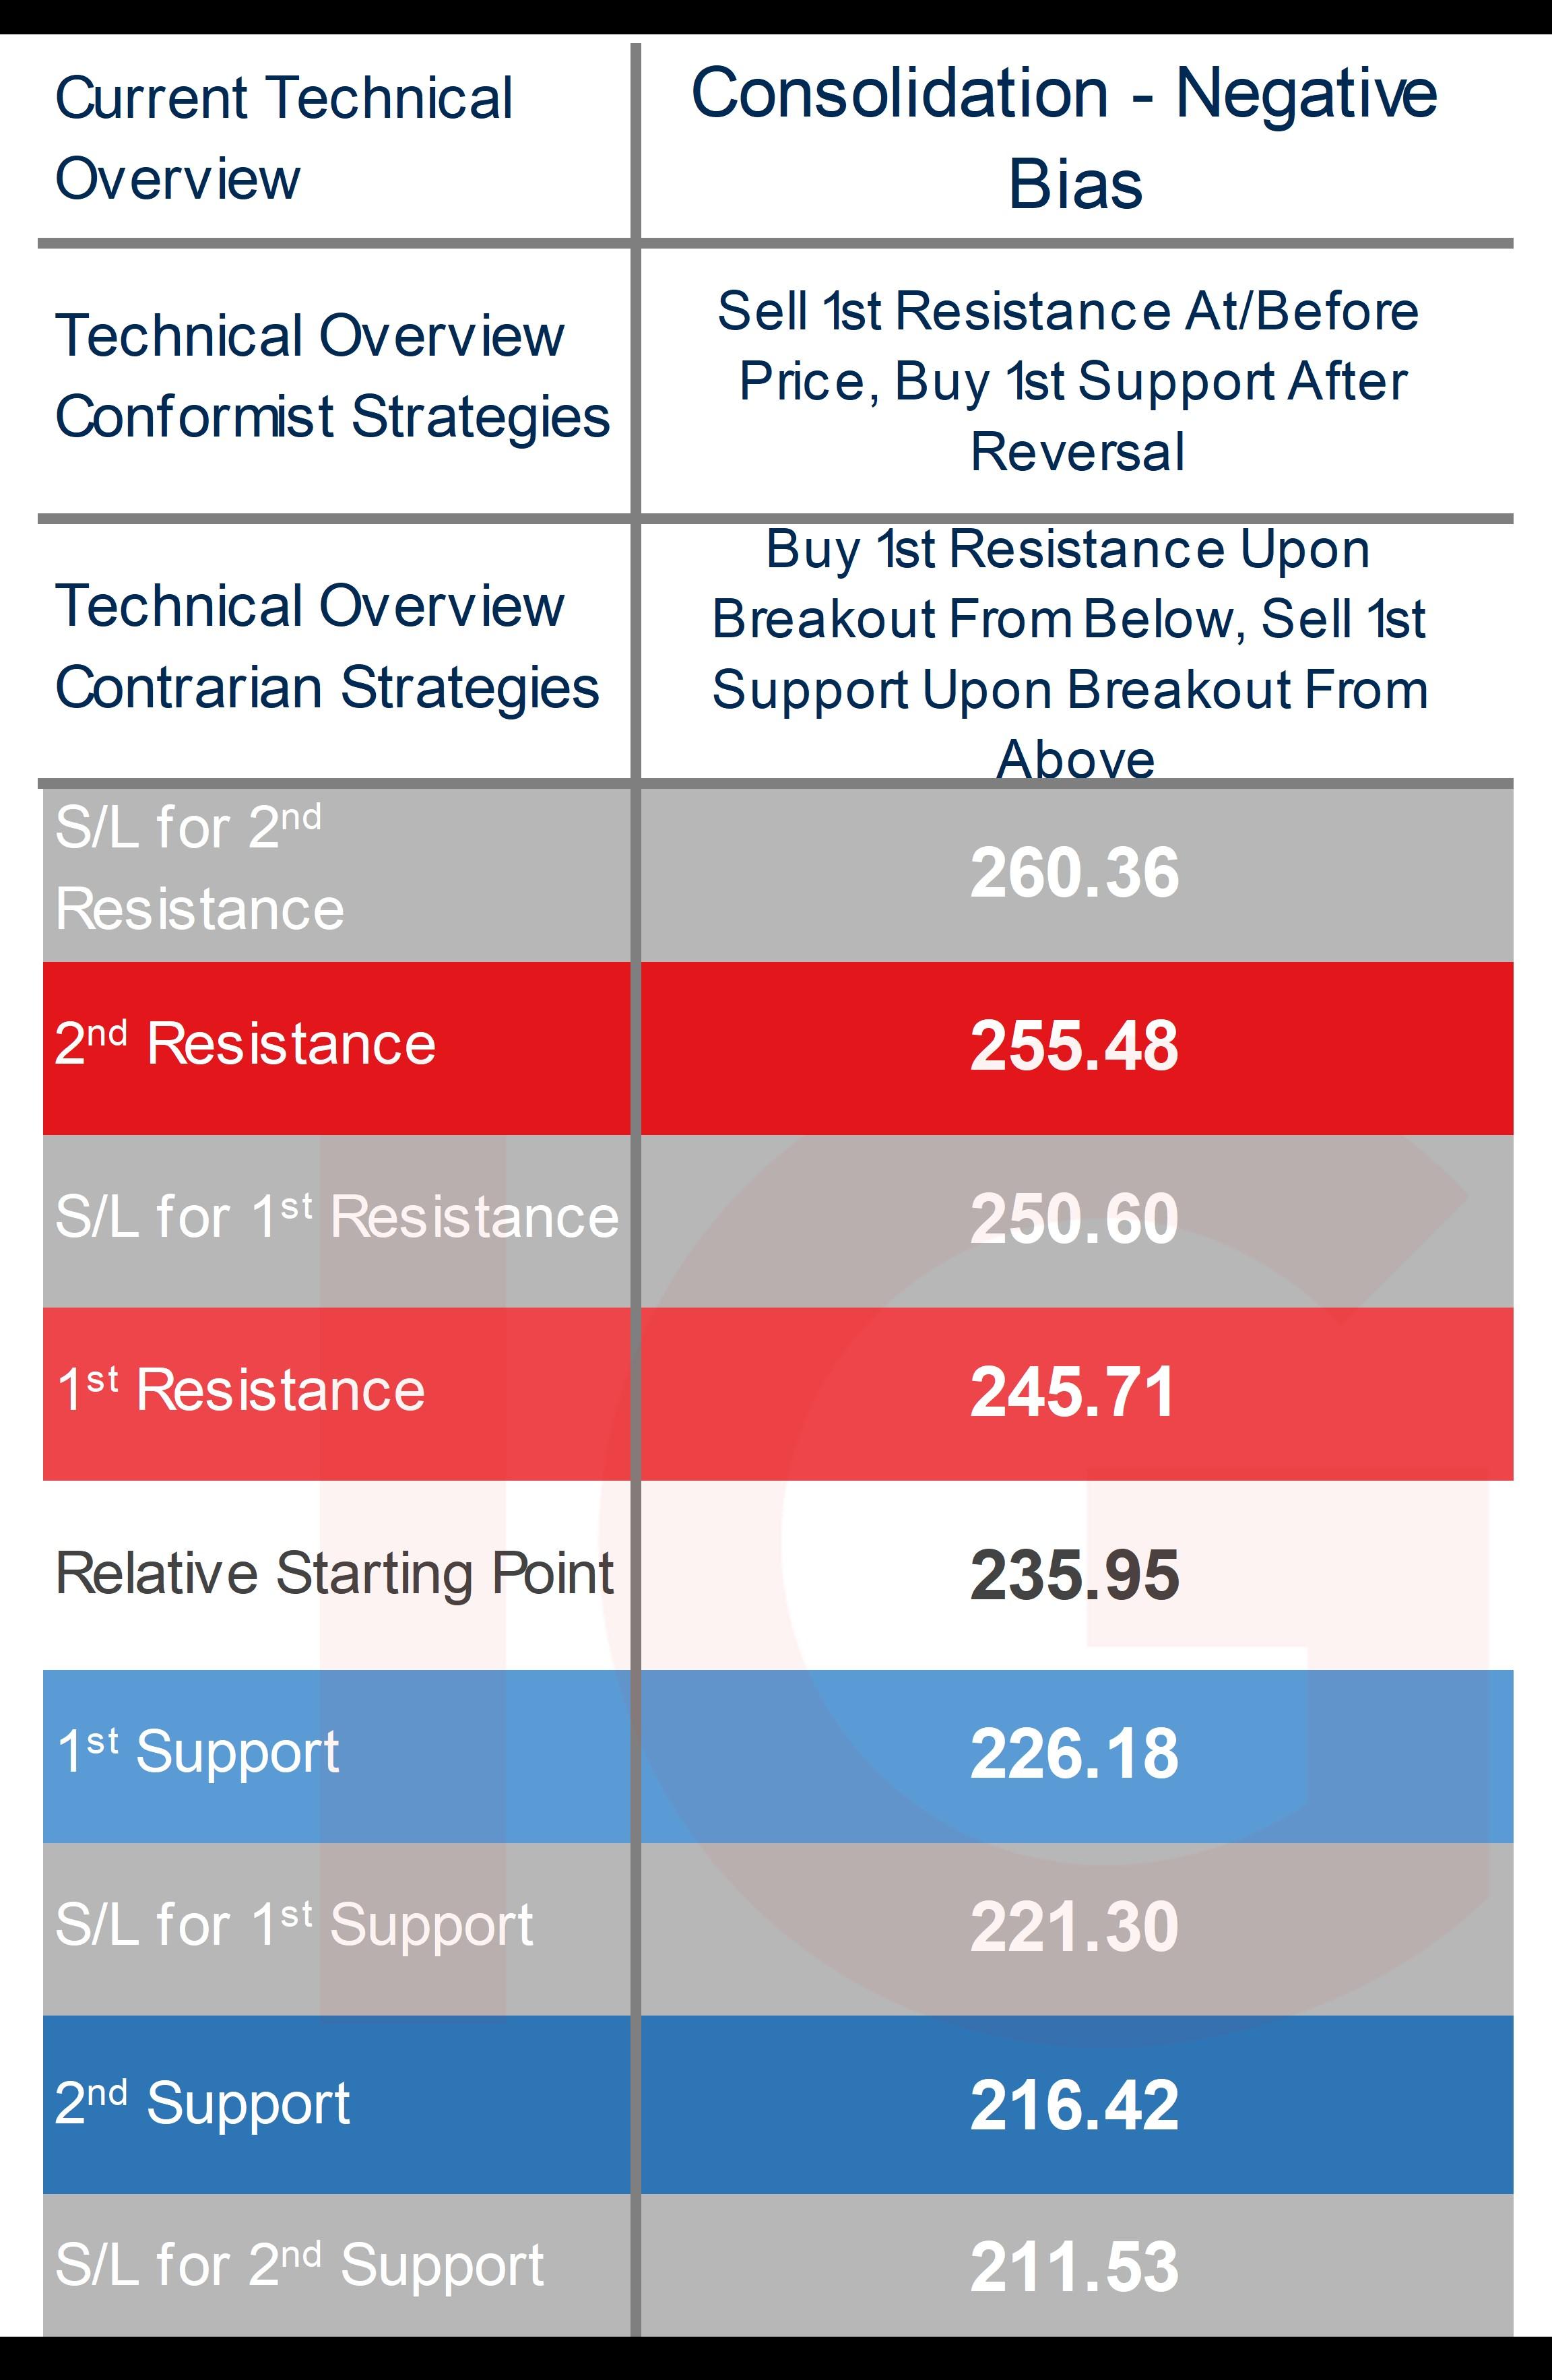
Trading Boeing’s Q2 results: technical overview and trading strategies
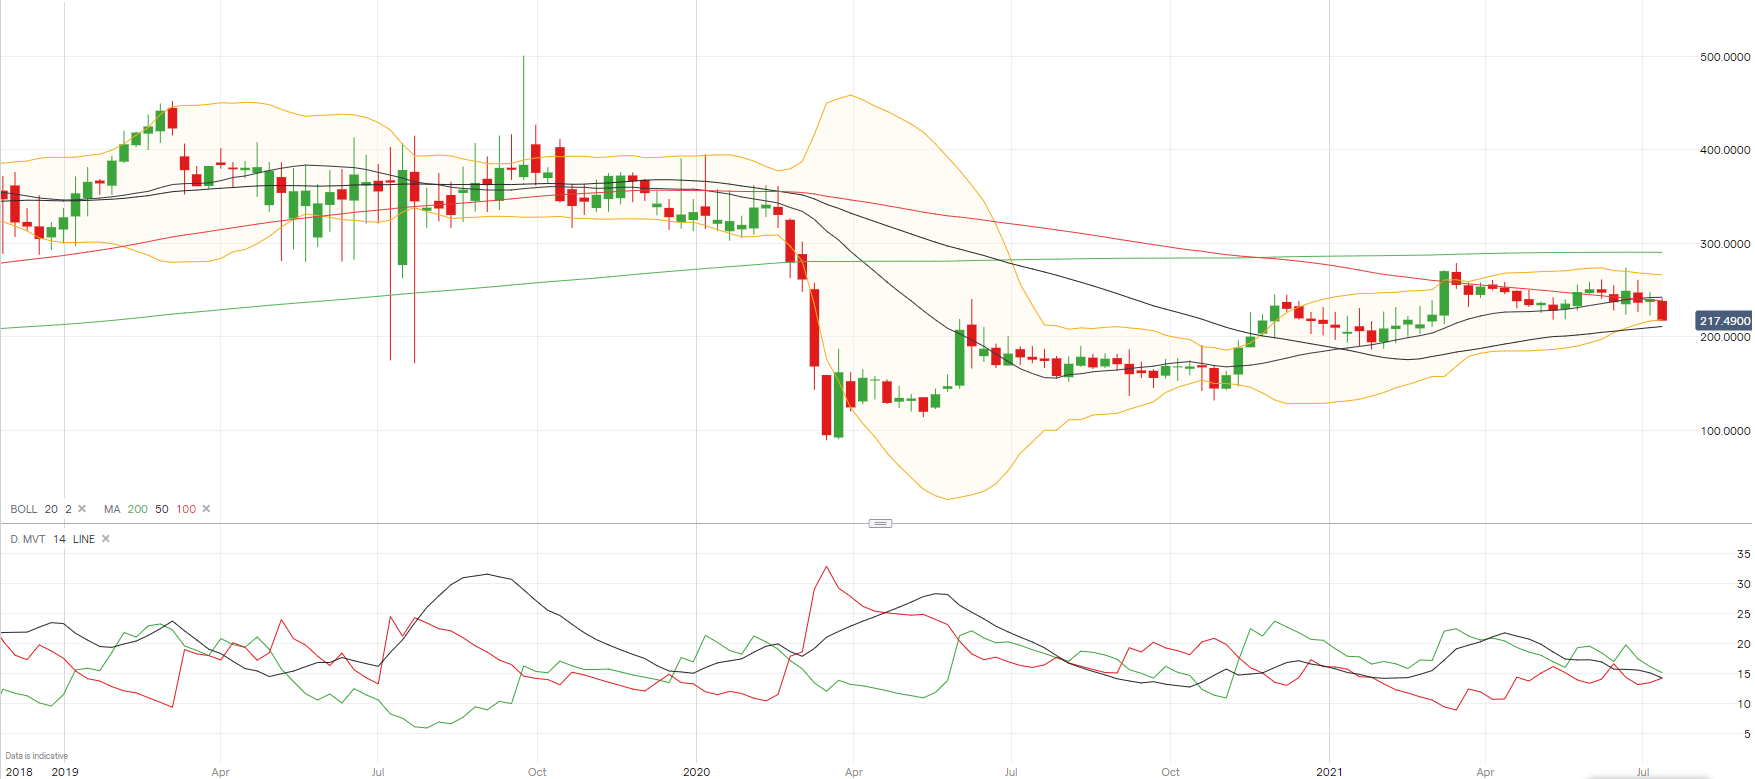
Technicals hold far less relevance when it comes to fundamental events, and that means levels likelier than not to break even if we’re looking at the mid-term weekly overview as opposed to the short-term daily, the latter having little chance of levels holding on any volatile moves.
A brief glance at the weekly chart below and its looking weak, prices beneath its key long-term moving averages (MA), which is the 50, 100, and 200-day MA’s, and at the lower end of the Bollinger band, its average directional movement index (ADX) not trending just yet with a reading that’s been dropping. It’s looking far worse on the short-term daily technical overview, most of its key technical indicators in the red and with an ADX that has tilted into trending territory, a classification more befitting of a stalling bear trend. More bearish movement will be needed to shift the overview in the weekly time frame to match that of shorter-term time frames, for now consolidatory but with negative technical bias.
Fading strategies are at greater risk of getting stopped out and puts one of the conformist strategies into the riskier category, and those looking to sell into price gains can consider selling after a reversal due to volatility from the fundamental event, contrarian breakout strategies on any persistence in the move outperforming should it translate into a trend move thereafter.
 Source: IG
Boeing weekly chart
 Source: IG charts
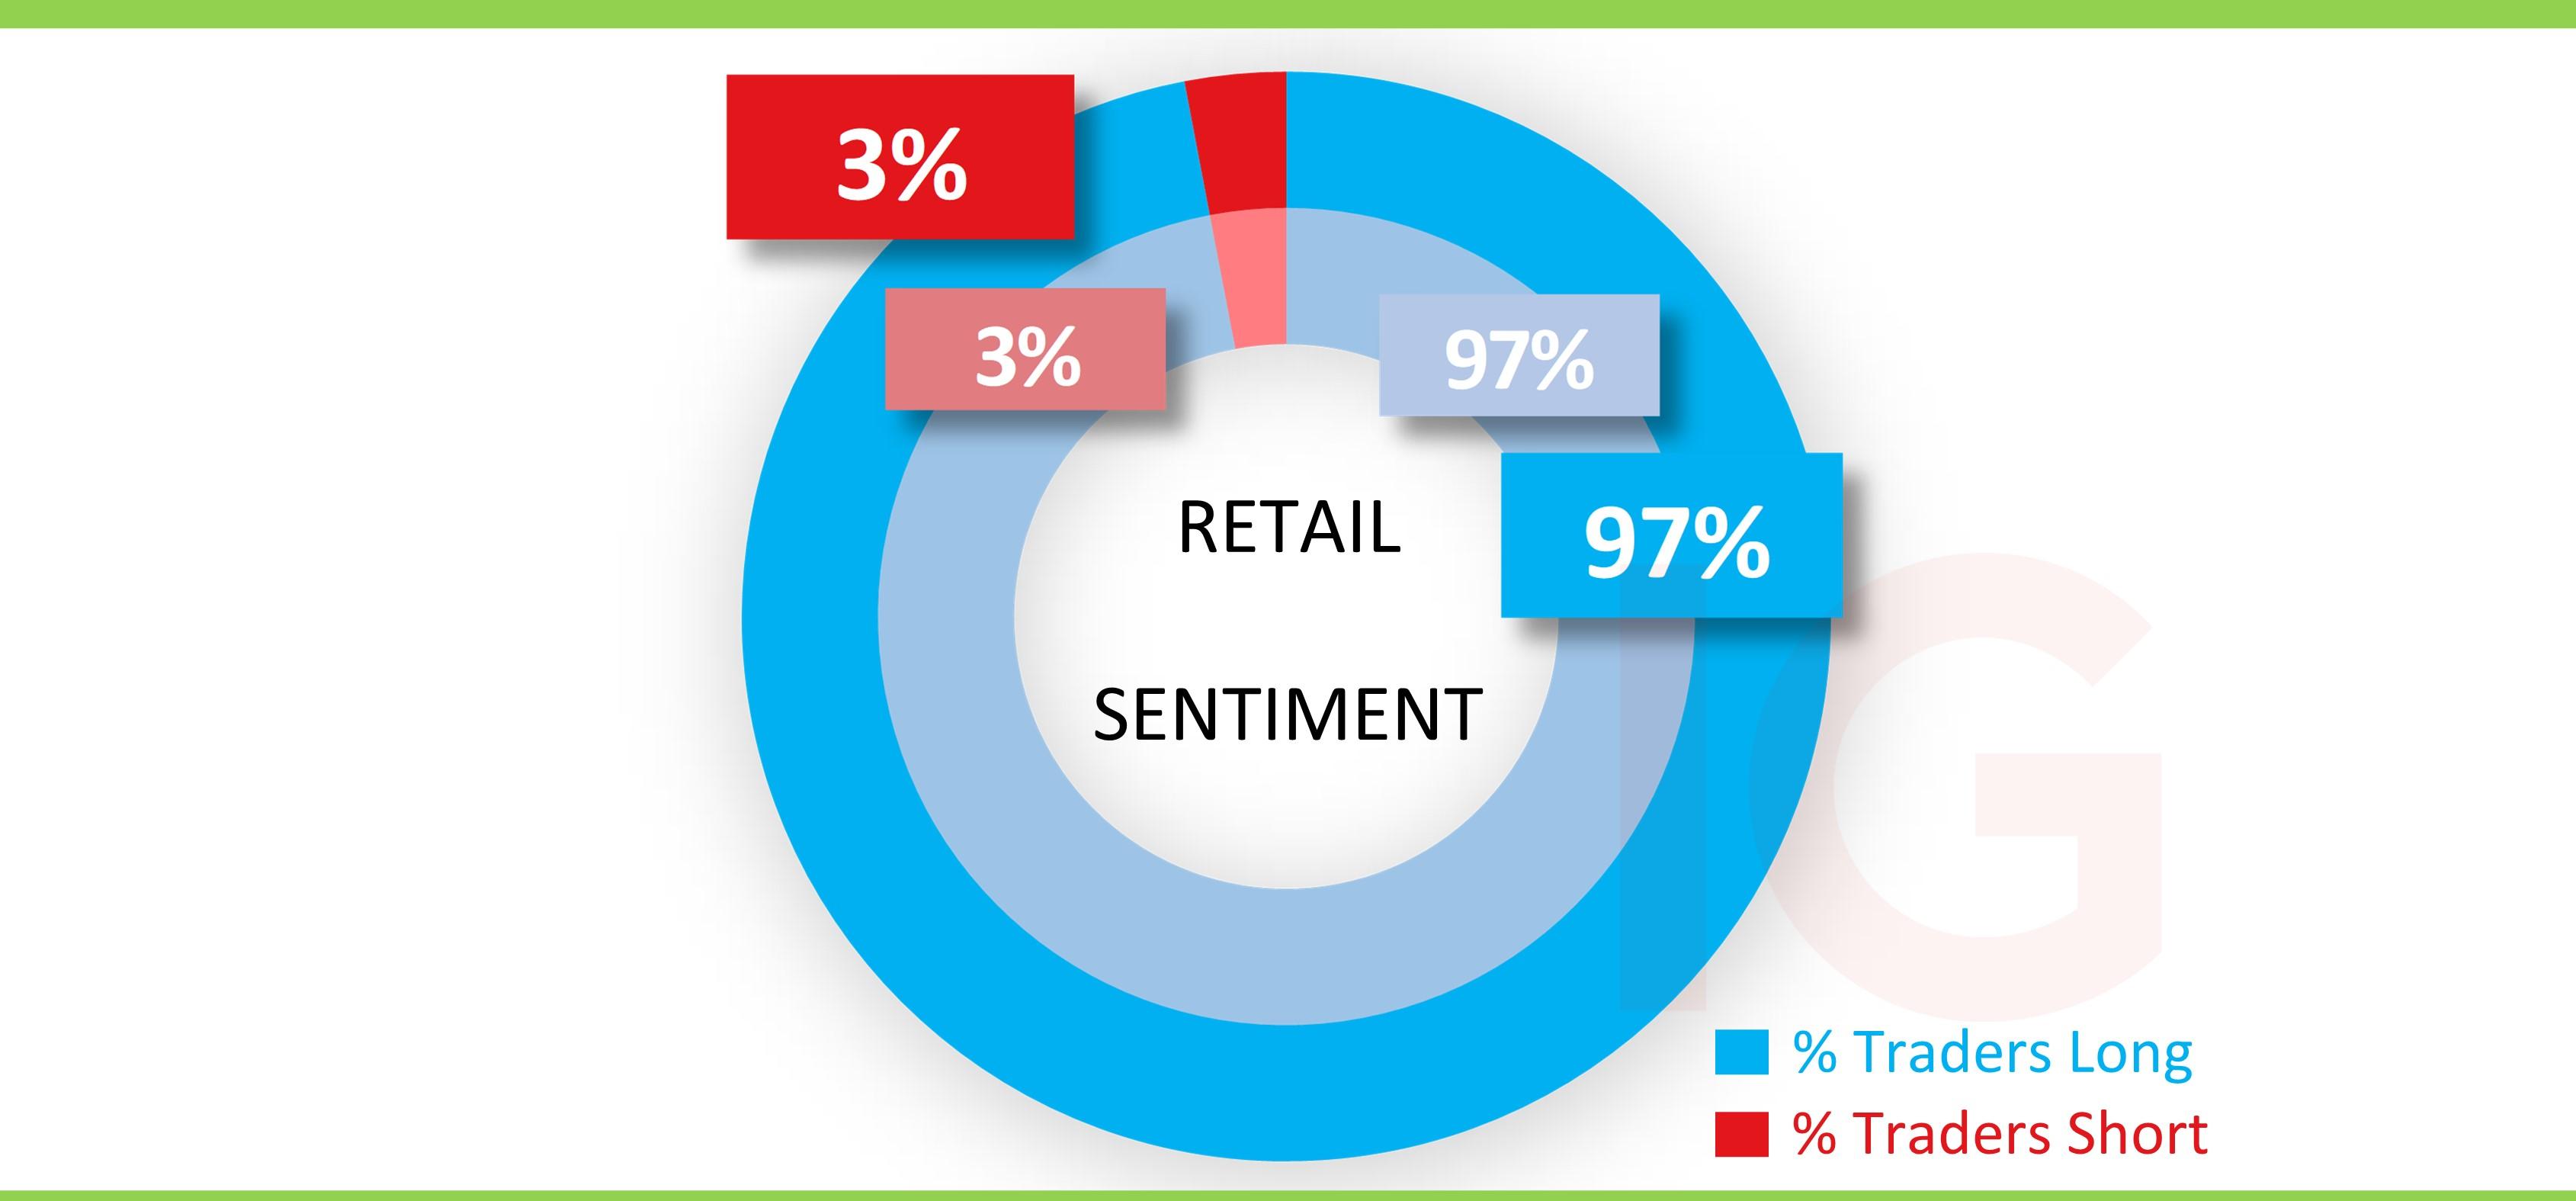
IG client sentiment* and short interest for Boeing shares
Retail bias has been a consistent extreme buy and unchanged since the start of last week at a staggeringly high 97%, overall beneficiaries on the recovery from sub-$100 pandemic lows but tested as of late on the pullback in its price from over $273 a month ago to below $220 at the end of last week.
When it comes to short interest (according to shortsqueeze.com), its far less than that of say Tesla, for Boeing at only 1.61% of the float on 9,410,000 shares shorted from a total of 584,090,000 shares floated, dropping from 10 million prior.
 Source: IG
*The percentage of IG client accounts with positions in this market that are currently long or short. Calculated to the nearest 1%, as of this morning, 8am, for the outer circle. Inner circle is from the previous trading day.
-
After a stellar year, Microsoft looks well-positioned for further growth and further gains in its shares.
 Source: Bloomberg
When is Microsoft earning’s date?
Microsoft reports earnings on 27 July.
Microsoft earnings – what to expect
Microsoft is expected to report revenue of $44 billion, up 16%, while earnings per share (EPS) are expected to rise 30% to $1.90.
Earnings season this time rolls around when Microsoft stock has already hit a new record high. The last set of quarterly results beat forecasts, accompanied by strong guidance for the remainder of its year, together with the largest overall growth in revenue since 2018. Growth prospects for its key cloud computing division look good, after a year in which its share of the SaaS market rose to 19.7%. Other parts of the group, including its Dynamics business, are also increasing market share and projecting a further shift towards a subscription-based model.
Microsoft earnings – valuation and broker ratings
At 38 times earnings and with a yield of 0.8%, Microsoft is hardly a bargain. But it is still a quality stock, with good growth in earnings expected, and solid momentum behind the share price.
Unsurprisingly, Microsoft remains popular with brokers, with 37 ‘strong buy’ or ‘buy’ recommendations and just two ‘holds’, with no sell recommendations.
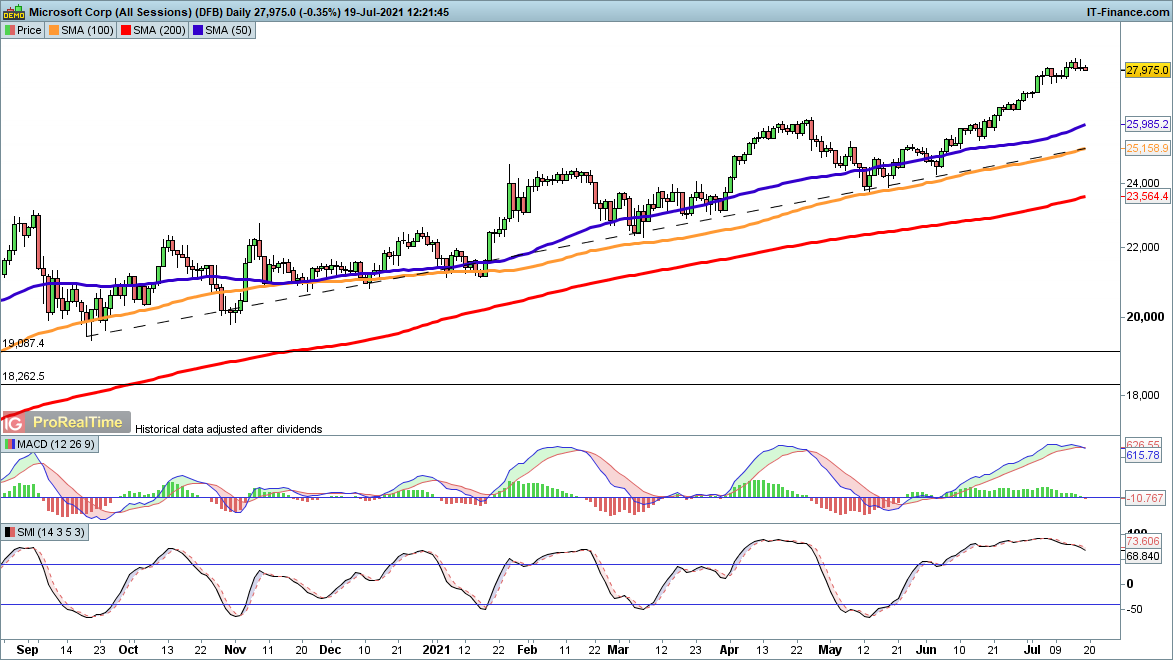
Microsoft shares – technical analysis
After the plunge of early 2020, Microsoft shares have recovered their poise, rallying steadily since April and showing no sign of slowing down. Repeated higher highs and higher lows have maintained the trend, and the price is still holding firmly above the 50-, 100- and 200-day moving averages (DMA). Trendline support from late September is some distance away, and after a 17% rally from the May low some consolidation and weakness might not be surprising.
 Source: ProRealTime
A solid performer, with more to come
This is a market that looks for quality in its winners, and Microsoft falls squarely into this category. Revenue growth is strong, the group has a solid plan for the quarters to come and the stock price continues to rally. So far, there seems little sign of a major shift in performance or sentiment.
-
-
EUR/USD, GBP/USD and USD/JPY head lower, as havens gain ground
EUR/USD and GBP/USD head lower as the dollar strengths, although USD/JPY is also on the back foot as traders favour yen as a haven.
 Source: Bloomberg
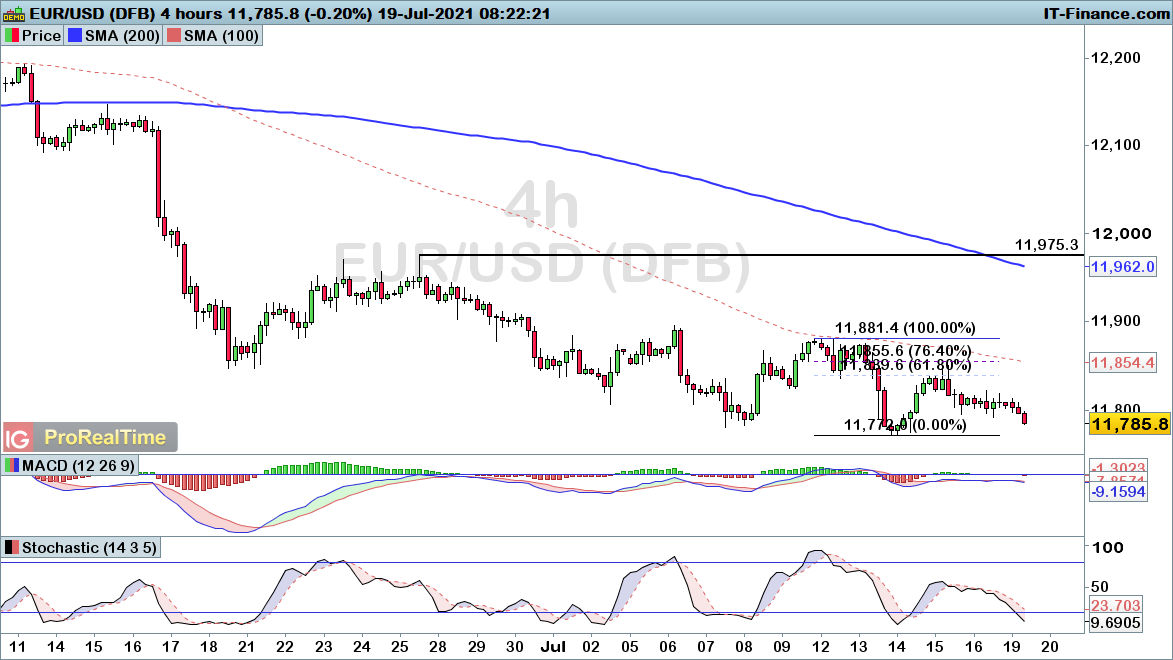
EUR/USD heading lower after recent retracement
EUR/USD is heading back down towards the $1.1772 support level this morning, with the pair building on the recent downtrend to post yet another deep retracement and subsequent sell-off.
With that in mind, we are looking for further short-term downside here, with a break up through the prior swing high of $1.1881 required to negate the ongoing bearish outlook.
 Source: ProRealTime
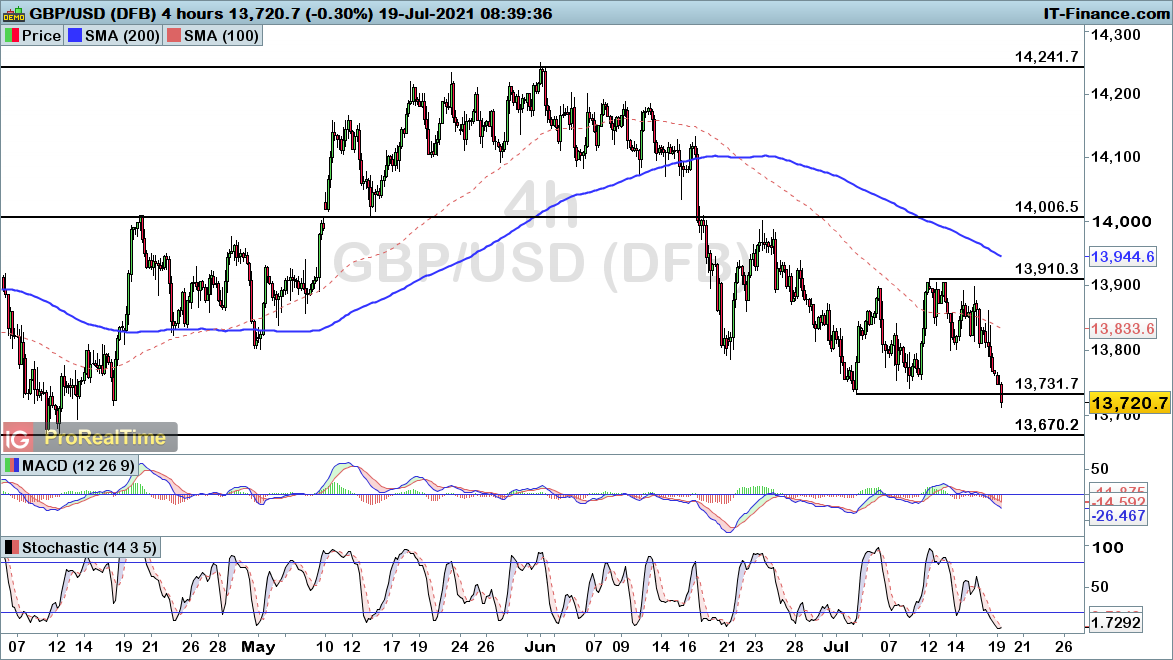
GBP/USD breaks support to bring three-month low
GBP/USD has slipped below $1.3731 this morning, with the selling pressure seen on Friday carrying into a new week. That break brings us a fresh three-month low, although we could go further than that if price manages to break below $1.367.
That support level represents the next major threshold to overcome, below which we would be looking t a five-month low. For now, the break below $1.3731 provides a bearish continuation signal, with a rise through $1.391 required to bring a more bullish view.
 Source: ProRealTime
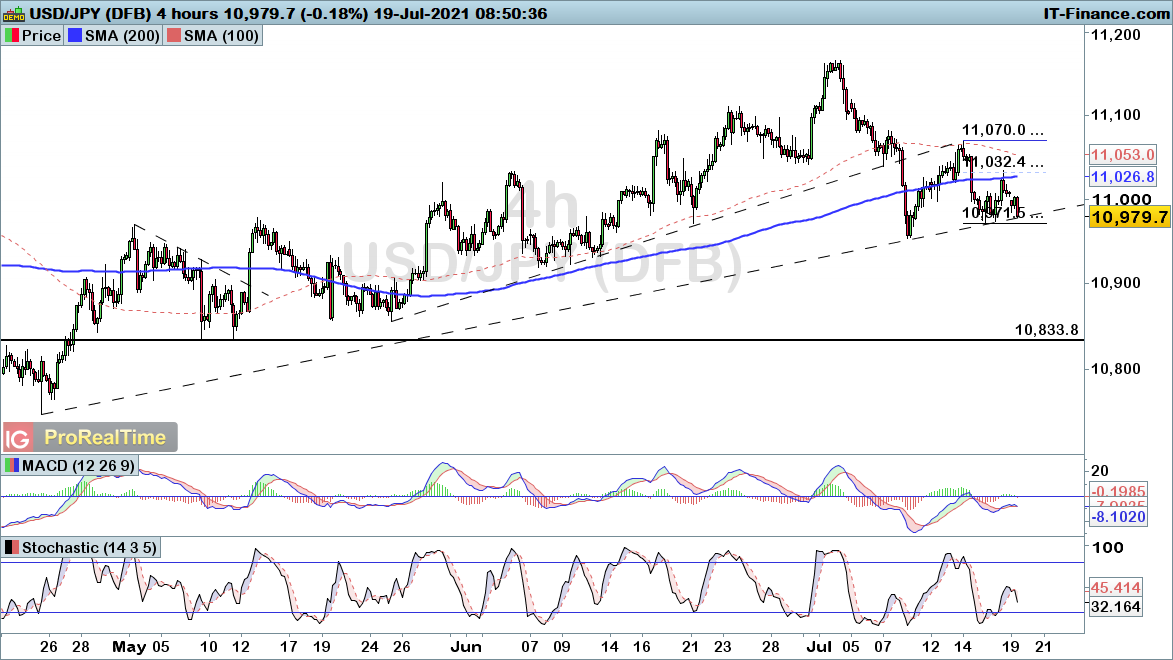
USD/JPY falls back towards key support
USD/JPY has slipped back into trendline support, following a failed rebound which ended at the 61.8% Fibonacci resistance level. The subsequent pullback has taken us back down into a confluence of ¥109.71 and trendline support.
That looks likely to bring another bout of significant losses if broken. As such, watch for a move back below the ¥109.71 level to provide a fresh bearish outlook for the days ahead. Conversely, a break up through the ¥110.70 level would be required to bring a more positive outlook for the pair.
 Source: ProRealTime

See an FX opportunity?
-
 2
2
-
-
Gold stumbles as oil edges down
Gold prices are attempting to recover from the recent downward move, while oil’s current pullback has reached the 50-day moving average.
 Source: Bloomberg
Gold
Gold's rally has encountered a serious check, stalling at $1830 and dropping back towards $1800.
This is a possible lower high, but it may still be too early to tell. Further declines below $1800 would reinforce the negative view, while a bounce back above $1815 would begin to provide hope that the brief pullback is at an end.
 Source: ProRealTime
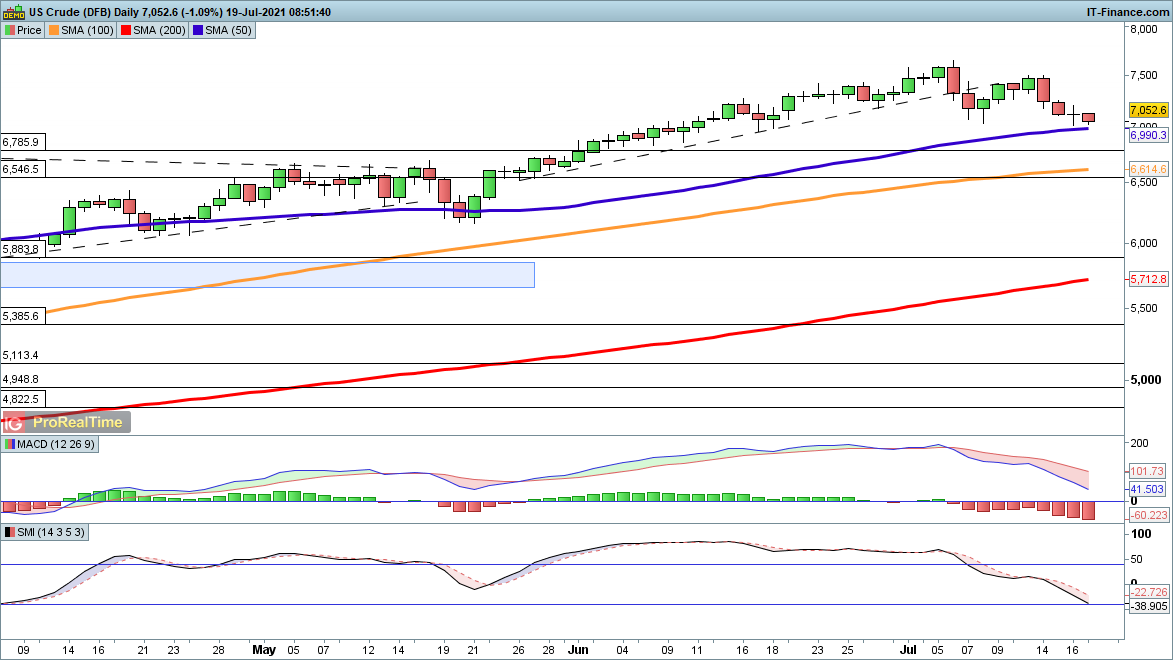
WTI
Oil has returned to the 50-day simple moving average (SMA) at $69.90, after a run higher from late May that saw it reach fresh three-year highs.
This retracement establishes a potential higher low in due course, since the uptrend is firmly intact. Further declines below $69.90 would head towards $67.85 and then $65.46.
 Source: ProRealTime
-
Indices still on the back foot after recent losses
Stock markets are struggling as a new week gets underway, with European markets in the red in early trading.
Source: Bloomberg
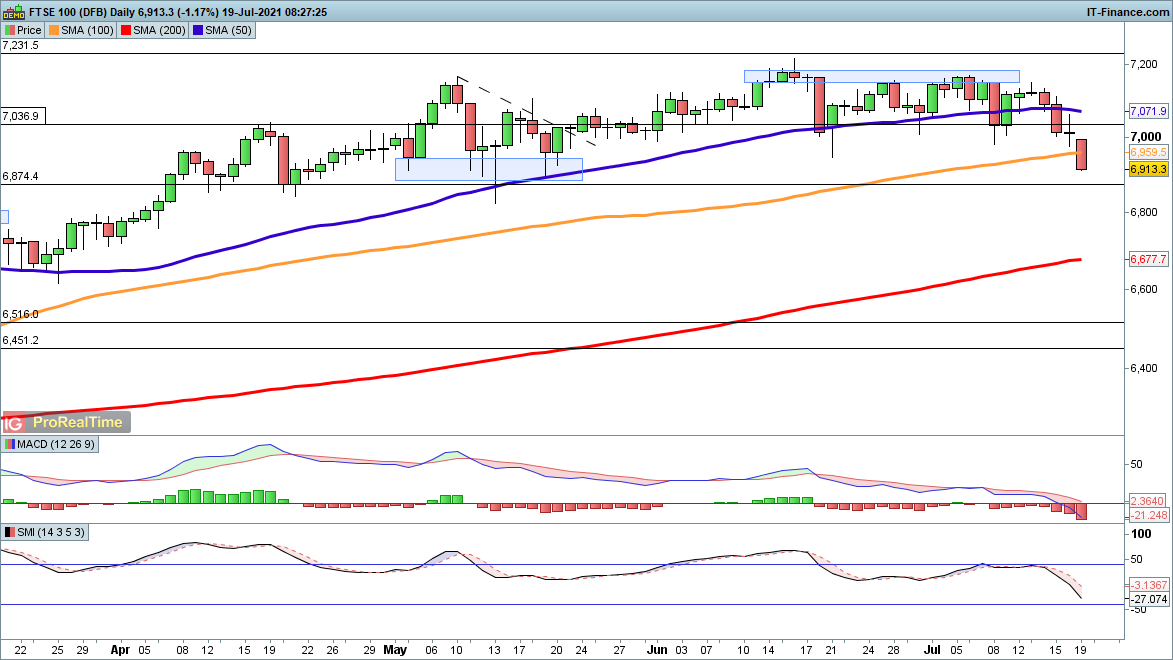
FTSE 100
Friday’s decline has resumed today, with the FTSE 100 at its lowest level since mid-May.
After stalling below 7200 since mid-June there is now a full-blown retracement underway. The first area of support to watch is 6875, a region crucial in April and May. Below this 6600 could potentially come into play.
Dip buyers will want to see a recovery above 7000 to establish a higher low.
 Source: ProRealTime
DAX
Three days of notable losses still leave the DAX heading towards the 15,278 lower bound of the recent trading range. A break below this brings 15,000 into view, with dips just below this around 14,950 finding buyers back in April.
As yet the buyers do not appear to have any ability to hold back this market from further declines.
 Source: ProRealTime
S&P 500
The S&P 500 has gapped lower and is looking to push back towards the 50-day simple moving average (SMA), currently at 4244.
Since late January pullbacks have either found support at the moving average or have briefly pushed below it before rebounding. Buyers will be watching to see if the same thing occurs this time.
 Source: ProRealTime
-
For more up to date news on how markets will open, the latest earnings and economic news, watch IGTV live in the platform at 07:30am UK.
Today’s coverage:
16mths on from 1st lockdown UK ‘celebrates’ Freedom Day with a certain amount of trepidation
Indices: Europe expected down after declines in US and in Asia NKY on for lowest close since January
FX: Commodity currencies short trade continues. This week minutes from BoJ & BoC. ECB rate decision on Thursday
Equities: ZOOM buys FIVE9 for $14.7bln. Earnings IBM ahead of a big week for tech
Commods: Oil down as OPEC+ agrees to supply market with more oil. No let up in short trade around Lumber. Gold little moved from Friday’s lows
-
crowded longs in crude oil - might signal a difficult time in the short term for further gains

-
OPEC Shoots Itself In The Foot

OPEC’s non-action leaves the world wondering and production policy in question - Three reasons the oil price may still head a lot higher
OPEC cannot get its act together. With no agreement on production policy for the coming months, the cartel members appear to be on their own. While discussions will continue, the gulf between the UAE and other members, including Russia, could be too wide to bridge. The cartel’s future could hang in the balance of a compromise at a time when the United States handed the group the pricing power in the petroleum market on a silver platter.
Crude oil’s price action in the wake of OPEC’s discord is impressive. At least three factors could send the price a lot higher over the coming months and years:
- The Fed may continue to call inflationary “transitory,” “temporary,” or anything else other than what it is, the legacy of a tidal wave of central bank liquidity and a tsunami of government stimulus. Inflation is bullish for all commodities, and crude oil is no exception.
- The conflict between the UAE and other OPEC members and Russia is a microcosm of the turbulent state of the Middle East. The region is home to over half the world’s petroleum reserves. With US output declining because of the greener path for US energy policy, any events that disrupt supplies, refining, or logistical routes in the area could dramatically impact oil’s price. Crude oil has become a lot more sensitive to events in the Middle East with the Biden administration in the Oval Office.
- NYMEX crude oil futures moved marginally above the October 2018 to the highest price since 2014. The price remains a stone’s throw away from the highs, which could be a gateway to triple-digit oil prices.
OPEC tried to shoot itself in the foot at the latest biannual meeting, but US energy policy pushed the foot out of the line of fire. OPEC looks likely to squeeze US consumers with higher prices despite the cartel’s incompetence.
Meanwhile, on July 14, news that OPEC+ reached a provisional agreement to taper the production cuts by 400,000 bpd with a compromise that allows the UAE to increase output from 3.2 mbpd to 3.65 mbpd starting in April 2022 weighed on the oil futures market. While crude oil is overdue for a downside correction, the strength of demand is likely to lead to a higher low. US producers have been increasing output, but the shift in US energy policy likely created a supply ceiling as fossil fuel production runs contrary to the Biden administration’s green path.
By Andy Hecht, 16th July 2021. Investing.com
-
Indonesia overtakes India as Asia's new Covid-19 epicenter. Becoming one of the highest in the world with daily Covid cases.

Indonesia reported 54,517 new cases of Covid-19, authorities said Wednesday, a single-day national record and dire warning sign for the world's fourth-most populous country.
For more on this news article click this link here, CNN
By Masrur Jamaluddin and Joshua Berlinger, CNN. 16th July 2021.
-
3
-
 1
1
-
-
With the ECB deciding on rates on Thursday 22 July Nick Cawley, from Daily FX, looks at a short trade for EUR/GBP.
-
Gold price and oil price both edge lower
Gold has stalled in its move upwards while oil is continuing to head lower for the time being.
 Source: Bloomberg
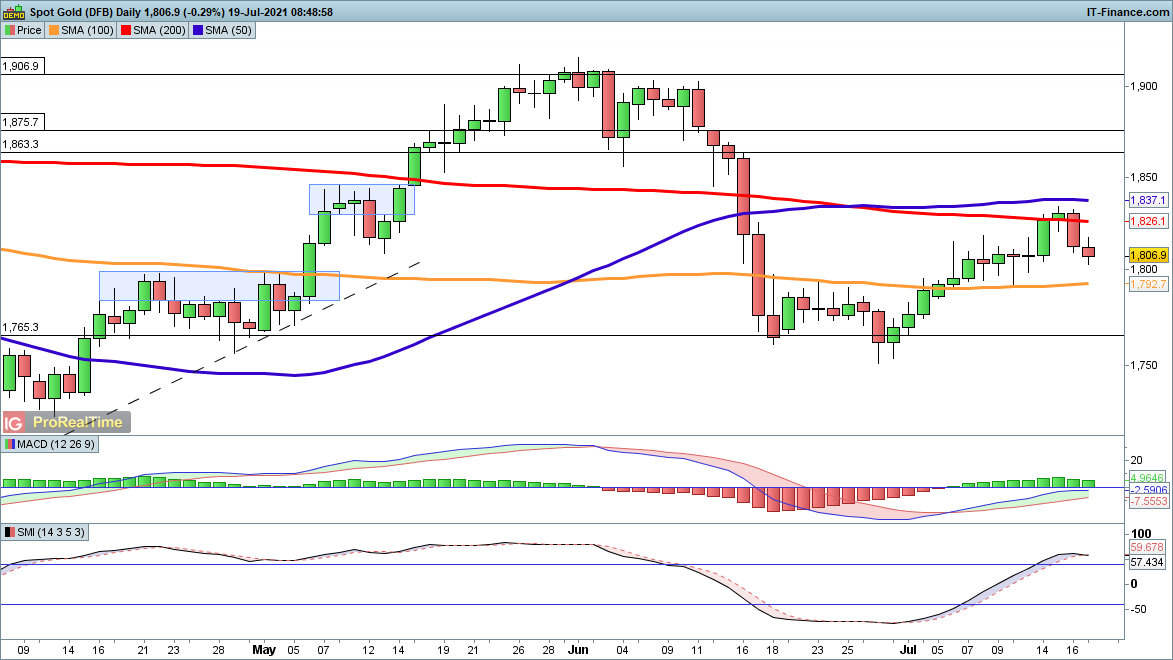
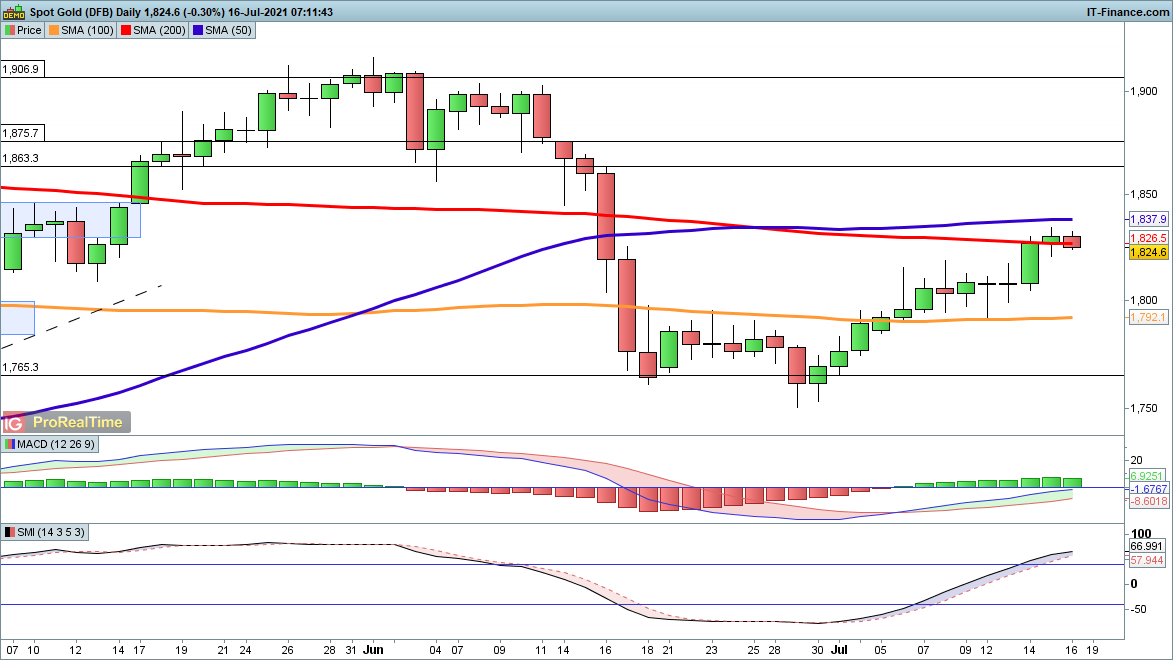
Gold
Despite signs of caution earlier in the week the gold price has recovered and moved to a new one month high. It has even topped the 200-day simple moving average (SMA) at $1826.
While some weakness has been seen this morning there are few signs of a reversal as yet, which would develop with a drop below $1810. Further gains target the 50-day SMA at $1837, and then on to $1863.
 Source: ProRealTime
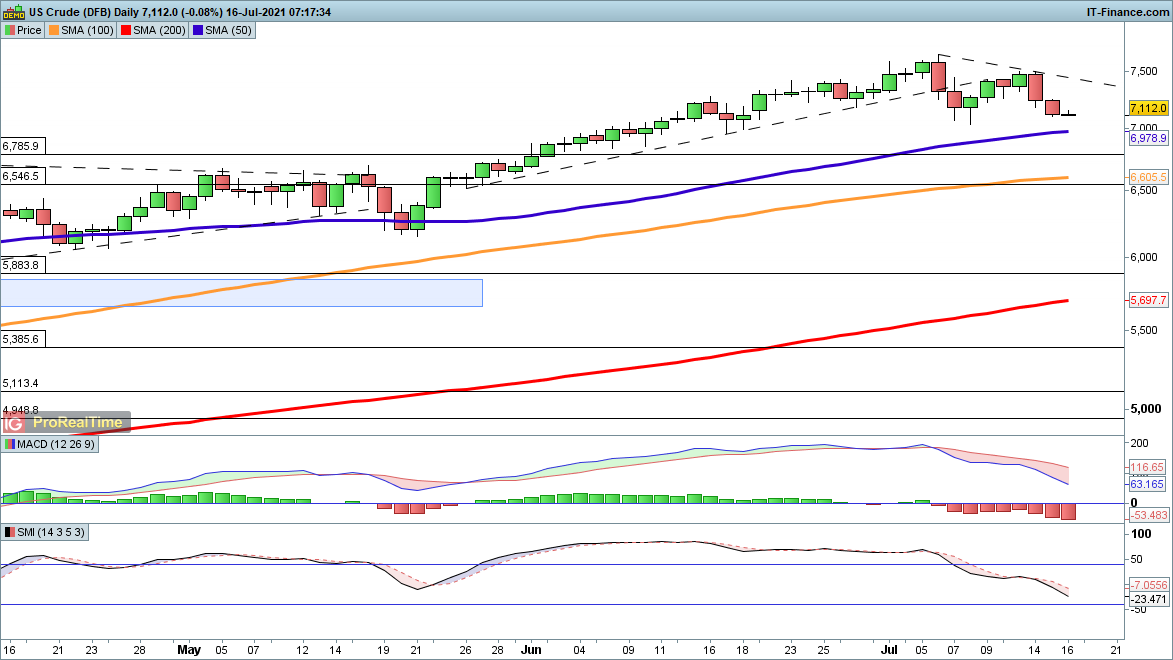
WTI
The price continues to drop back, having come under pressure, but the uptrend is still firmly intact. A further decline towards the 50-day SMA is possible, but would still create a higher low.
Meanwhile, short-term trendline resistance from the peak would suggest resistance around $73.80 in the event of any recovery in coming sessions.
 Source: ProRealTime
-
1
-


News and Trade Ideas (CURRENCIES)
in Foreign Exchange (FX)
Posted
EUR/USD, GBP/USD and AUD/USD likely to continue on bearish theme
EUR/USD, GBP/USD, and AUD/USD head lower, with intraday downtrend likely to continue as we reach multi-month lows.
EUR/USD continues to grind lower following latest breakdown
EUR/USD has been grinding lower over the course of the week, with the pair building on the later 61.8%, retracement to fall back below the prior low of $1.1772.
There is a good chance we will see another upward retracement before long, yet the bearish trend remains in place, the price breaks through the recent peak of $1.185. Until then, we look likely to see further weakness to build on the downtrend seen over the course of June and July.
GBP/USD tumbles into a fresh five-month low
GBP/USD has continued to lose ground over the course of the week, with the breakdown below $1.367 bringing multi-month lows for the pair.
The hourly chart highlights the construct of this trend, with lower intraday highs key to seeing the downside continue. With that in mind, another leg lower looks likely here, with a break up through the $1.3689 required to negate the bearish outlook.
AUD/USD heads lower after latest retracement
AUD/USD has been on the back foot once more this morning, with the pair heading lower from a deep retracement overnight. With the price hitting a fresh seven-month low, there is a good chance we have seen the pair top out.
With that in mind, it makes sense to utilise the intraday charts to follow the ongoing selloff. As such, a bearish outlook holds as long as price remains within a pattern of lower highs. Thus, while another upward retracement is likely before long, a bearish outlook holds unless the price rises up through the $0.734 resistance level.
See an FX opportunity?