

MongiIG
-
Posts
9,887 -
Joined
-
Last visited
-
Days Won
41
Content Type
Profiles
Forums
Blogs
Events
Community Tutorials
Store
Posts posted by MongiIG
-
-
BHP delivers in spades, sending share price up
Mining giant BHP has delivered its third best ever earnings number, raised its dividend and confirmed the divestment in its oil business.
As Jeremy Naylor explains, this takes the company’s share price well on its way to the price target of £28 indicated by the long-term inverted head and shoulders pattern.
https://www.ig.com/uk/market-insight-articles/bhp-delivers-in-spades--sending-share-price-up-210817

-
Gold and Brent crude look likely to reverse recent trends
Gold at risk after rally into resistance, while Brent crude weakness looks likely to resolve with a move higher before long.
 Source: Bloomberg
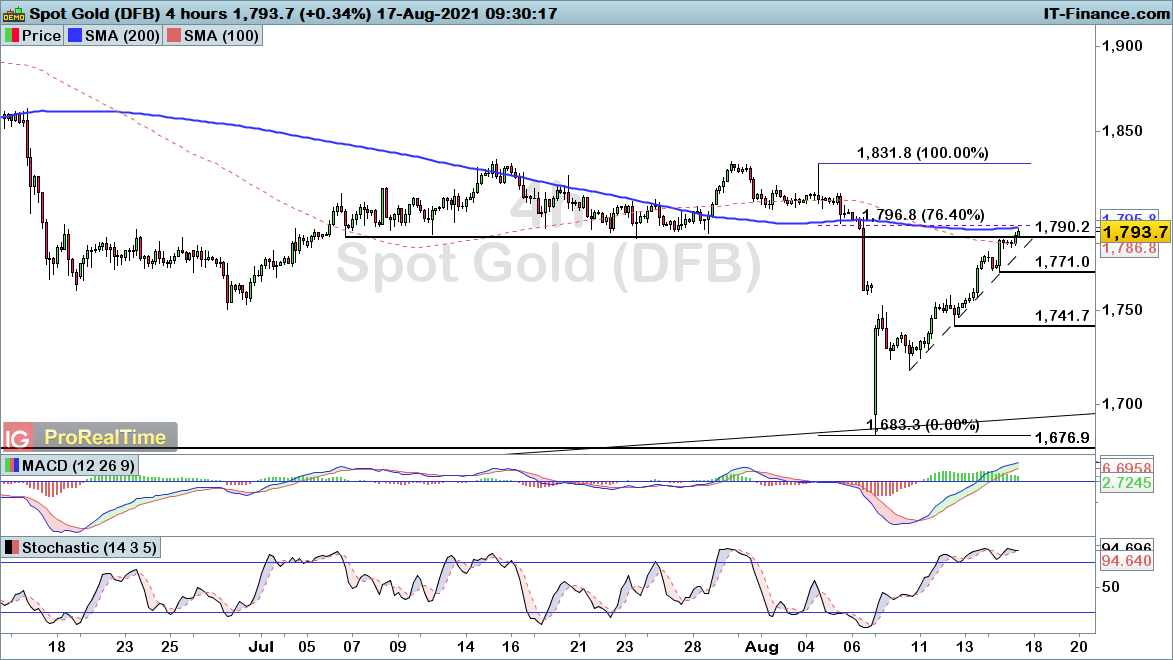
Gold rallies into Fibonacci and SMA resistance
Gold has been on the rise over the course of the past week, with price pushing back into the confluence of 76.4% Fibonacci and 200-simple moving average (SMA) resistance.
The downtrend seen over the course of the past two months provides the basis for a potential leg lower from here, with a decline through $1771 bringing a fresh bearish signal into play.
With that in mind, there is a good chance we will see gold start to weaken from here, where a rise through $1831 would be required to end this recent wider downtrend.
 Source: ProRealTime
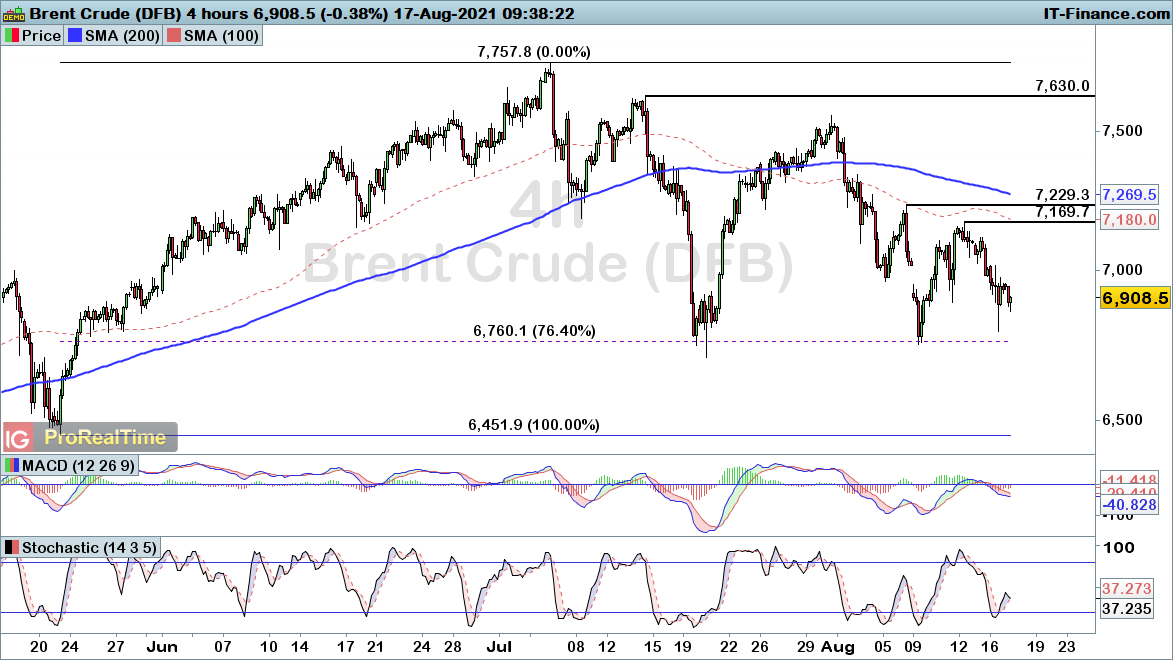
Brent crude continues to drift lower, but bulls expected to return
Brent crude has been weakening over the six weeks since topping out at $77.57.
That pullback looks like a potential retracement, and thus the respect of the 76.4% Fibonacci support level at $67.60 is important within that story.
A rise through $71.69 would bring about a more reliable bullish outlook for Brent, bringing an end to the recent trend of lower highs.
-
EUR/USD, GBP/USD and AUD/USD ease back on dollar strength
EUR/USD, GBP/USD, and AUD/USD head lower, with the dollar gaining ground off haven demand.
 Source: Bloomberg
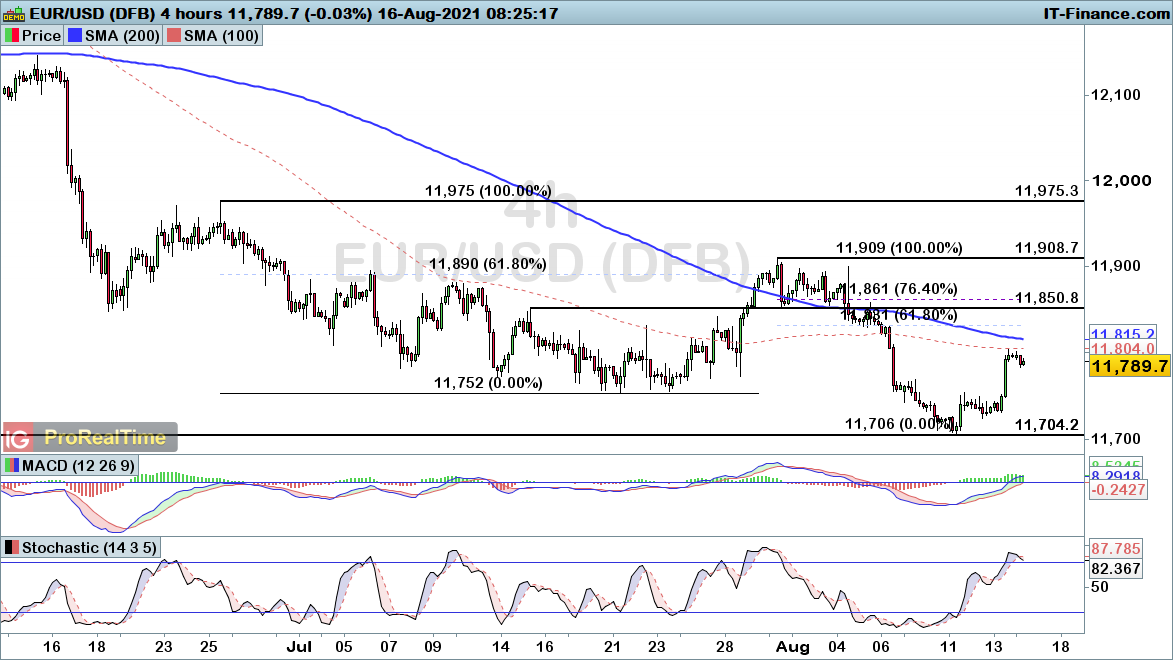
EUR/USD drifts lower after recent rally
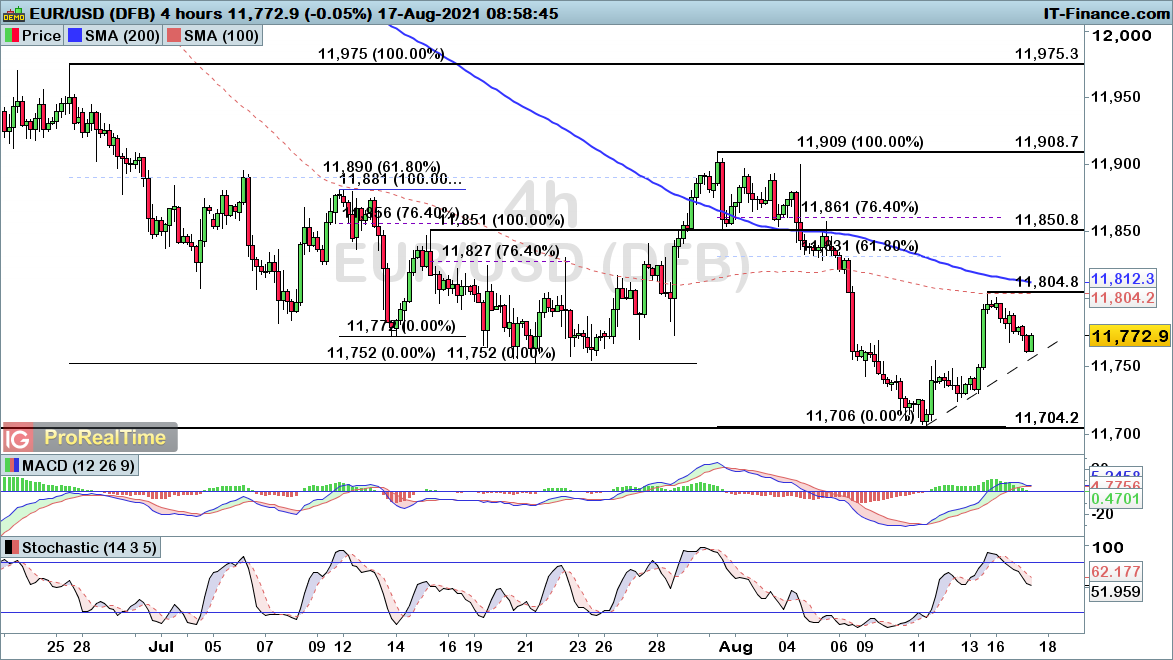
EUR/USD has started to drift lower since Friday’s peak of $1.1804, with the pair taking a breather from a recovery phase. The pair looks likely to rise towards the deeper Fibonacci retracement levels of $1.1831-$1.1861.
With that in mind, the current pullback looks like a potential precursor to the pair heading higher once again. A break below the $1.1704 level would be required to bring a bearish continuation signal back into play.
 Source: ProRealTime
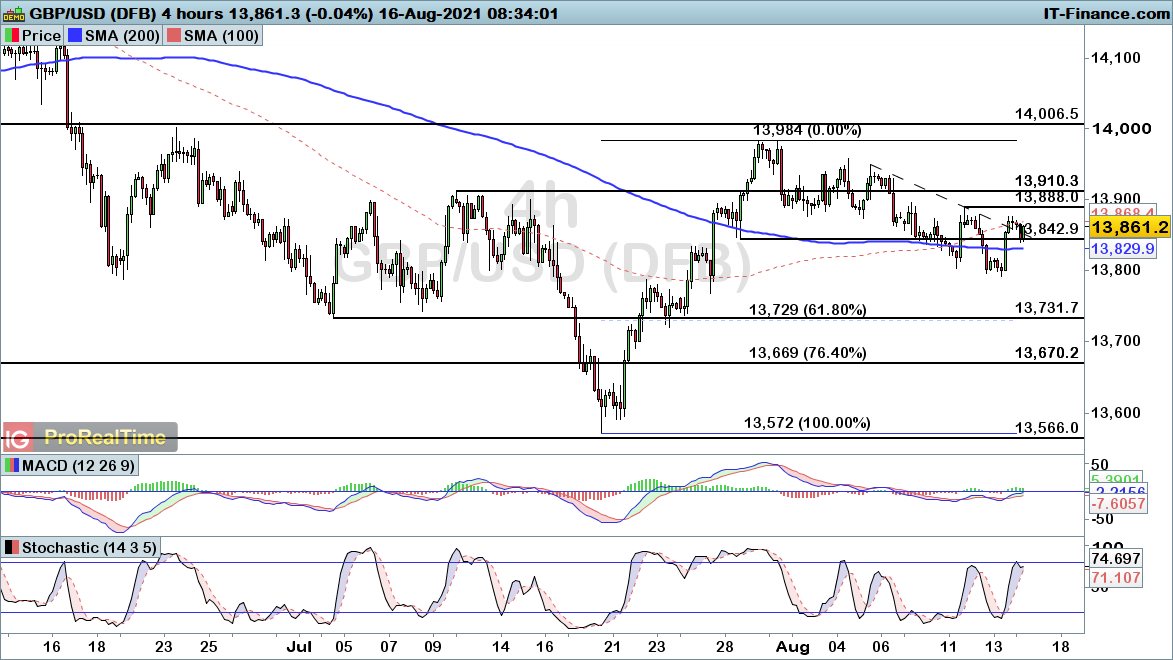
GBP/USD falls back into support
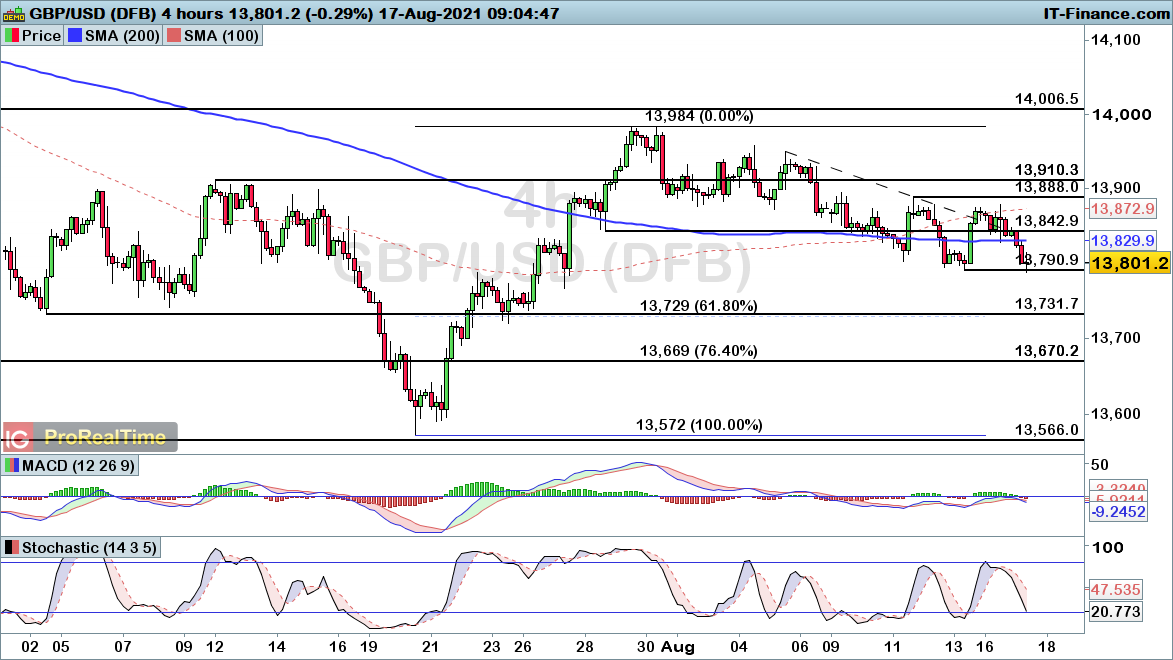
GBP/USD failed to overcome the $1.3888 resistance level yesterday, with the recent downtrend thus remaining intact.
A break up through that level would bring about a more bullish picture once again. Until then, the $1.3791 support levels comes into play here, with a decline through this level bringing about a bearish continuation signal.
 Source: ProRealTime
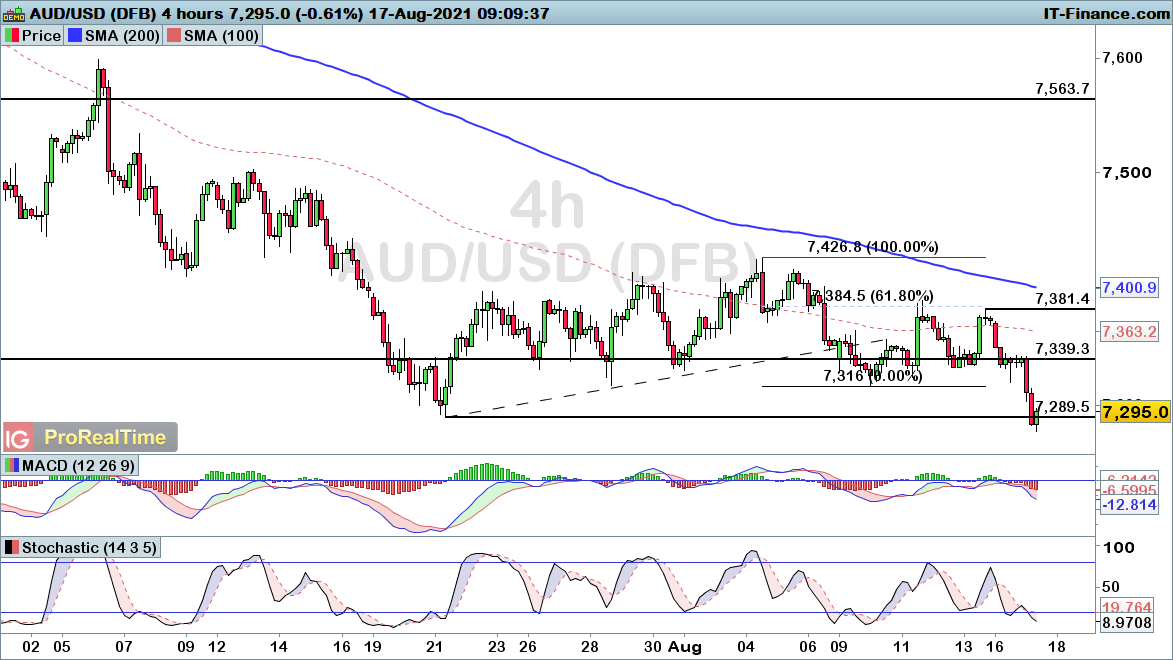
AUD/USD tumbles into fresh eight-month low
AUD/USD has been on the back foot overnight, with the Reserve Bank of Australia (RBA) preparing to hold off on tapering in the face of lockdown restrictions.
The break below $0.7289 points towards a potential push lower from here, with a bearish outlook in play unless we see a break up through the $0.7381 swing high.
 Source: ProRealTime
-
1 hour ago, Darrenm said:
Hi,
There was an article on the SA40, can't find it again,
any comments, views, considerations on trading the SA40?
Hi @Darrenm,
JSE slipped amid weak Chinese data and fresh virus outbreaks. Despite a weaker start to the week for the all share, banks, retailers and financials rose on the day.
The JSE was weaker on Monday morning, with its global peers mixed as sluggish Chinese economic data and renewed Covid-19 outbreaks weighed on sentiment.
Chinese July retail sales and industrial production figures fell more than was forecast — a trend that analysts fear might worsen as the world’s second-largest economy grapples with the spread of the highly infectious Delta strain.
Have a look at this article by our senior market analyst: How to trade South Africa 40 Index
All the best - MongiIG
-
 1
1
-
-
2 hours ago, Caseynotes said:
Dax and Dow daily and H1.


Hi @Caseynotes, The DAX has been weakening in early trade this week and Dow Jones turns lower after brief record high. What potential price level points are you monitoring to reach or break swing lows for both DAX and Dow Jones ?
MongiIG
-
FTSE 100, DAX and Dow head lower, but could the bulls come swiftly back into play?
FTSE, DAX, and Dow on the back foot in early trade, but will that decline bring about a buying opportunity or further downside?
 Source: Bloomberg
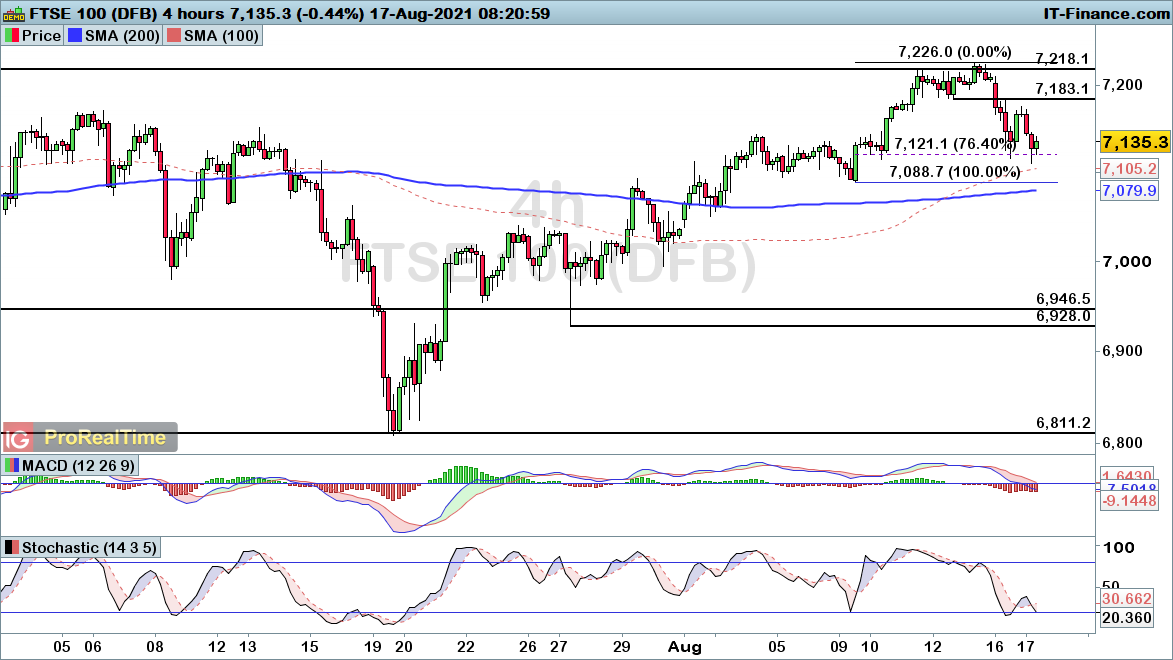
FTSE 100 falls back into Fibonacci support
The FTSE 100 has been on the back foot over the start of this week, with price falling back into the 76.4% Fibonacci support level.
A break below the 7088 swing-low would point towards a potential wider pullback coming back into play. Until then, there is a good chance we could see the index regain a more positive footing around these levels.
 Source: ProRealTime
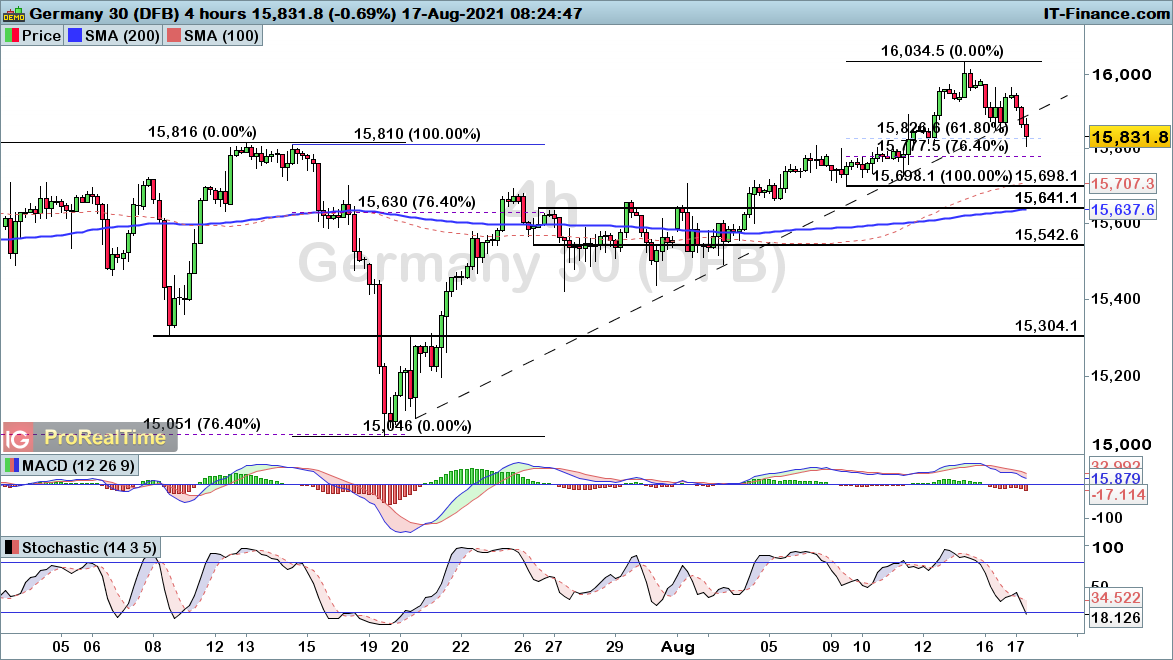
DAX drops below trendline support
The DAX has been weakening in early trade this week, with price falling back below trendline support this morning. That brings us back into the deep Fibonacci zone between 15777 and 15826.
This raises the likelihood of a bullish resurgence for the index, with a wider bearish picture coming into play in the event that price breaks below the 15698 swing-low.
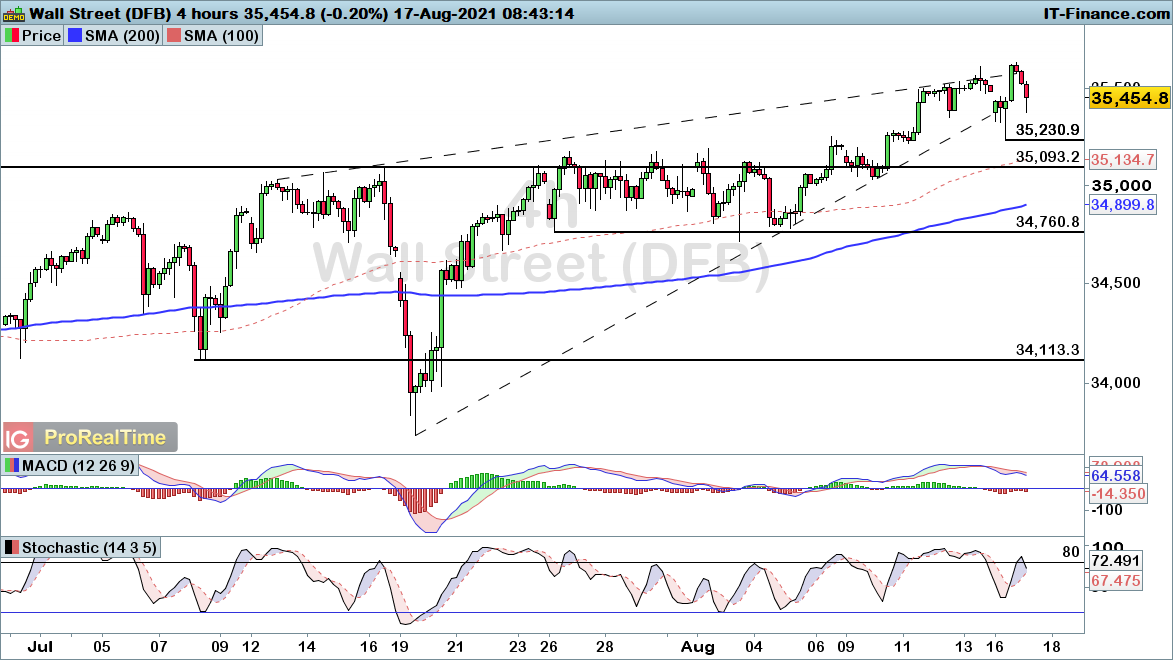
Dow Jones turns lower after brief record high
The Dow has started to head sharply lower this morning, with yesterday’s push into record highs proving fleeting.
The volatility we are seeing around the apex of an ascending triangle pattern does point towards a potential deeper breakdown if price falls back below the 35231 swing-low. The uptrend remains intact unless price breaks back below that recent low.
 Source: ProRealTime
-
-
On 15/08/2021 at 09:15, Guest Eduard said:
Name of stock - iShares MSCI World Small Cap UCITS ETF
Name of Stock Exchange - London Stock Exchange
Leverage or Share dealing - Share Dealing
Ticker - WLDS
Country of the stock - Ireland
Market Cap - GBP 1,714 M
Could I get this ETF available for my ISA account please?
Thank You.
Eduard
Hi Eduard, iShares MSCI World Small Cap UCITS ETF is available for share dealing account :

All the best - MongiIG
-
1
-
-
Aussie central bank ‘prepared’ to take action – AUD/USD
The Aussie is testing support as the minutes of the central bank meeting show the Covid-induced weakness in the economy (driven by continued lockdowns) is having a dire effect. IGTV’s Jeremy Naylor looks at AUD/USD.

-
Early Morning Call: S&P 500 soars; US earnings update and oil down for 4th day
Indices under pressure apart from S&P 500 which is now up more than 100% since Covid lows. Awaiting earnings from BHP, JET, WMT and HD, while TSLA tumbles on autopilot crash investigation. And, oil is down for a fourth day.

This is here for you to catch up but if you have any ideas on markets or events you want us to relay to the TV team we’re more than happy to.
-
10 hours ago, amilio said:
as a new be how do I scan for stocks? high volume and gapers
Hi @amilio, thanks for the question. Using ProRealTime, you are able to make use of ProScreener (Markets Scan). ProScreener is a powerful scanning tool that allows you to scan entire equity and forex markets for instruments that match your investment criteria.
On ProScreener the available tabs of the Top Movers (predefined scanning programs) tool include and allow you to detect: variations, gaps and abnormal volume, pre-opening variations, candlestick form detection, high order book spread (difference between bid and ask) or high increase in bid or ask volume (up or down).
Please kindly visit this link https://www.prorealtime.com/en/pdf/proscreener.pdf it is a programming guide for markets scanning (ProScreener).
All the best - MongiIG
-
1
-
-
For more up to date news on how markets will open, the latest earnings and economic news, watch IGTV live in the platform at 07:30am UK.

Today’s coverage:
Indices: Indices under pressure apart from S&P - another record high now up more than 100% since Covid lows
FX: AUDUSD at near term support close to 9mth lows as RBA minutes showed preparedness for help. Watching GBP ahead of UK jobs & EUR ahead of EU GDP. USDJPY holds 76.4% Fib support, where next?
Equities: Awaiting earnings from BHP JET WMT HD. TSLA tumbles on autopilot crash investigation
Commods: Oil down for 4th day - US shale oil production highest since May 2020. Lumber crashes support now at Oct 2020 levels. Gold holds recent highs. Aluminium near 4+yr resistance
-
Market data to trade on Tuesday: Walmart; BHP; EUR/JPY
IGTV’s Victoria Scholar takes a look at the charts of Walmart and BHP as earnings season continues. Meanwhile, focus is on the euro ahead of the eurozone’s second quarter growth figures.

-

Trade of the Week 16/08: short AUD/NZD
IG’s senior market analyst, Josh Mahony MSTA, looks to short AUD/NZD with a stop-loss at 10502. Josh also looks at the recent GBP/AUD, Dow and Nasdaq trades.
https://www.ig.com/uk/market-insight-articles/trade-of-the-week-16-08--short-aud-nzd-210816
-
Charting the Markets: 16 August
The week has begun with losses, but this has only put a small dent in the gains made over the past month. EUR/USD, GBP/USD and AUD/USD stabilise after a period of declines, while gold prices make further headway.
https://www.ig.com/uk/market-insight-articles/charting-the-markets--16-august-210816
 This is here for you to catch up but if you have any ideas on markets or events you want us to relay to the TV team we’re more than happy to.
 -
-
On 15/08/2021 at 09:15, Guest Eduard said:
Name of stock - iShares MSCI World Small Cap UCITS ETF
Name of Stock Exchange - London Stock Exchange
Leverage or Share dealing - Share Dealing
Ticker - WLDS
Country of the stock - Ireland
Market Cap - GBP 1,714 M
Could I get this ETF available for my ISA account please?
Thank You.
Eduard
Hi Eduard,
Your request has been submitted !
All the best - MongiIG -
EUR/USD, GBP/USD and AUD/USD stabilize after recent losses
EUR/USD, GBP/USD and AUD/USD stabilize after a period of declines, but will we see the price reverse upwards or maintain the bearish trend?
 Source: Bloomberg
EUR/USD on the rise from key support
EUR/USD has started to regain ground after falling back into the March low of $1.1704. The recent trend of lower highs does still remain in play, unless the price rises through the $1.1909 resistance level from late-July.
With that in mind, there is a risk we could see the pair falter once again. Ultimately, the outlook will become clearer once the price breaks through either $1.1704 or $1.1909. Until then, we could see further short-term upside, yet Fibonacci resistance at $1.1831 and $1.1861 provides the key resistance levels to note up ahead.
 Source: ProRealTime
GBP/USD rising back towards notable resistance
GBP/USD has been on the slide over the course of the past fortnight, with the pair seemingly providing a retracement phase in the wake of the rise through $1.391 resistance.
That break points towards us reversing upwards before long, with an end to this intraday trend of lower highs key to that happening. As such, a break through $1.3888 would bring about a fresh bullish signal for the pair. There is still a good chance of further downside unless the price breaks through $1.3888. Should we see the price rise through that level, it would provide a signal that we will regain a more bullish footing once again.
 Source: ProRealTime
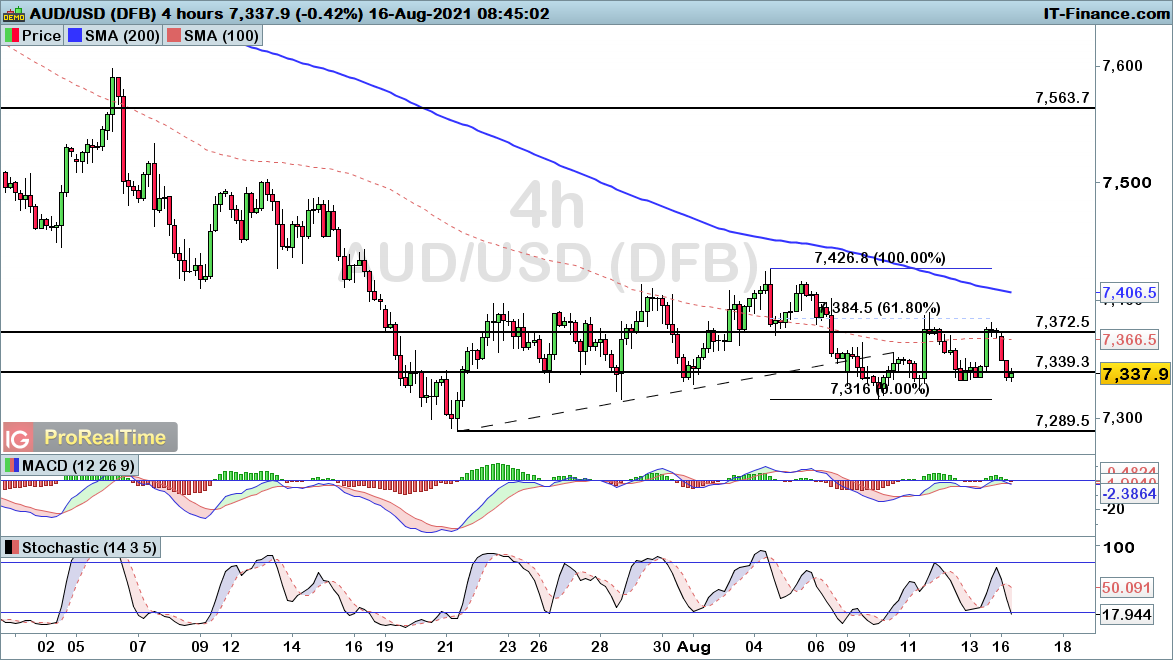
AUD/USD continues to remain at risk as the price consolidates
AUD/USD has been consolidating for much of the past month, with the recent trendline break simply leading us into another period of sideways the price action.
The subsequent respect of 61.8% Fibonacci resistance around $0.7384 does highlight the potential for another breakdown from here, with a move through $0.7316 bringing greater confidence that we are set for another breakdown for this pair.
 Source: ProRealTime
-
US earnings tail this week: WMT, HD, CSCO & NVDA

These all-sessions US stocks have an interesting tradable story to the numbers this week. Walmart, Home Depot, Cisco Systems and NVIDIA are trading at levels that could see record or recent highs, if the numbers are good.
-
1
-
-
1 hour ago, pontys said:
IG Academy app - has lots of courses available on different topics and if you keep an eye on the main webpage there’s webminars available from time to time!
Hi @pontys, yes you are correct IG Academy app does have a lot of courses available on different topics.
For the webinars, click on live sessions and you will see the upcoming webinars calendar for the week, which is great to plan ahead.
What courses have you done and/or currently doing ? Will you be joining any of the webinars this week ?
MongiIG
-
Gold targets further gains as oil price sinks again
Gold prices have made further headway after an impressive recovery, while oil is sinking once again.
 Source: Bloomberg
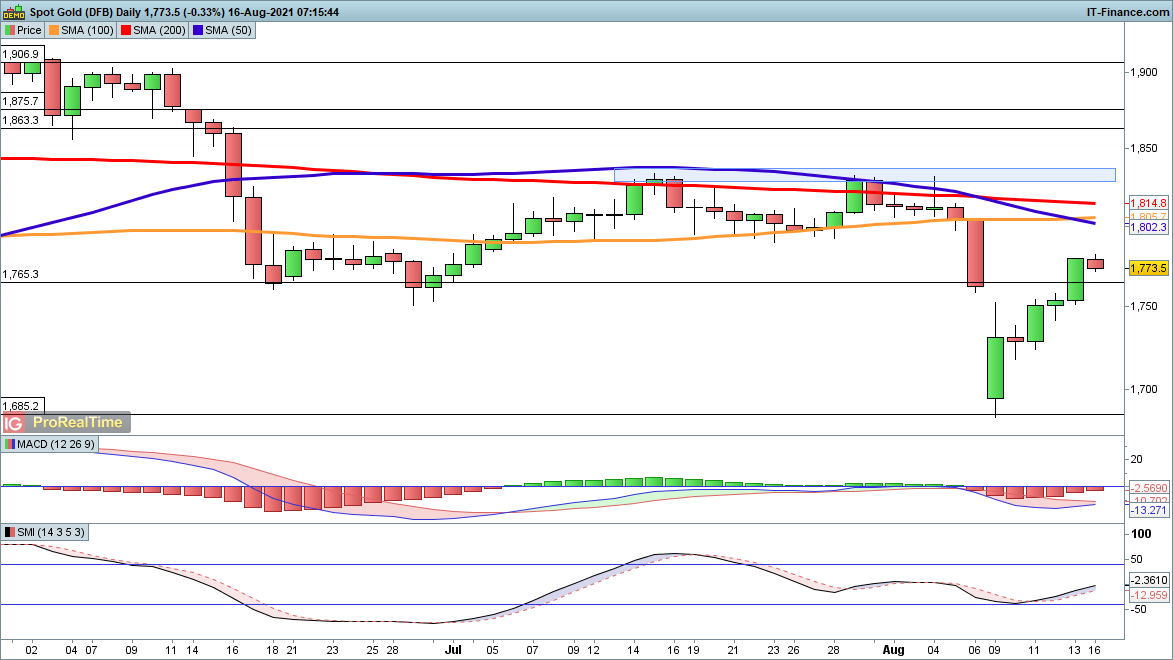
Gold
Last week saw a remarkable drop then recovery for gold, which ended up almost $100/oz higher from Monday’s low. This bounce puts the price in a strong position, even with some weakness in early trading this morning.
Renewed gains target $1802 and then $1833, backed up by rising stochastics and a potential bullish moving average convergence divergence (MACD) crossover.
 Source: ProRealTime
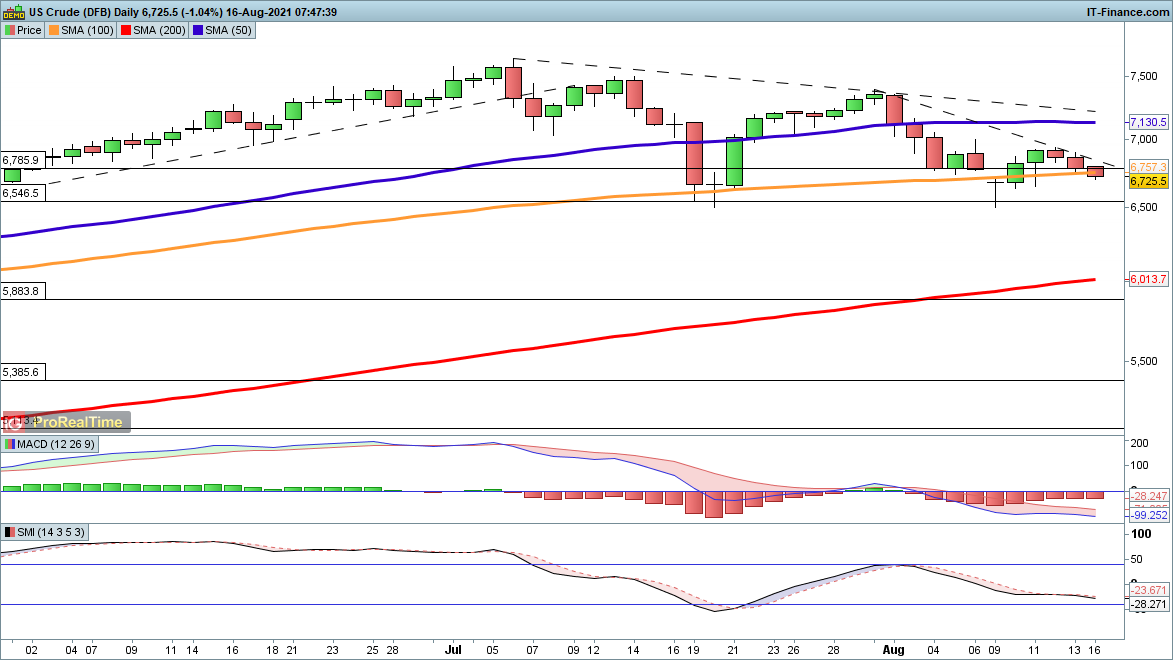
WTI
Hopes of a continued bounce have been dashed, with the price heading back towards support at $65.46.
Trendline resistance from late July continues to hold back upside progress, with a breakout above $68 needed to reverse the bearish view of the past three sessions.
 Source: ProRealTime
-
Indices on the back foot after recent gains
The new week has begun with losses, although this has only put a small dent in the gains made over the past month.
 Source: Bloomberg
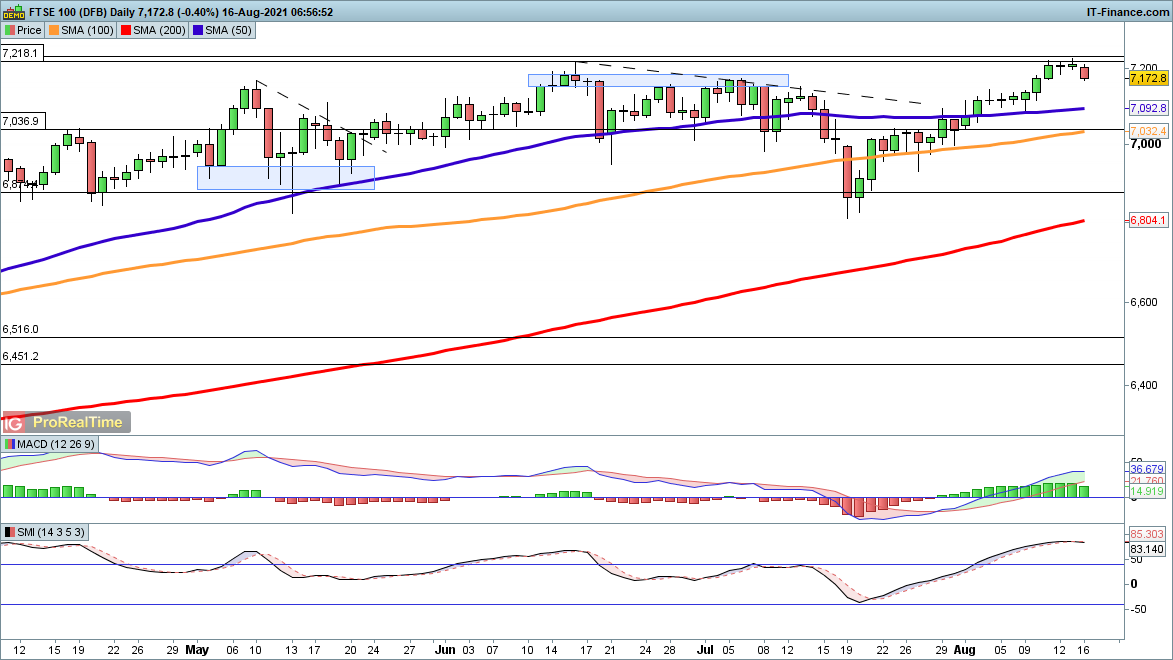
FTSE 100
After a month of gains the FTSE 100 is in retreat this morning, although only modestly, moving back from the highs seen at the end of last week and back from resistance around 18-month highs at 7218.
Whether this turns into anything serious remains to be seen, but a move back to the 50-day simple moving average (SMA) at 7092 may find support, or at 7037 where previous weakness in June was held for a time.
 Source: ProRealTime
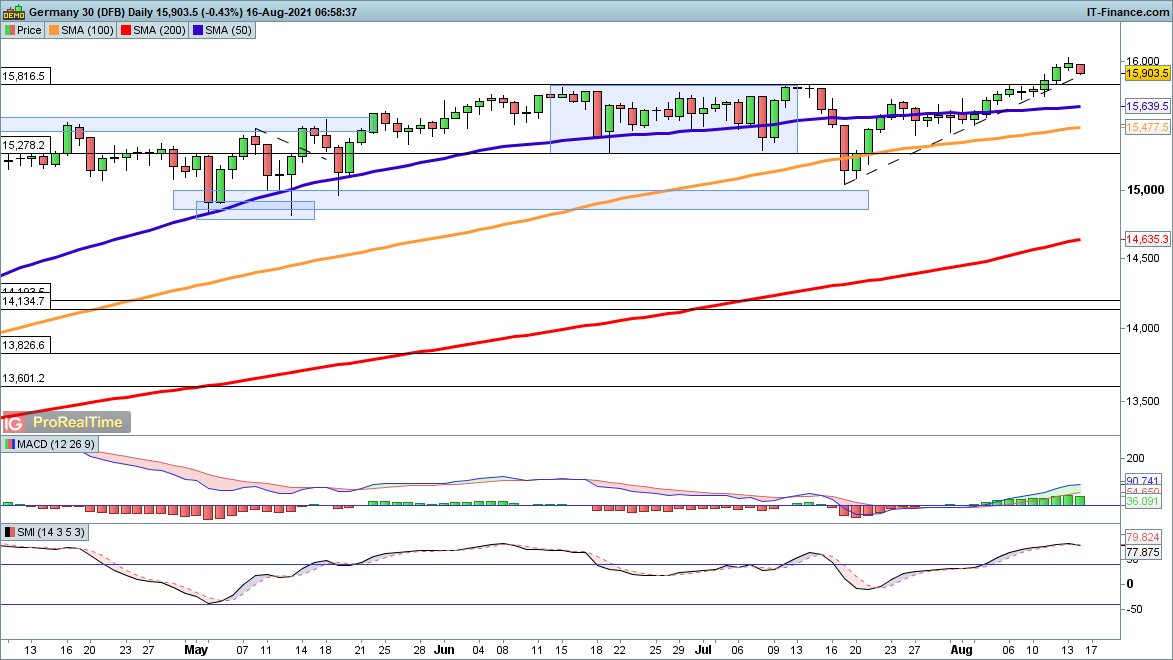
DAX
A surge to a new record high for the DAX last week, which briefly took the price above 16,000, has been followed up with a small drop in early trading.
Initial support could be found at 15,816, previous resistance, and then down towards the 50-day SMA at 15,639. A recovery of 16,000 hands the initiative back to the buyers.
 Source: ProRealTime
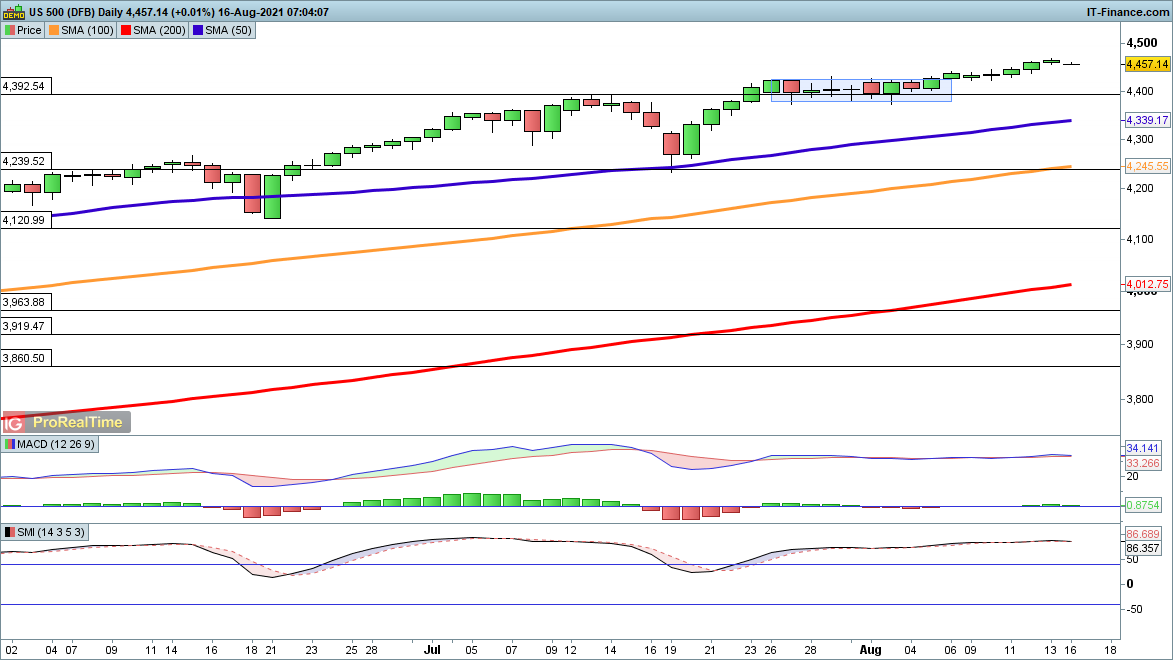
S&P 500
Like the DAX, this index hit a new peak at the end of last week. A small dip so far this morning fails to put much of a dent in the bounce, but buyers may not want to press their luck too hard in the short-term.
Sellers however need to be careful too, a higher low and higher high in around a month reminds us that this rally is still strong, and weakness is likely to be short-lived, with 4392 and then the 50-day at 4339 potential support.
 Source: ProRealTime
-
Early Morning Call: Europe expected down; China economic data disappoints and USD falls
Europe expected to open lower after Asia markets drop. Meanwhile, economic data in China disappoints on rising Covid-19 fears, despite fractionally improved GDP. And, USD falls amid lowest US consumer sentiment in almost a decade.
This is here for you to catch up but if you have any ideas on markets or events you want us to relay to the TV team we’re more than happy to.
-
1 hour ago, RFSmithers said:
Completed IG's Planning and Risk Management Course today.

Hi @RFSmithers, that is great and well done. How did you find the course and what course are you planning on doing next ?
MongiIG


IGTV on Demand
in General Trading Strategy Discussion
Posted
Charting the Markets: 17 August
European markets are mostly lower amid concerns about the delta variant and geopolitical uncertainty in Afghanistan.
The pound is under pressure despite better-than-expected unemployment data and the Kiwi dollar is selling off as the country enters a nationwide lockdown ahead of the RBNZ’s rate decision.
Oil, meanwhile, continues to decline after hitting a one-week low, while gold catches a bid amid risk-off sentiment and could be on track to break back above $1800.
https://www.ig.com/uk/market-insight-articles/charting-the-markets--17-august-210817