

MongiIG
-
Posts
9,886 -
Joined
-
Last visited
-
Days Won
41
Content Type
Profiles
Forums
Blogs
Events
Community Tutorials
Store
Posts posted by MongiIG
-
-
Hi @Frothy,
We have created a dedicated thread for Stock request on:
You can make your request on the stock request forum.
When making a stock request please kindly give the following information:
Name of stock
Name of Stock Exchange
Leverage or Share dealing
Ticker
Country of the stock
Market Cap
All the best - MongiIG
-
Gold and Brent crude likely to find support following period of weakness
Gold and Brent crude fall back down towards key support, with bulls expected to come back into play before long.
 Source: Bloomberg
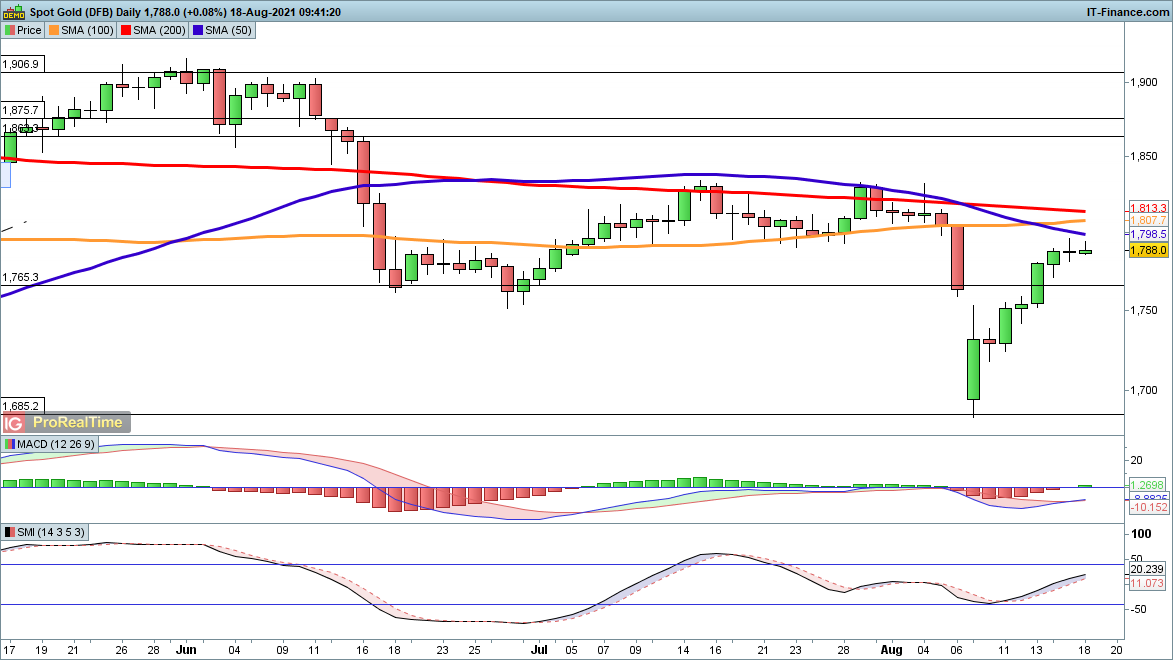
Gold continues to consolidate above Fibonacci support
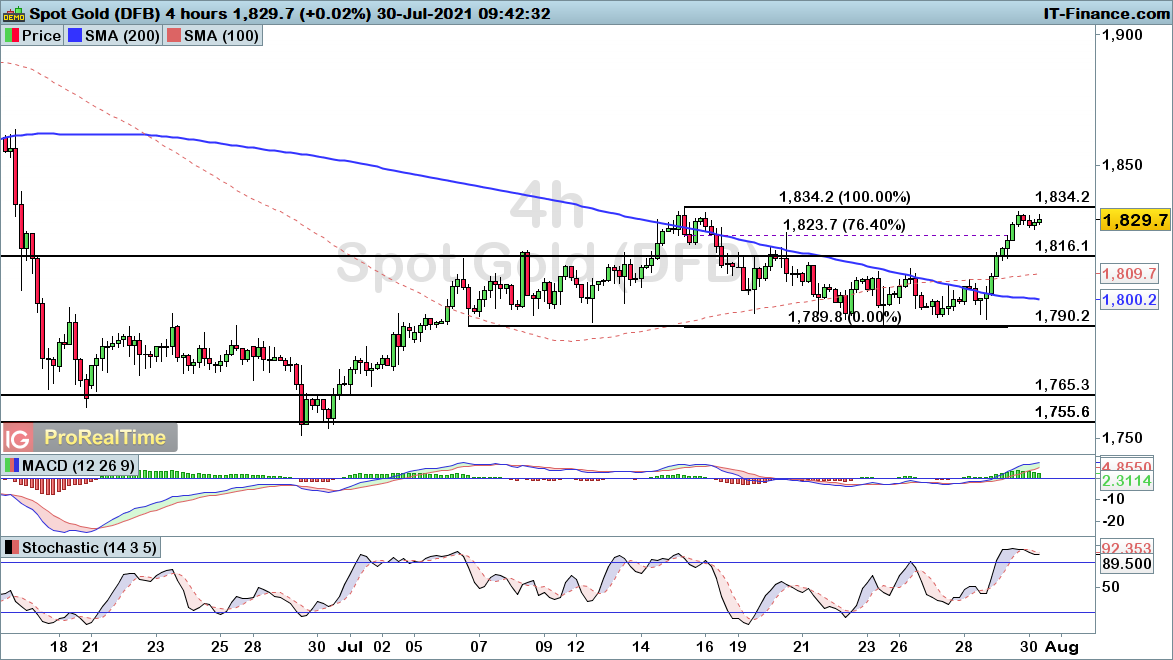
Gold has been consolidating above the $1806 Fibonacci support level over the course of the week thus far.
That level is going to be key as we see the precious metal head back down towards $1806 once again. Below that point, we would look for support to come into play around $1800 and $1790.
Only with a break below that lower level would see us break out from this month-long period of consolidation. Until then, the weakness we have seen recently looks likely to provide us with a another turn higher before long.
 Source: ProRealTime
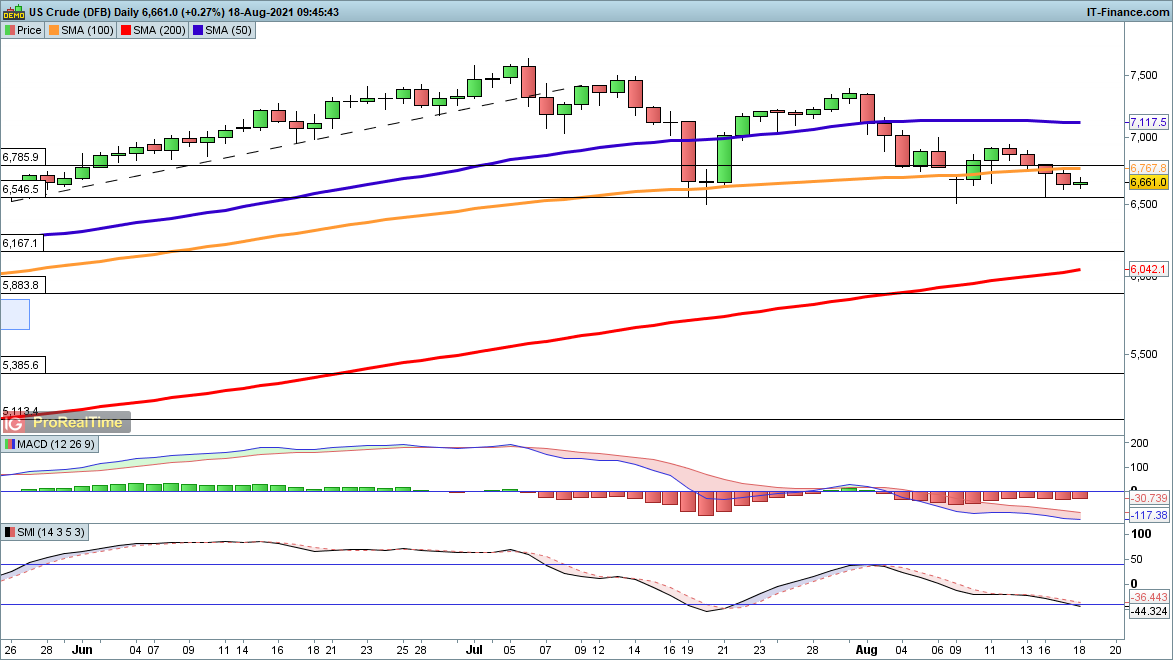
Brent crude tumbles back towards key Fibonacci support level
Brent crude has been hit hard over the course of the week, with price falling back below the 61.8% Fibonacci support level to bring the 76.4% Fib level into play. The wider trend of higher lows does provide expectations that we will see the bulls come back into play before long.
With that in mind, watch out for a potential bullish reaction from the 76.4% Fibonacci level around $69.07. Long positions are favoured until price breaks back below the $67.06 low.
 Source: ProRealTime

See opportunity on a commodity?
-
EUR/USD, GBP/USD and AUD/USD pullback unlikely to last
EUR/USD, GBP/USD and AUD/USD weakness proves brief, with the bulls likely to come back into play.
 Source: Bloomberg
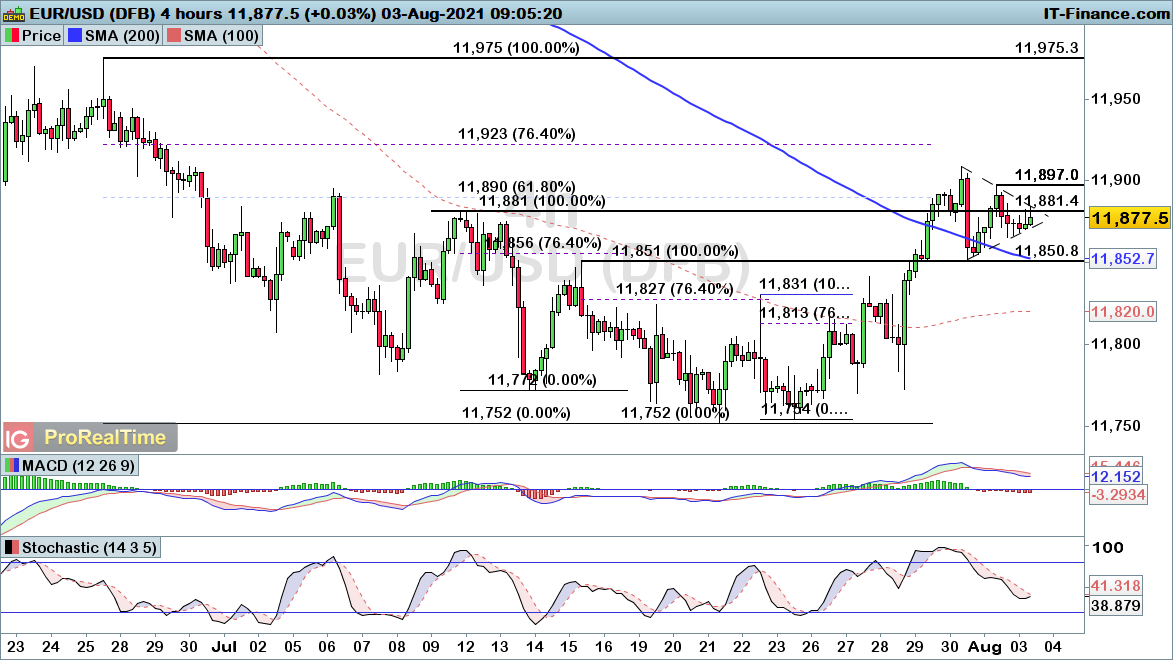
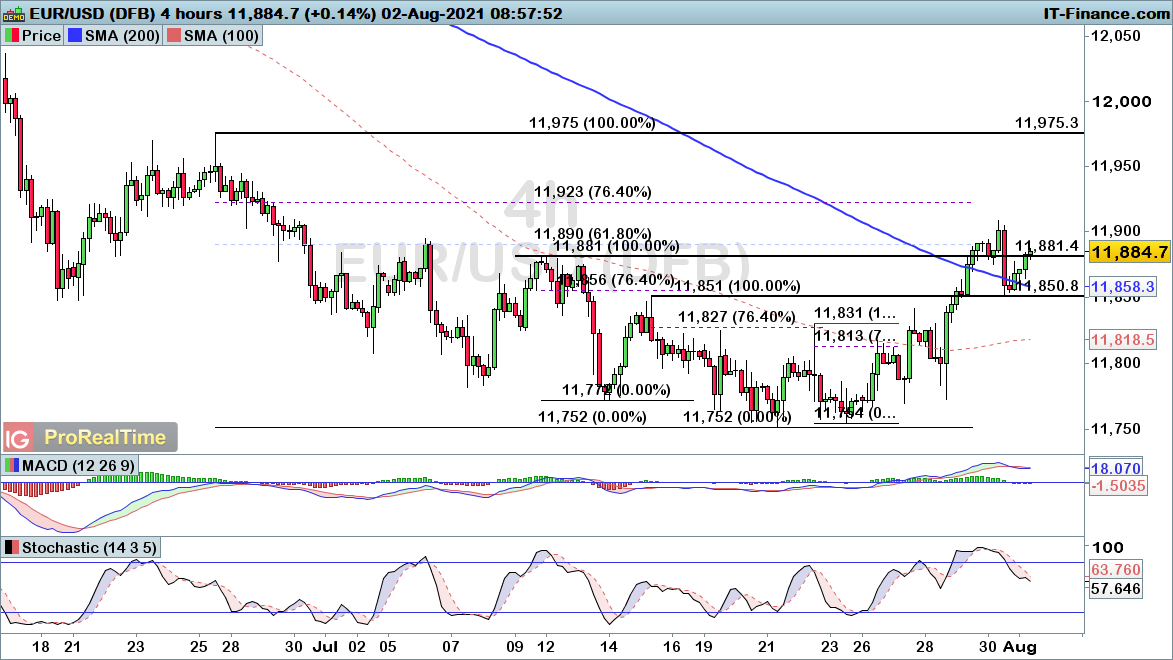
EUR/USD weakens, yet bulls could yet come back into play
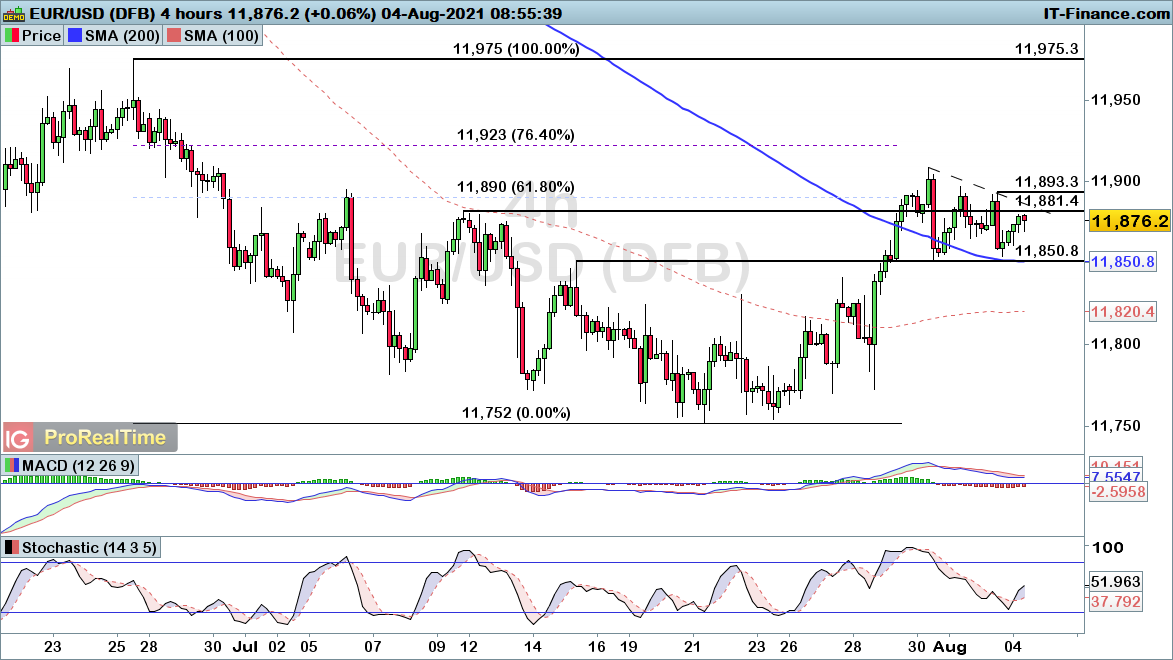
EUR/USD fell below the $1.185 support level yesterday, with the price falling back into the prior resistance level of $1.183 which now provides support.
The original break through $1.1881 did signal the potential for a bullish reversal of the downtrend seen in June and July. Thus, this recent breakdown could yet be a retracement before we head higher once again. With that in mind, watch for the bulls to potentially come back into play here, with a break below the $1.1752 low required to bring a continuation of that bearish trend.
 Source: ProRealTime
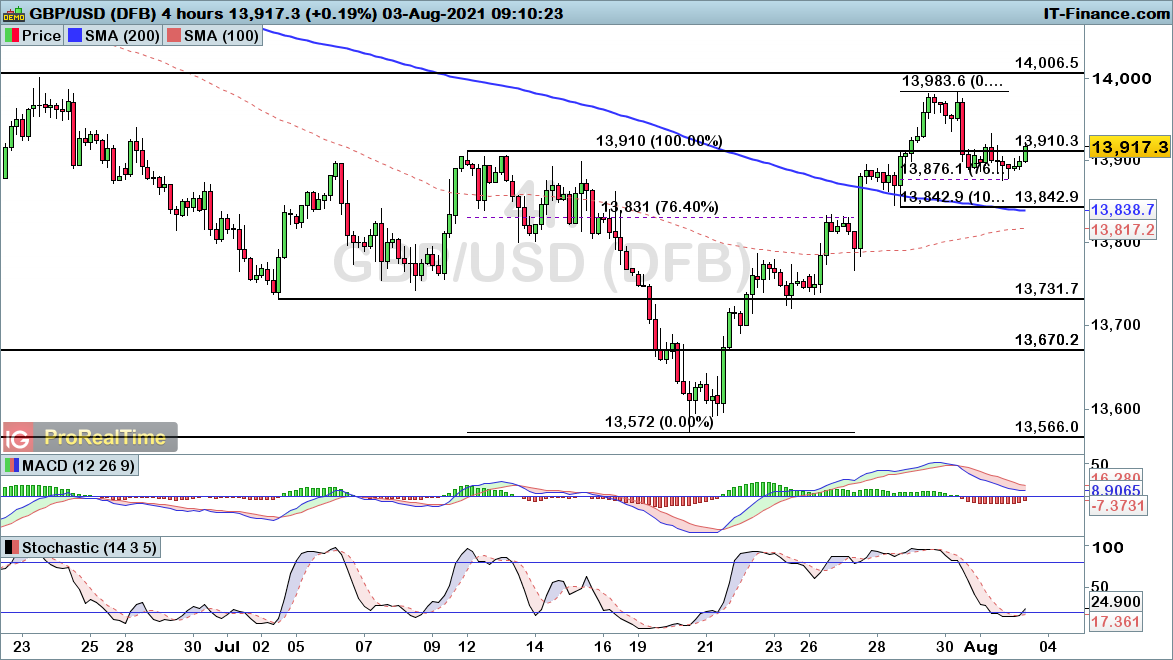
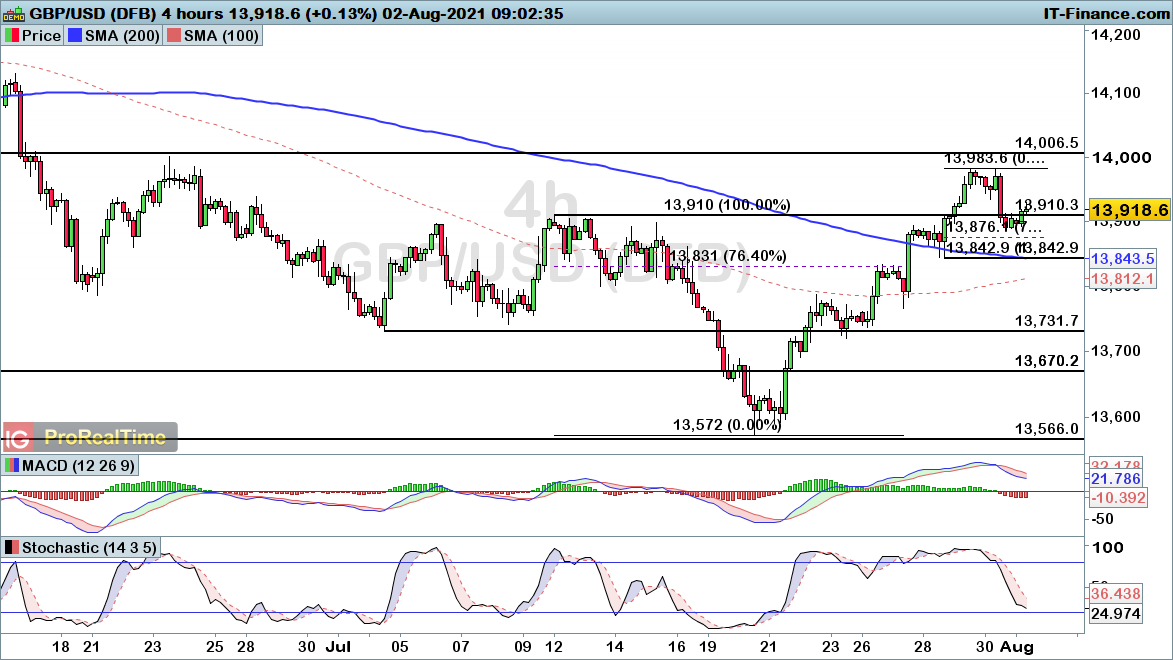
GBP/USD respecting 76.4% Fibonacci support once again
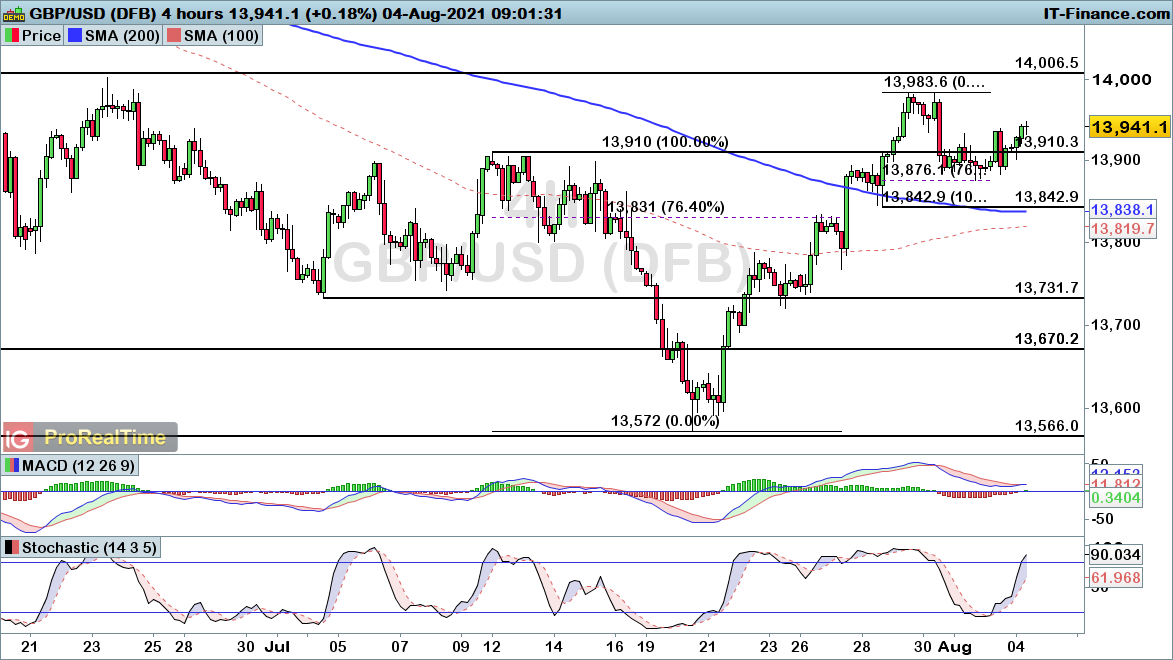
GBP/USD looks to have found support on the 76.4% Fibonacci support level once again, with the pair on the rise from that $1.3876 level in early trade.
With the recent trend of higher lows still in place, this somewhat drawn out retracement phase still does look like a buying opportunity. That bullish view holds unless the price falls below the $1.3843 swing low.
 Source: ProRealTime
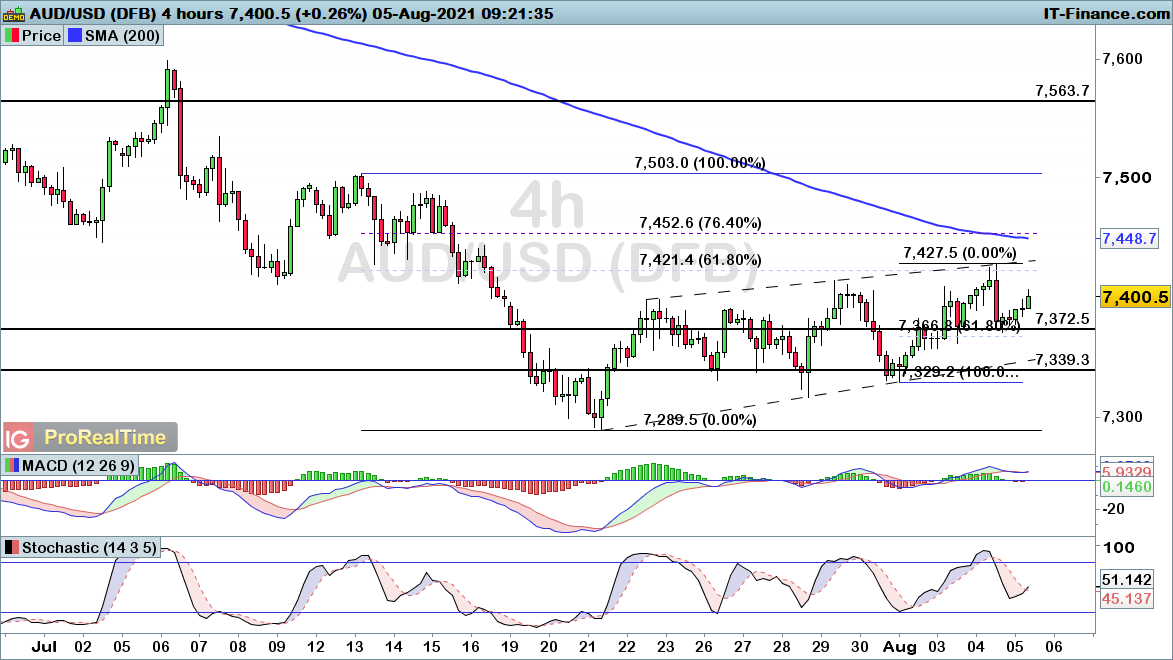
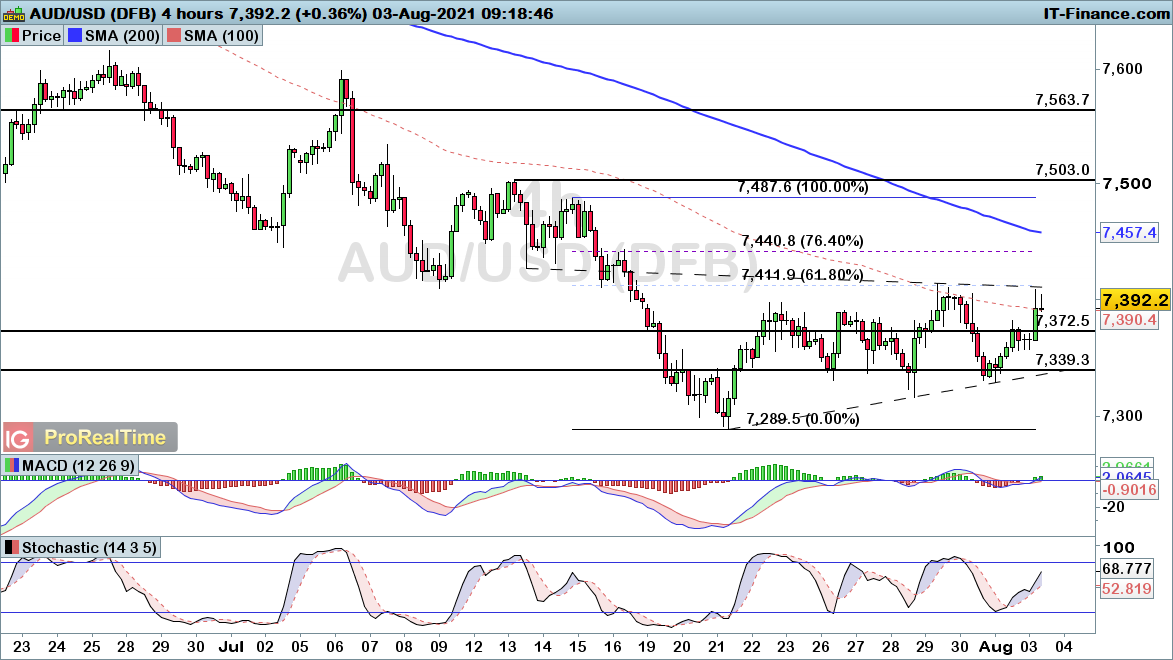
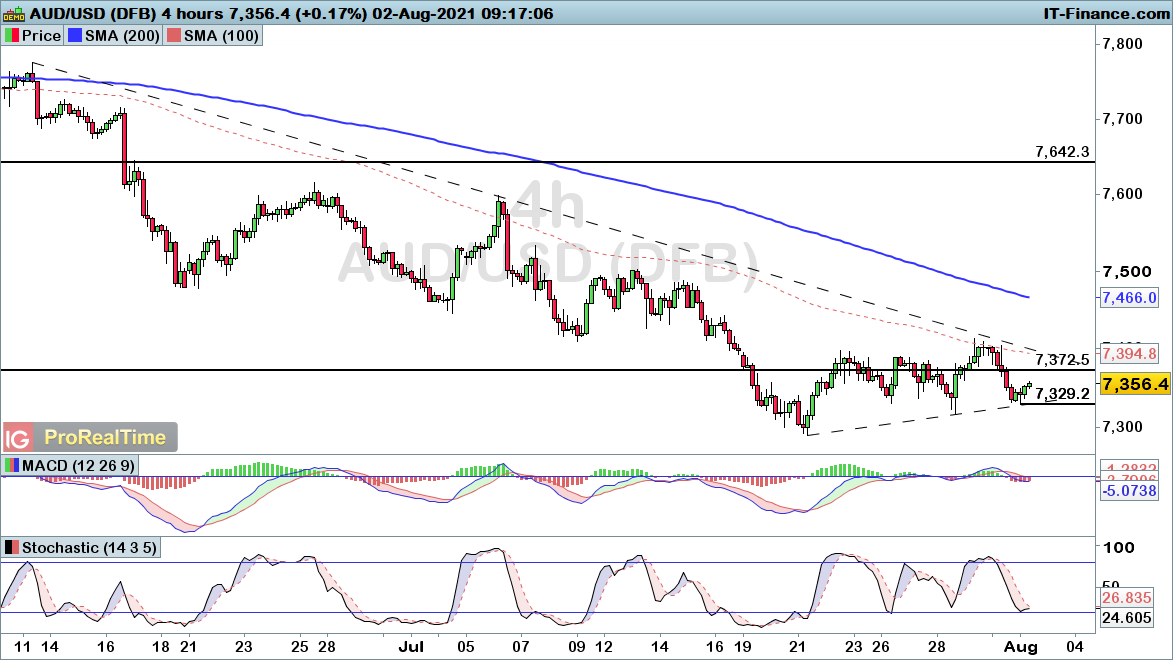
AUD/USD turning higher once again within rising channel
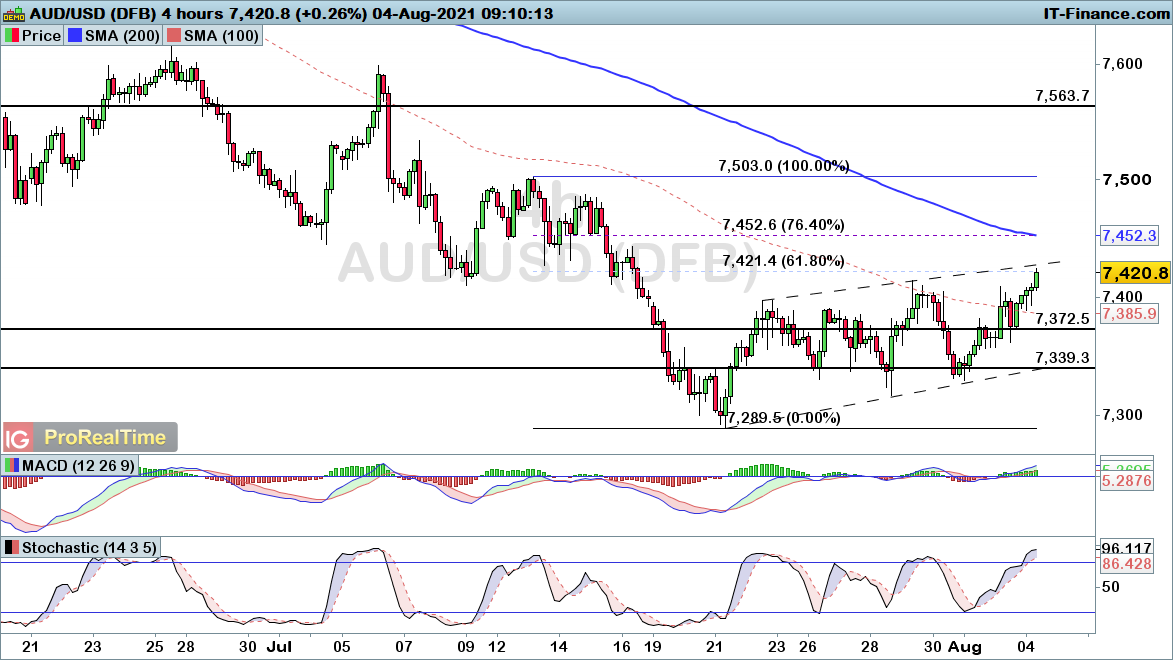
AUD/USD is turning higher once again this morning, following a 61.8% retracement that came after a rise back into trendline resistance. The recent rising channel remains in play here, with the price looking likely to push back up into trendline resistance.
As such, while there is a risk of a breakdown from this channel at some point, we would need to see a decline through $0.7329 to bring about a bearish signal. Until then, this channel points towards further upside for the pair. To the upside, keep an eye out for Fibonacci resistance in the form of $0.7421 and $0.7452.
 Source: ProRealTime
-
FTSE 100, DAX and Dow likely to bring buying opportunity
FTSE, DAX, and Dow consolidating, with a bullish opportunity coming into play as we await a directional breakout.
 Source: Bloomberg
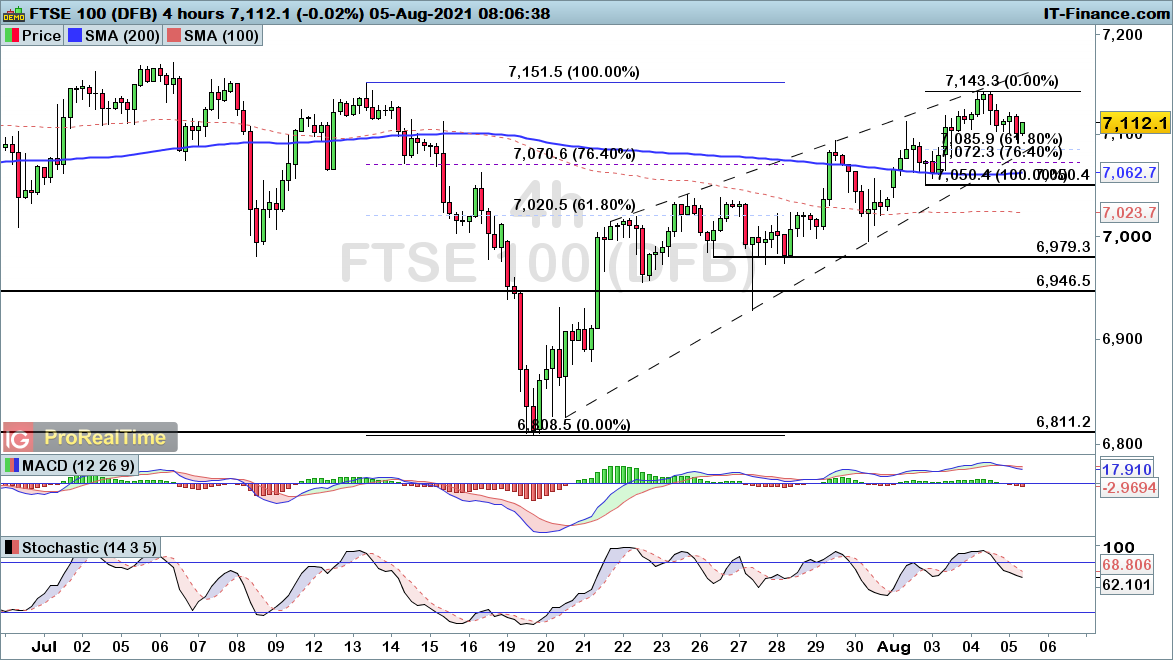
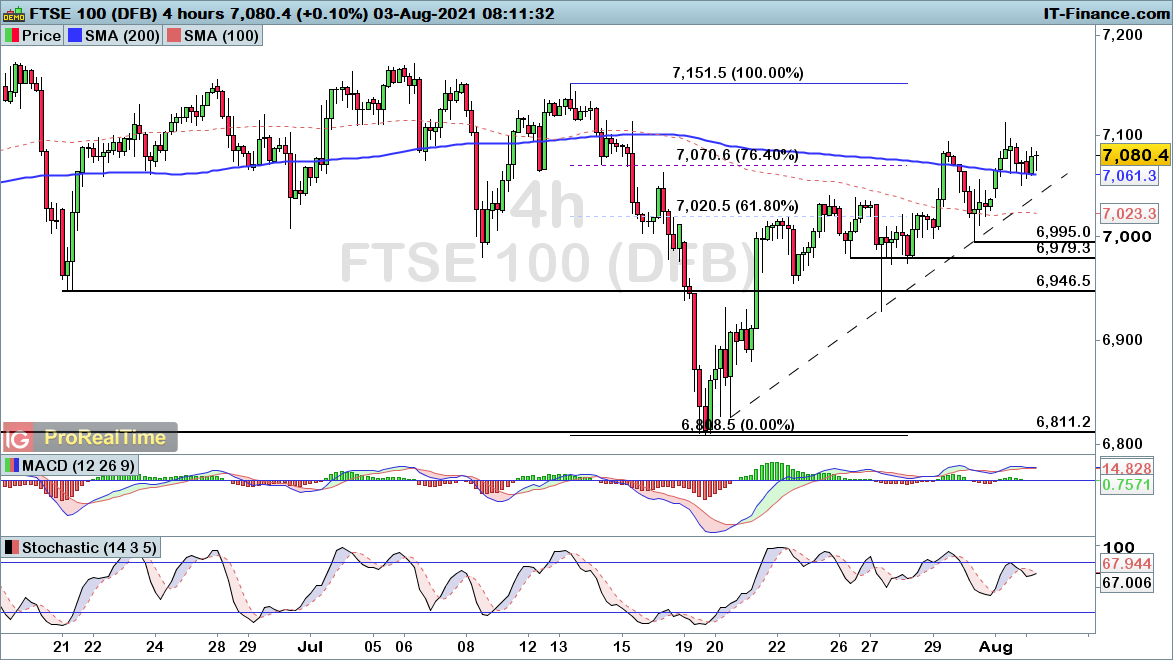
FTSE 100 pullback brings potential buying opportunity
The FTSE 100 has drifted lower overnight, with the index weakening from trendline resistance.
While the existence of both trendline support and resistance does highlight a rising wedge formation, we would only take a bearish lead from that if price falls back below the 7050 swing-low.
Until then, this pullback brings a potential for another long entry around the ascending trendline and deep Fibonacci support zone (7072-7086).
 Source: ProRealTime
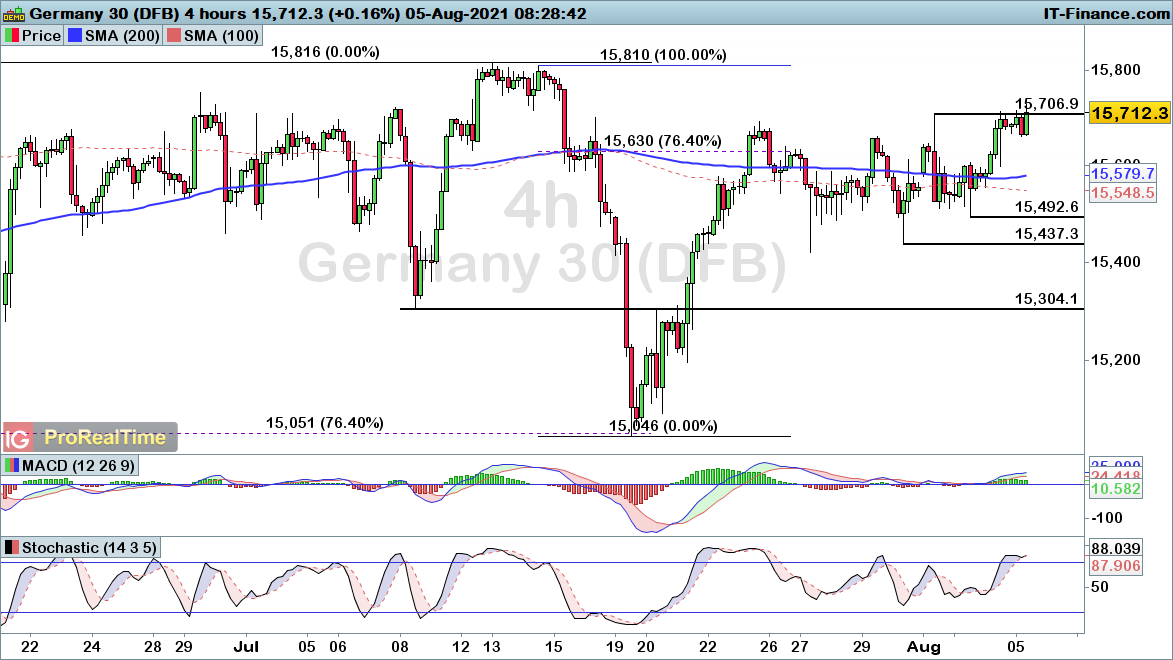
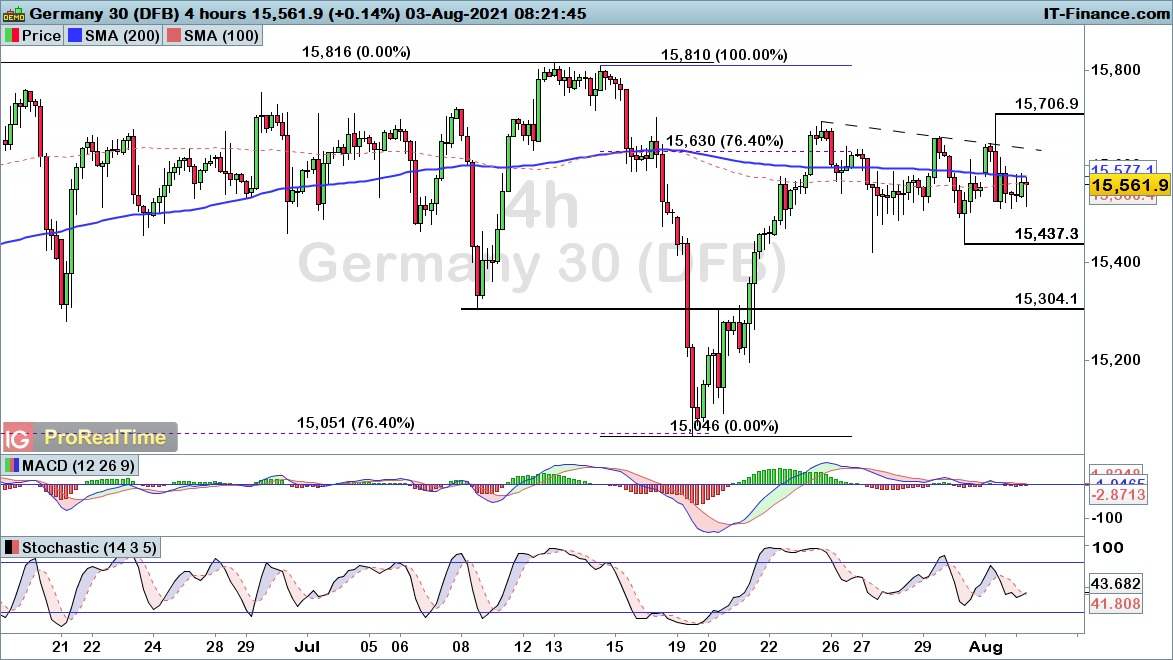
DAX consolidates below resistance as we await potential breakout
The DAX looks to be consolidating below the key 15706 resistance level this morning, with the index pausing in a bid to break out from this recent period of sideways price action.
A rise up through 15706 from here would point towards a breakout and likely push towards the prior high of 15816. As such, the ability to break resistance or simply remain within the consolidation zone will be key for the day ahead.
 Source: ProRealTime
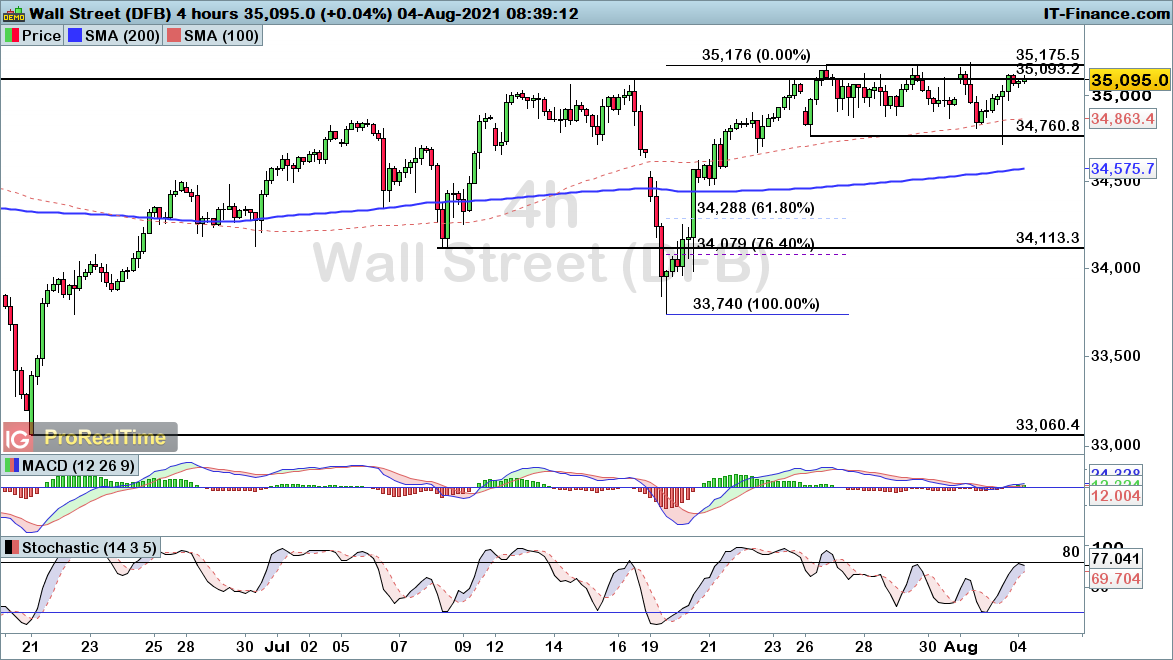
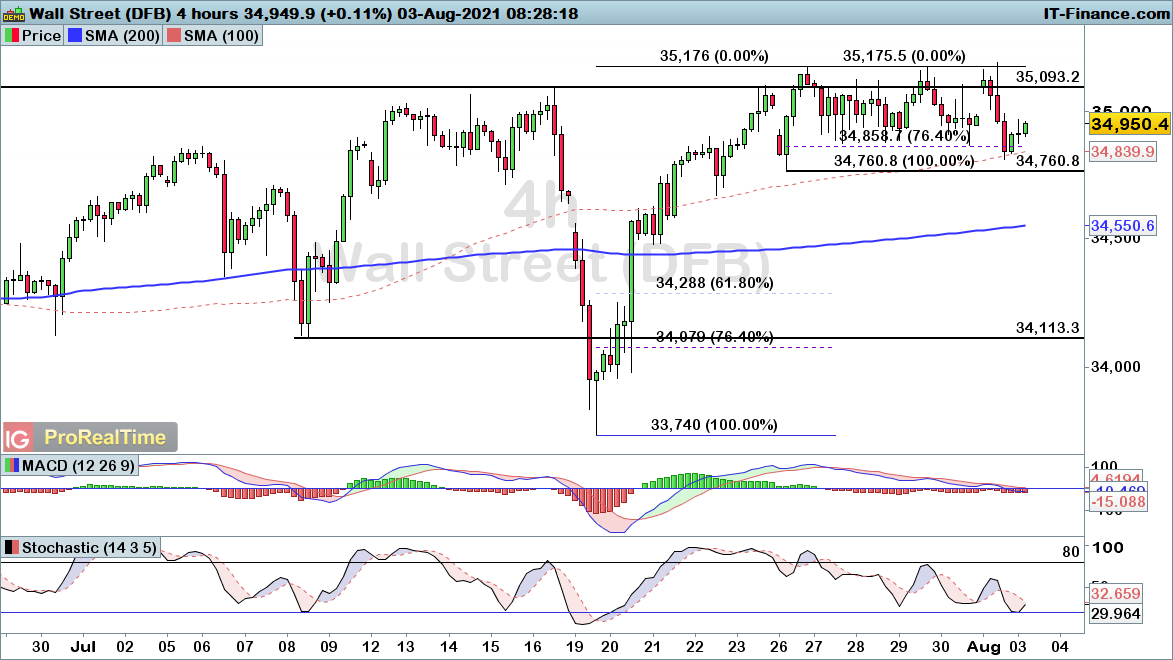
Dow Jones back into key support after Wednesday decline
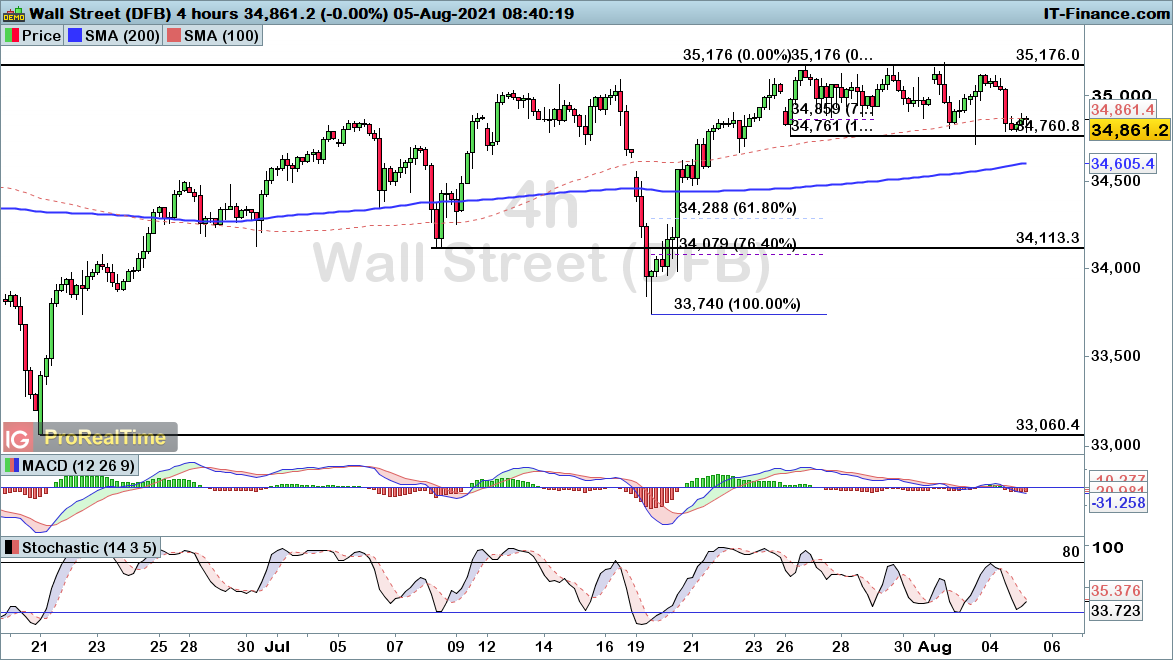
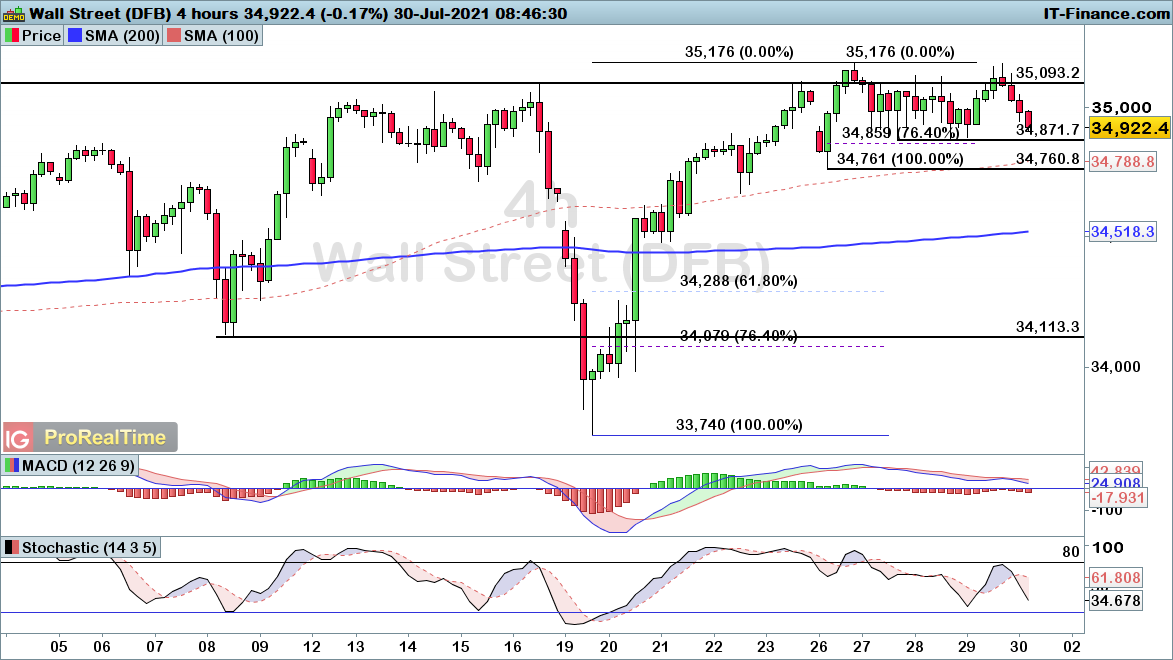
The Dow slumped back towards the key 34761 support level yesterday, with the index remaining within a fairly tight range over the course of the past fortnight.
A break out of this 34761-35176 zone will provide us with a fresh directional signal. Nonetheless, with price close to the lower boundary of that range, a bullish short-term outlook is favoured for a move back towards the top of this pattern.
 Source: ProRealTime

See opportunity on an index?
-
For more up to date news on how markets will open, the latest earnings and economic news, watch IGTV live in the platform at 07:30am UK.

Today’s coverage:
Team GB 4th in medals table at Tokyo 2020
Indices: CAC hits 20yr high as Europe overall expected to open mixed. Asia mostly up, ASX200 new record high. FTSE250, yesterday hi t a new record high
FX: Watching sterling ahead of Bank of England rate decision at noon. USD received a boost as more Fed commentators indicate bullish commentary
Equities: UBER multi-month low as costs outweigh good Q2 earnings. SIE raises guidance. Watching RR AIG today
Commods: Brent tests $70 support
-
EUR/USD, GBP/USD and AUD/USD on the rise once again
EUR/USD, GBP/USD and AUD/USD gain ground, but key resistance remains up ahead as the dollar weakens.
 Source: Bloomberg
EUR/USD consolidates after recent rise
EUR/USD continues to consolidate above the $1.185 support level, with the pair seemingly taking a break after the rally seen in late-July.
There is a good chance that this is simply a pause before we head higher once more, and thus it makes sense to watch for a rally through $1.1893, to bring about a fresh bullish outlook for the index. To the downside, a break below $1.185 would bring a more bearish short-term picture.
 Source: ProRealTime
GBP/USD on the rise from 76.4% Fibonacci support
GBP/USD has been slowly building momentum after a retracement into the 76.4% Fibonacci support level.
Yesterday’s initial rise failed to gain traction, yet we are pushing upwards once again today, in a bid to maintain the recent uptrend. With that in mind, a bullish outlook holds here, with a break below the $1.3843 swing-low required to negate that view.
 Source: ProRealTime
AUD/USD rallies back into key resistance
AUD/USD has continued its ascent following, with a hawkish Reserve Bank of Australia (RBA) statement earlier in the week. That has taken us back into a confluence of trendline and Fibonacci 61.8% resistance, raising questions over whether we could see the price retrace lower once again.
With the stochastic into overbought territory, it makes sense to keep an eye out for a potential break back below the 80 thresholds as a signal that price is set for another move back towards trendline support. As such, keep an eye out for the reaction to this resistance level as a gauge of where we go from here.
 Source: ProRealTime
-
Gold and Brent crude on the rise after recent weakness
Gold and Brent crude attempt to regain ground, with recent losses likely to result in another move higher before long.
 Source: Bloomberg
Gold continuing to stabilize around 61.8% retracement
Gold remains above the 61.8% Fibonacci support level, following the decline seen on Friday. The ability to remain above that level is key here, with a move through the $1820 threshold bringing a bullish breakout signal.
As such, keep an eye out for a potential recovery for this market, with a break back below $1790 required to bring a more bearish picture into play.
 Source: ProRealTime
Brent crude attempts to regain ground after recent selloff
Brent crude has been on the back foot over the course of the week thus far, with the break below $72.14 providing a bearish signal yesterday.
However, this pullback is viewed as a likely retracement of the wider rally from $67.06. As such, the bulls are expected to come back into play before long, but there is still a risk of further short-term downside.
With that in mind, the rise seen this morning remains at risk of fading, with a break up through $73.42 required to bring a more reliable bullish signal into play.
 Source: ProRealTime
-
FTSE 100, DAX and Dow rally back into key resistance
FTSE, DAX, and Dow are on the rise once again. However, with key resistance up ahead, questions remain.
 Source: Bloomberg
FTSE 100 rising back towards key resistance as recovery continues
The FTSE 100 has continued the ascent which has been playing out over the course of the past two weeks. With price rising back into a confluence of trendline and horizontal resistance, there is a significant region of resistance up ahead around 7151.
With that in mind, the ability to break through the 7151 resistance level will be key to continuing this bullish trend. To the downside, a break below the 7050 level would be required to bring a more bearish near-term outlook for the index.
 Source: ProRealTime
DAX reverses back up towards top end of consolidation zone
The DAX has started to regain ground once again, in a move that looks to push the index towards the top end of the consolidation zone seen over the past two weeks. With a wider bullish trend in play, there is a good chance we are going to see a bullish breakout when price does exit this pattern.
However, bulls would probably want to await a break and close above 15692 before taking any fresh positions, with the risk of further consolidation obviously still in play until then.
 Source: ProRealTime
Dow Jones back into resistance after latest rise
The Dow has been on the rise after a brief foray below 34760 support yesterday. That takes us back into a key 35175 resistance level, with a break above this point bringing about a fresh bullish signal for the index.
With that in mind, it makes sense to watch out for a potential breakout through 35175 to continue the bullish trend. Until that happens, there is a good chance we will see price drift lower to remain within the recent consolidation zone.
 Source: ProRealTime
See opportunity on an index?
-
For more up to date news on how markets will open, the latest earnings and economic news, watch IGTV live in the platform at 07:30am UK.
Today’s coverage:
ASIA: Caixin China services index surged to 54.9 in July from a 14-month low of 50.3 in the previous reading. Nikkei underperforming in Asia.
US: Robinhood behaves like a meme stock, rallying 24% on no notable news, surges beyond IPO price
EARNINGS: Lyft Q2 revenue +125% you, Uber earnings tonight
Commerzbank H1 Oper results EUR 570mn vs loss 74 mn you, revenue slight miss
Next TS, Taylor Wimpey, Legal and General at 7
COMMODS: Brent crude drifting lower heading towards support at $72
-
EUR/USD, GBP/USD and AUD/USD gain ground in early trade
EUR/USD, GBP/USD and AUD/USD on the rise, but questions remain for the Australian dollar despite hawkish RBA stance.
 Source: Bloomberg
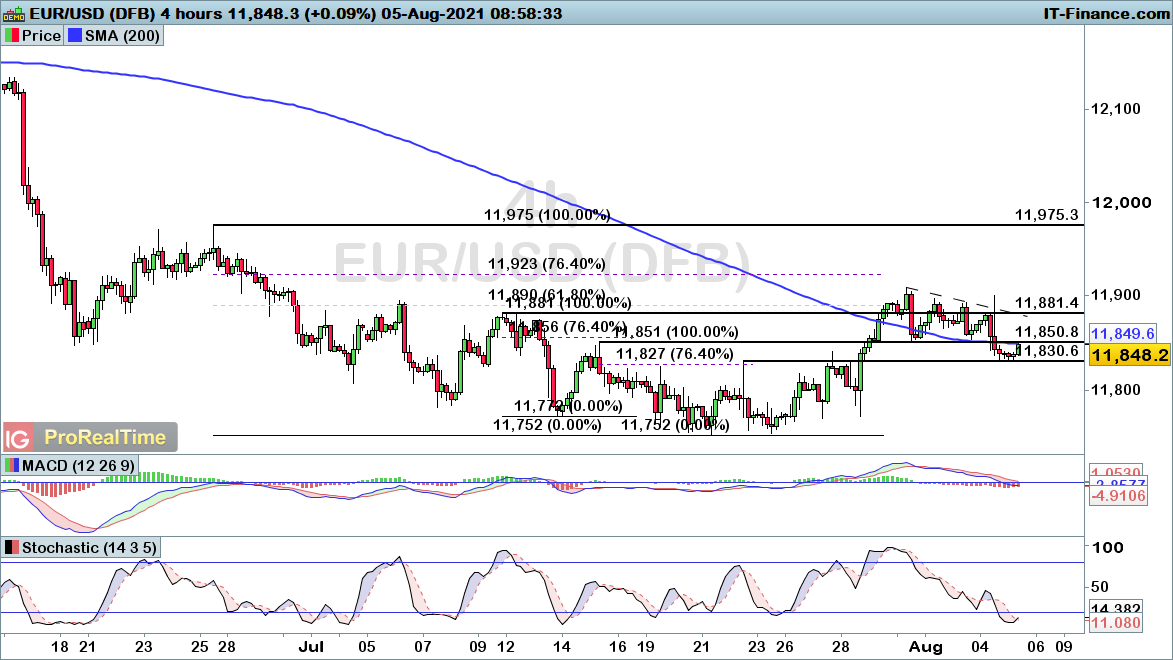
EUR/USD awaits breakout from continuation pattern
EUR/USD is trading within a pennant formation, with the pair pausing after the gains seen last week.
To the upside, we do need to keep an eye out for a potential break through the $1.1897 level as a signal that we are set for another leg higher. Meanwhile, a drop back below $1.185 would point towards a deeper pullback coming into play.
 Source: ProRealTime
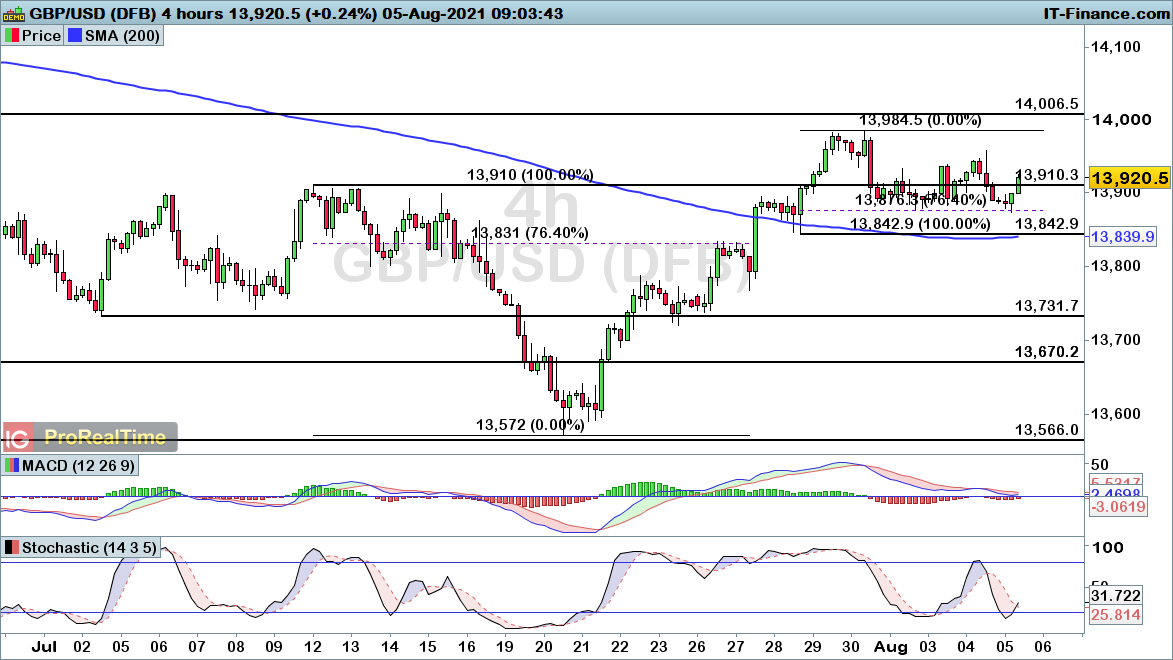
GBP/USD turning higher after 76.4% pullback
GBP/USD has started to regain bullish momentum following a retracement into the 76.4% Fibonacci level at $1.3876.
The ongoing uptrend points towards a bullish session ahead, with a positive outlook in play unless the price drops below $1.3843.
 Source: ProRealTime
AUD/USD back into confluence of resistance
AUD/USD has been on the rise overnight, with a hawkish Reserve Bank of Australia (RBA) stance bringing gains for the Australian dollar.
However, that takes us into the confluence of 61.8% and trendline resistance. With the trend of lower highs in place, this recent grind higher still looks like a potential precursor to further weakness unless the price breaks up through the $0.7503 swing-high.
 Source: ProRealTime
-
Gold and Brent crude start to regain ground after Monday weakness
Gold and Brent crude look to regain ground after recent weakness, but do recent losses point towards further downside to come?
 Source: Bloomberg
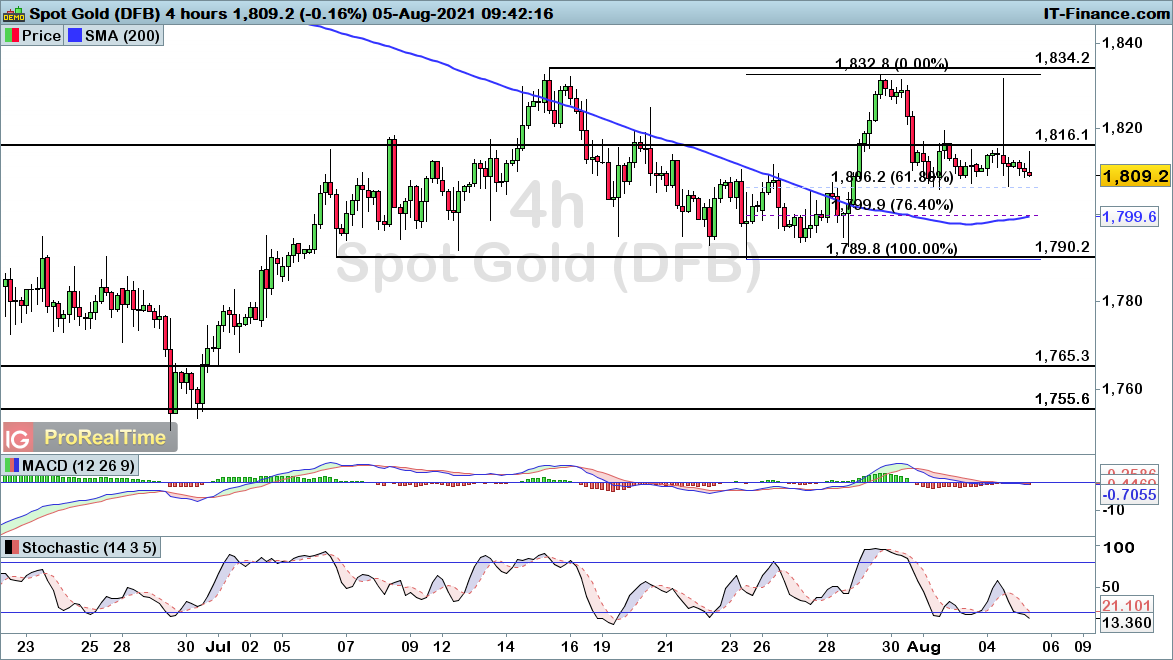
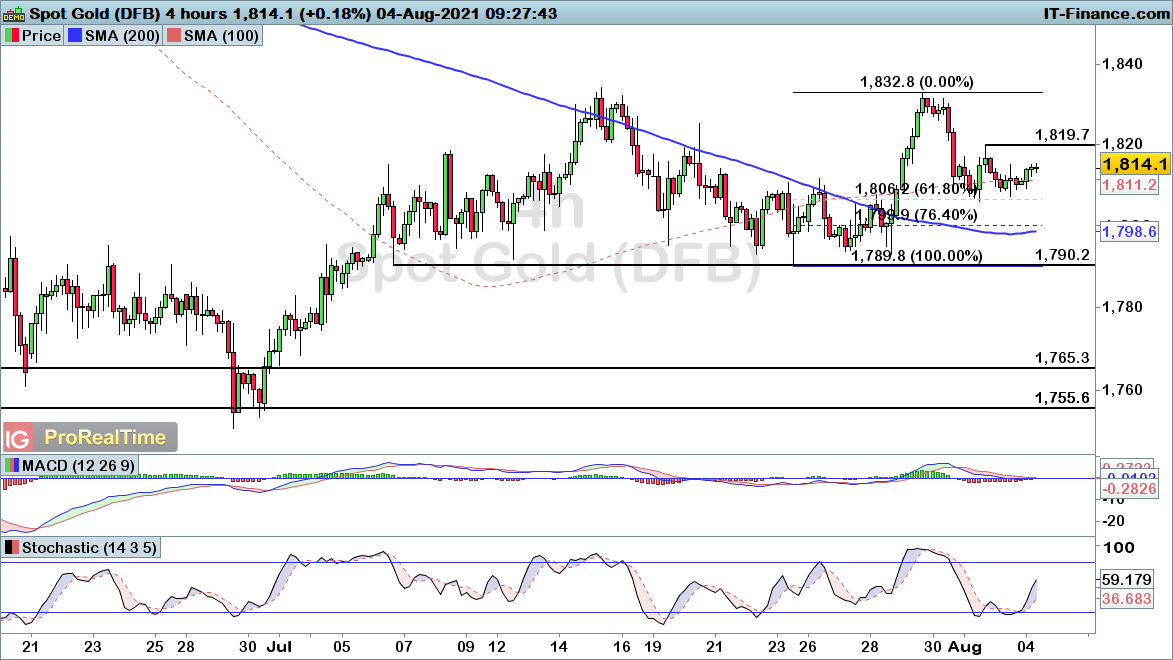
Gold attempting to regain ground after 61.8% retracement
Gold has started to steady itself after the recent decline into the 61.8% Fibonacci support level at $1806.
Coming off the back of a rally into the $1834 region, there is a chance we could see the bulls come back into play before long. Greater confidence comes into play with a rise through $1819 bringing greater confidence that this pullback is over.
Ultimately this current pullback does look like a retracement and precursor to further gains unless price drops back below the $1790 support level.
 Source: ProRealTime
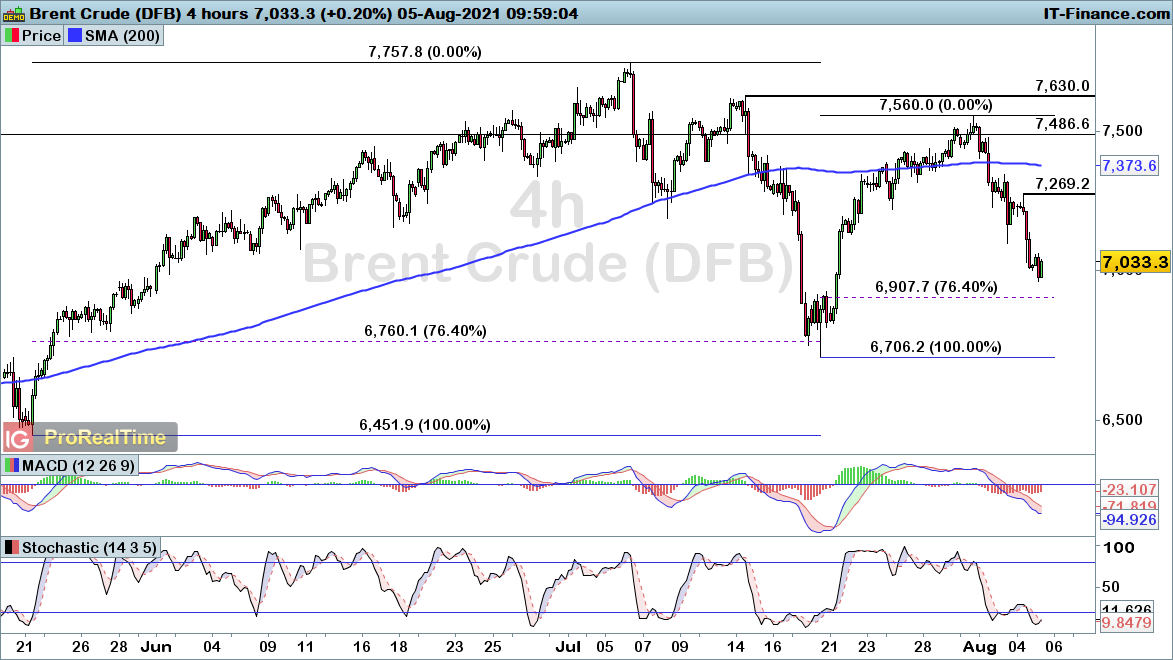
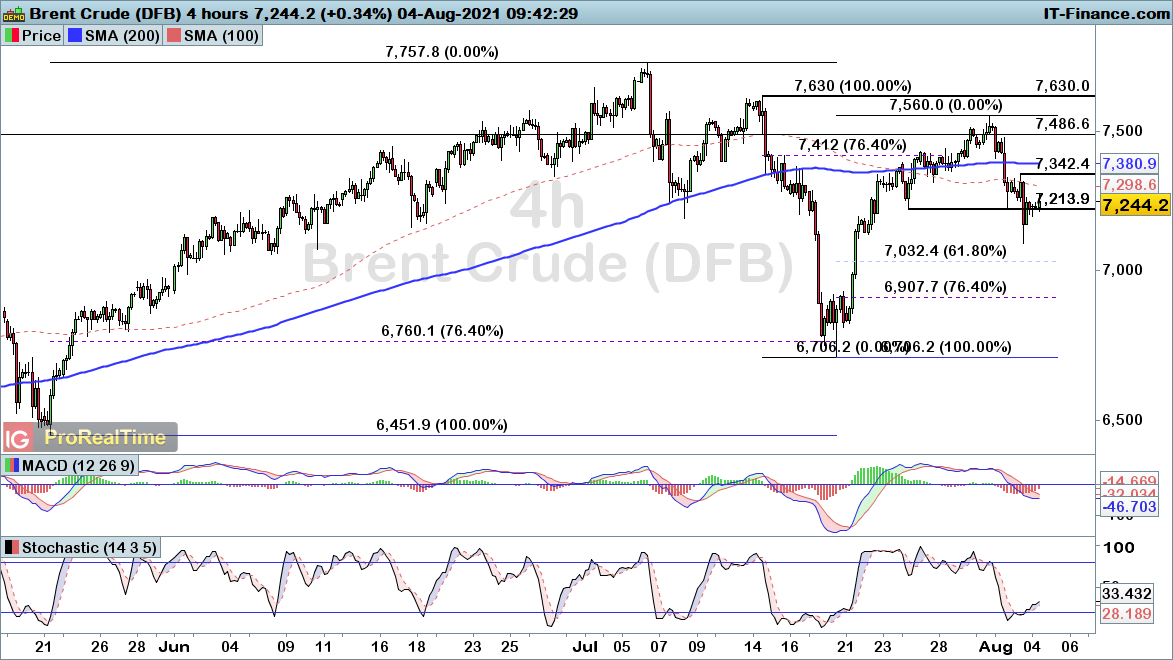
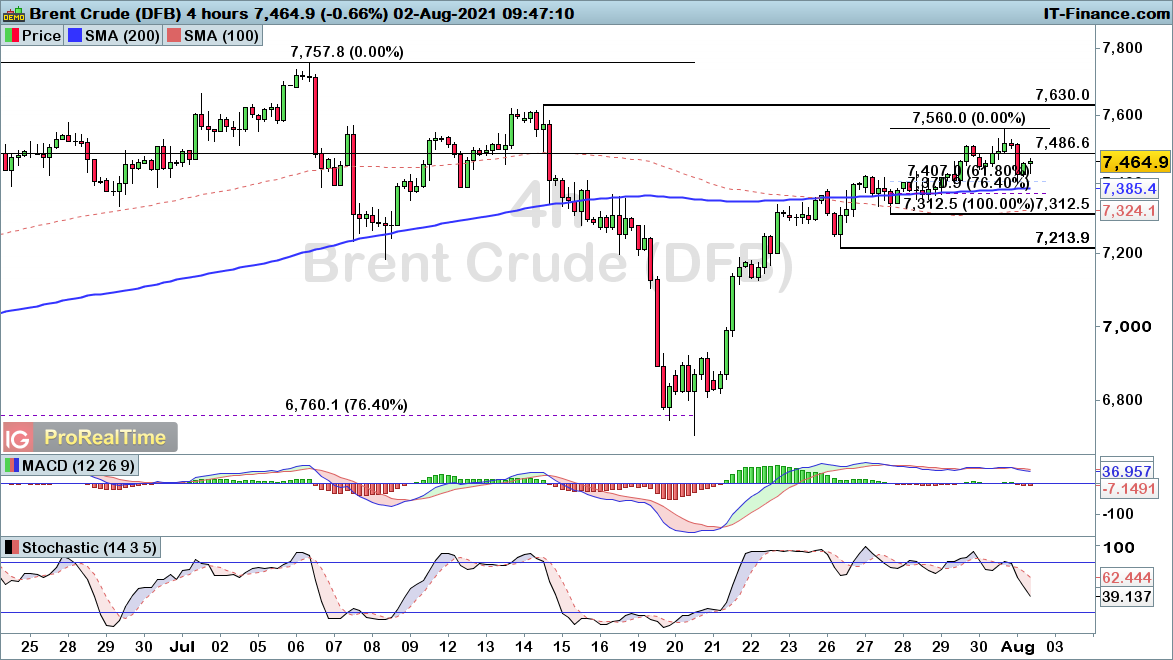
Brent crude starts to gain strength after decline into key support
Brent crude has been on the back foot in the beginning of the week, with price falling back down into the $7214 support level established last Monday.
The decline through $73.12 does raise question marks over the potential for further downside following the recent breakdown. A break below the $72.14 level would bring greater confidence in a more protracted breakdown.
Nonetheless, for the time being, we are seeing the bulls come back into play as price aims to regain ground lost yesterday.
 Source: ProRealTime
See opportunity on a commodity?
-

Hello IG Community
We are writing to you inform you this Stock Request forum will be used to make a request for a stock to be traded. Your request will be sent through to our share dealing desk and can expect a response on request within 24 hours. We will keep you updated on all stock requests made.
When making a stock request please kindly give the following information:
Name of stock
Name of Stock Exchange
Leverage or Share dealing
Ticker
Country of the stock
Market Cap
If the stock trades on OTC then we are unable to offer, we do not deal in OTC stocks. If you search on Google Finance or Yahoo Finance it will tell you what exchange the stock trades under the stock name and the market cap.


All the best - MongiIG
-
 1
1
-
-
FTSE 100, DAX and Dow expected to gain ground despite consolidation
FTSE, DAX, and Dow struggle to maintain bullish momentum, but will we see the bulls come back into play before long?
 Source: Bloomberg
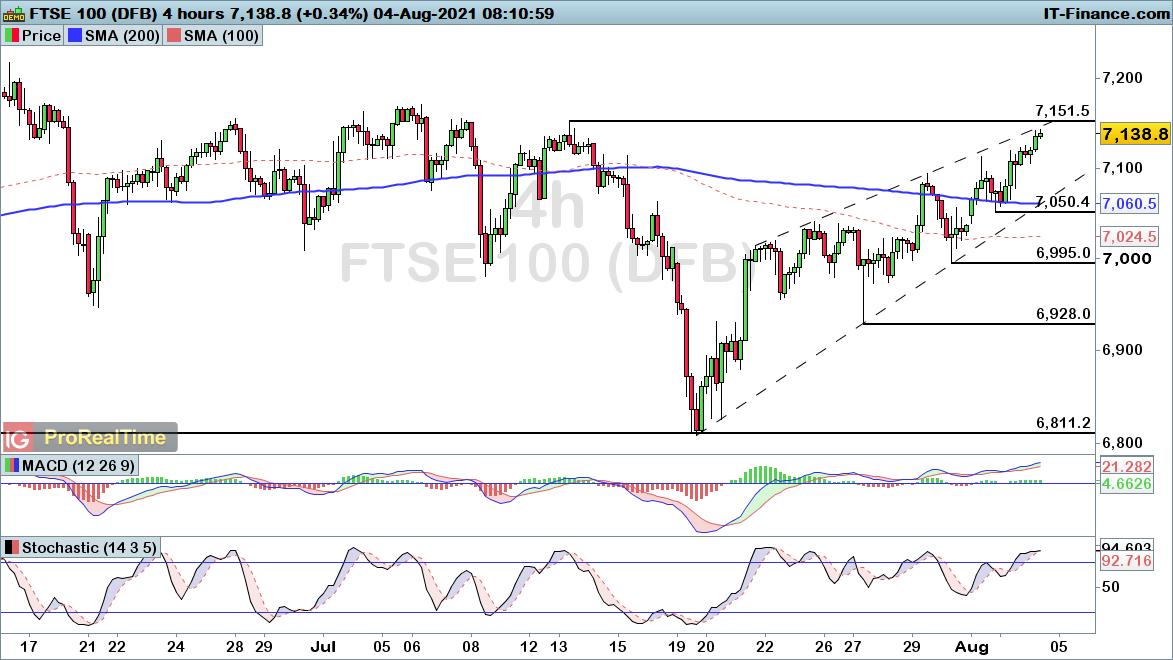
FTSE 100 falls back towards trendline support within recovery phase
The FTSE 100 has been on the rise over the course of the past week, with price rising up through the 7100 level yesterday.
However, we are seeing some consolidation below that level, with price moving back towards ascending trendline support. A break below trendline support would raise questions over the ability to maintain this bullish recovery.
Ultimately, however, we would need to see a break below 6995 if we were to negate the current bullish outlook for the FTSE.
 Source: ProRealTime
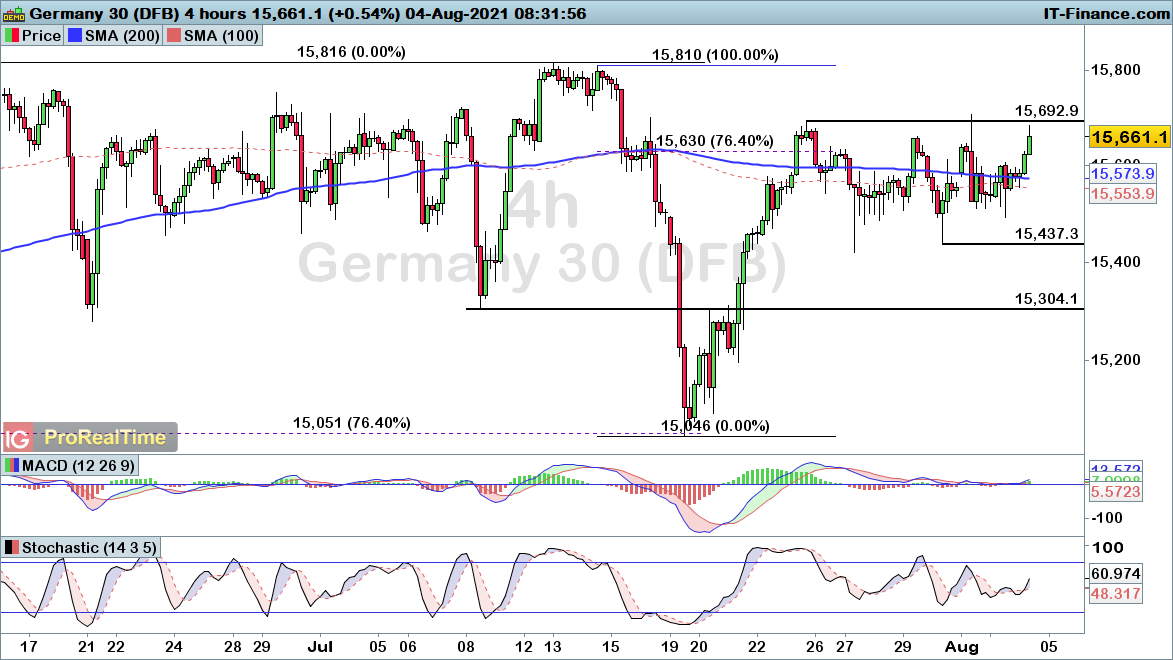
DAX continues to consolidate after recent gains
The DAX has been consolidating over the course of the past week, with yesterday’s early spike failing to hold as price fell back into the consolidation zone.
We remain within that zone and await another break higher. To the downside, a decline through 15437 support would bring a more bearish short-term outlook into play.
 Source: ProRealTime
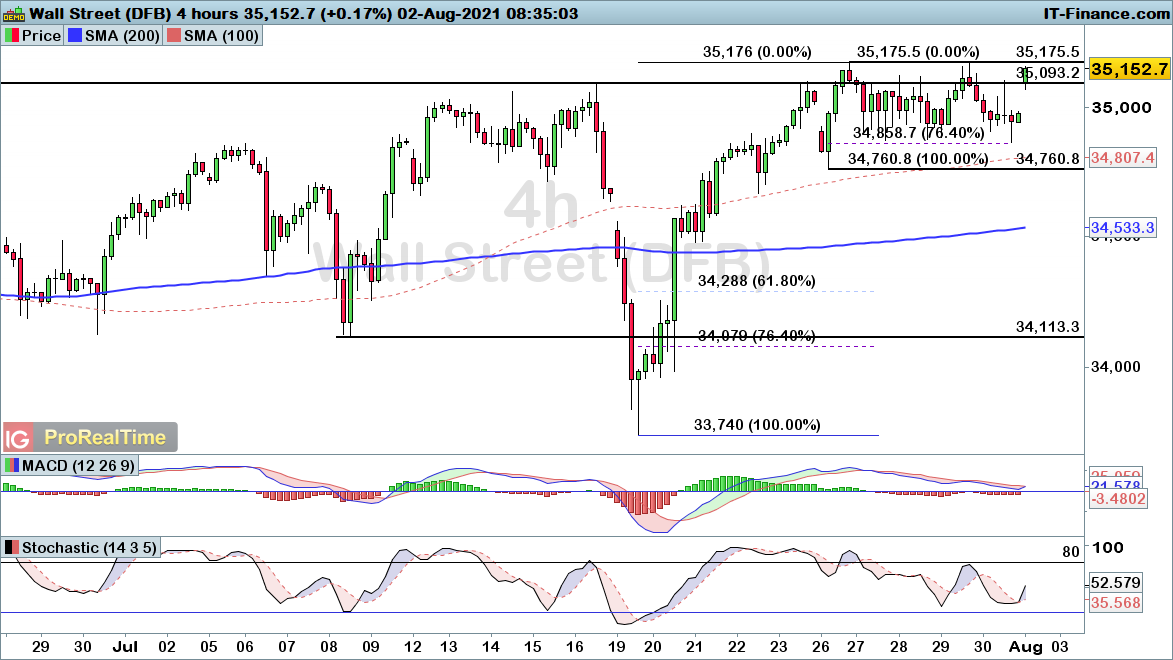
Dow Jones selloff brings potential buying opportunity
The Dow has been on the back foot since yesterday’s rise back into the key 35176 resistance level. With price starting to rise, it is worthwhile watching for another rally back towards the top end of this recent consolidation phase.
A break back below the 34761 support level would be required to bring a more bearish short-term picture.
 Source: ProRealTime
See opportunity on an index?
-
For more up to date news on how markets will open, the latest earnings and economic news, watch IGTV live in the platform at 07:30am UK.
Today’s coverage:
ASIA: RBA sticks with tapering plan, forecasts conditions for rate rises won’t be met until 2024
Tencent slumps 10% amid regulation concern as state-backed media describes gaming as ‘opium’
US: Dow swing to loss into close reversing from an intraday record on weaker US ISM manuf. PMI
EARNINGS: Greggs, BP out at 7am, Stellantis due later
StanChart resumes dividend, announces share buyback after H1 profit beats.SocGen ups 2021 FY guidance, Q2 net income beats
COMMODS: Oil continues decline after shedding 3% on Monday as OPEC supply hit 15-month high and China demand concerns weigh
-

The dollar edged lower Monday, just above a one-month low, in tight trading ranges ahead of the release of key U.S. employment data later in the week which could influence Federal Reserve policy.
At 3:05 AM ET (0705 GMT), the Dollar Index, which tracks the greenback against a basket of six other currencies, traded 0.1% lower at 92.102, just above Friday’s low of 91.775, the weakest since June 28.
USD/JPY edged lower to 109.67, GBP/USD drifted higher to 1.3905, and EUR/USD traded largely flat at 1.1867, even with German retail sales surprising to the upside, growing 4.2% in June. .
The dollar index dropped close to 1% last week after Fed Chairman Jerome Powell stated, following the central bank’s July meeting, that interest rate increases were still a long way away and more economic progress was needed, particularly in terms of jobs being created, before the central bank started tapering its huge bond-buying program.
Fed board member Lael Brainard restated the central bank's focus on further labor market progress at the weekend, while Minnesota Fed President Neal Kashkari warned that the spread of the delta variant of Covid-19 could slow the economy in the second half.
This puts Friday’s July nonfarm payrolls release firmly into focus, with economists looking for an increase of 900,000 jobs, which would be the biggest increase for 11 months, after a forecast-beating 850,000 in June.
“A strong US jobs report is anticipated, and it will support speculation that at the Jackson Hole conference at the end of August, Chair Powell will provide more guidance about the pace and composition of the Fed's bond purchases,” said Marc Chandler, Chief Market Strategist at Bannockburn Global Forex.
Also of interest will be the meeting of the Reserve Bank of Australia early Tuesday, with this central bank under pressure given the Covid-19 lockdowns currently affecting much of the country.
“The lockdown in Sydney has been extended until the end of August, and the Reserve Bank of Australia will likely abort plans to reduce its bond-buying. Instead, it will likely provide more support, probably via increased bond purchases,” Chandler added.
At 3 AM ET, AUD/USD traded marginally lower at 0.7342, with the Australian dollar having been the only major currency to fall against the U.S. dollar last week.
USD/CNY rose 0.1% to 6.4645 after China’s factory activity growth slowed sharply in July, with the Caixin manufacturing purchasing managers’ index falling to 50.3, its lowest level since April 2020.
By Peter Nurse (Investing.com), 2 August 2021.
-
EUR/USD, GBP/USD and AUD/USD on the rise after recent retracement
Dollar weakness expected to play out as EUR/USD, GBP/USD and AUD/USD turn higher following a recent retracement phase.
EUR/USD turning higher from key support
EUR/USD has seen the previous high of $1.185 turn into support, with the pair moving higher in early trade. The recent rally took us into the deep Fibonacci zone and thus it is worthwhile watching the $1.189 and $1.1923 levels as potential resistance on the way up.
For the short term we can see the potential for further upside as we build on the trend of higher lows. As such, a positive outlook holds unless the price falls back below the $1.185 support level.
 Source: ProRealTime
GBP/USD starts to regain ground after recent pullback
GBP/USD is back on the front foot this morning, as it looks to regain its positive momentum after a deep pullback on Friday.
That retracement provides us with a buying opportunity given the recent uptrend, where a bullish outlook holds unless the pair drops below the $1.3842 swing-low.
 Source: ProRealTime
AUD/USD on the rise from trendline support
AUD/USD has been lacking momentum of late, with the pair falling back into trendline support on Friday. That trendline has held up, with the price on the rise in early trade today.
That is likely to continue as we move through the day, with the dollar expected to weaken as stocks rise. With that in mind, short-term gains look likely to take us back towards trendline resistance, with a break back below the $0.7329 swing low required to negate that bullish outlook.
 Source: ProRealTime
-
Gold and Brent crude weaken after recent gains, but bullish structure remains
Gold and Brent crude weaken after recent gains, but the bullish momentum may not be over quite yet.
 Source: Bloomberg
Gold pullback brings questions around Fibonacci support
Gold has been on the back foot since Thursday’s peak, with the precious metal falling back into the 61.8% Fibonacci support level at $1806.
The recent rise back into the $1834 level does point towards a potential continuation of the recent bullish phase, although the break through $1789 would instead provide a bearish double top formation.
As such, there is an argument on either side, with the respect or lack of respect shown to the Fibonacci levels at $1806 and $1799 proving key in telling us where we go from here.
Source: ProRealTime
Brent crude pullback unlikely to last
Brent crude has weakened in early trade today, with price falling into the 61.8% Fibonacci support level at $74.97.
The ongoing uptrend points towards the bulls coming back into play around these levels, with a break below the $73.12 swing-low required to bring a more negative look into play.
Until then, further upside looks likely to take hold in a bid to push back into the key $76.30 resistance level.
 Source: ProRealTime
-
FTSE 100, DAX and Dow head higher in early trade
FTSE, DAX, and Dow surge higher in early trade, with the wider uptrend kicking in once again.
 Source: Bloomberg
FTSE 100 turning higher once again after Friday retracement
The FTSE 100 has been on the rise in early trade today, with the index continuing its uptrend as expected. The pullback on Friday saw price fall back into the 61.8% Fibonacci support level, with the uptrend subsequently kicking in today.
With that in mind, a bullish outlook continues to hold unless we see price fall back below the 6995 level. Near-term resistance of note comes in the form of the descending trendline and the 7171 mark.
 Source: ProRealTime
DAX breaks higher from consolidation phase
The DAX has also kicked off the week with a bang, as an upward move in early trade brings us through the 15661 level to end the recent consolidation phase. That points towards a continuation of the recovery following the mid-June decline into a wider 76.4% Fibonacci support level of 15051.
With that in mind, the break seen this morning points towards further upside to come, with a move back below 15437 needed to detract from this bullish outlook.
 Source: ProRealTime
Dow Jones breaks back towards the record highs
The Dow has gapped up towards the prior high of 35175 this morning, with the index looking to form a fresh high after a retracement into the 76.4% Fibonacci level.
A break back below the 34761 level negates the bullish view, with a positive outlook holding until then.
 Source: ProRealTime
-
Hi @Guest ugt, what timeframes are you using when you apply the 14MA and 8MA ?
Your feedback will be greatly appreciated. Thanks
MongiIG
-
Dollar declines send EUR/USD and GBP/USD higher, as USD/CAD falls into support
Dollar weakness continues, with EUR/USD and GBP/USD on the rise as USD/CAD falls into key support.
 Source: Bloomberg
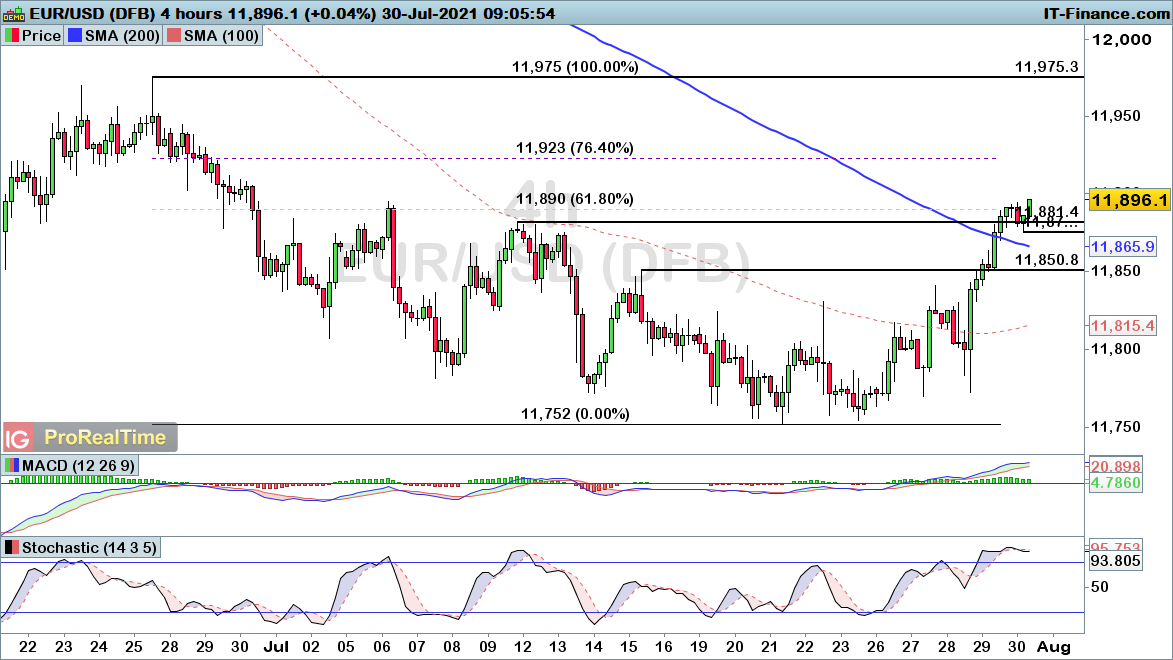
EUR/USD pushes through Fibonacci resistance to build on bullish break
EUR/USD is building on the bullish breakout seen yesterday, with the price rising through the 61.8% Fibonacci level despite a brief pullback at that level.
This push up through to a one-month high points towards further upside coming into play from here, with a drop back below the overnight lows of $1.1875 required to bring about a more neutral outlook. Until then, further upside looks likely as we push up towards the 76.4% Fibonacci level at $1.1923.
 Source: ProRealTime
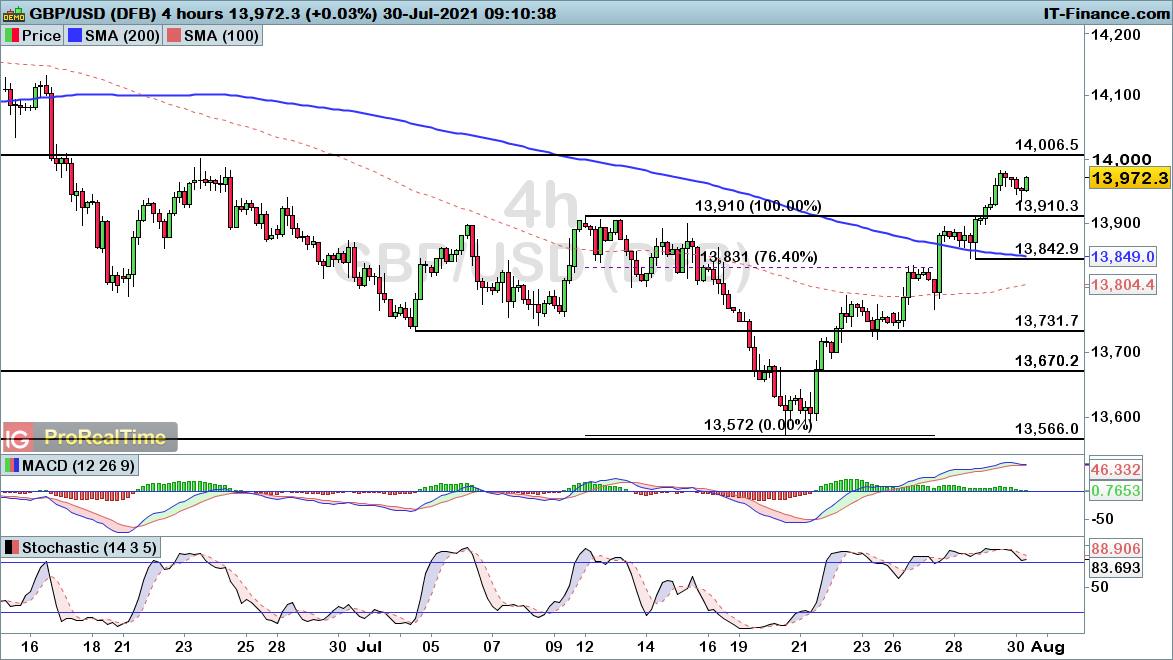
GBP/USD continues to build on bullish week
GBP/USD continues to gain ground this morning, with the pair expected to continue its trend higher after seeing the price rise through the $1.391 resistance level.
A break back below the $1.3843 level would bring a more bearish outlook into play. Until then, further gains look likely for GBP/USD.
 Source: ProRealTime
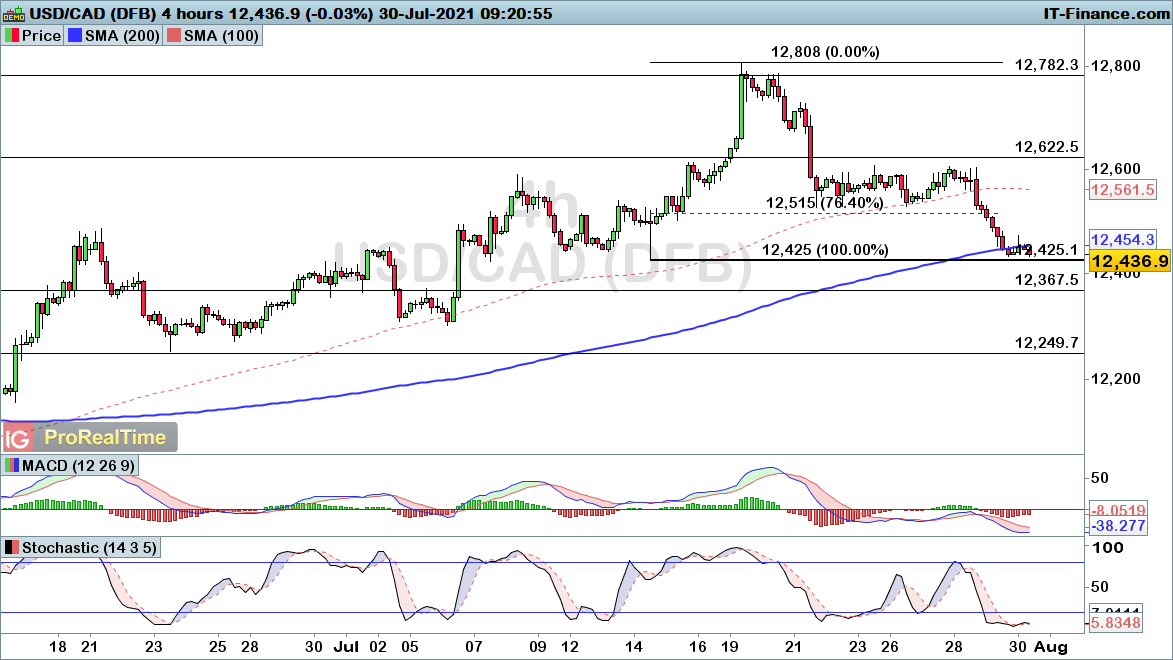
USD/CAD falls back into key support after recent breakdown
USD/CAD has slumped back into the crucial $1.2425 support level this morning, with the pair on the slide since dropping through 76.4% Fibonacci support.
A break back below that $1.2425 support level would bring about a bearish reversal signal for the pair. As such, sentiment for the day ahead looks to be dictated by the reaction to this key support level
 Source: ProRealTime
-
Gold and Brent crude continue to gain ground as the dollar declines
Gold and Brent crude continue to rise, with key resistance levels coming into play as we close out the week.
 Source: Bloomberg
Gold rallies into key resistance level
Gold has taken advantage of the dollar decline, with the precious metal rising back into the key $1834 resistance level.
The ability to break through that level will be key here, with a reversal or break providing a clue of where we go from here.
 Source: ProRealTime
Brent crude looks likely to continue recovery trend
Brent crude has been on the rise over the course of the week, with price pushing up through the 76.4% Fibonacci resistance level yesterday.
That points towards a likely rise through the $76.30 swing-high before long, with a bullish outlook in place unless price falls back below the latest swing low of $73.12.
 Source: ProRealTime
-
FTSE 100, DAX and Dow head back into key support
FTSE, DAX, and Dow head lower, but will this retracement represent a buying opportunity for stocks?
Source: Bloomberg
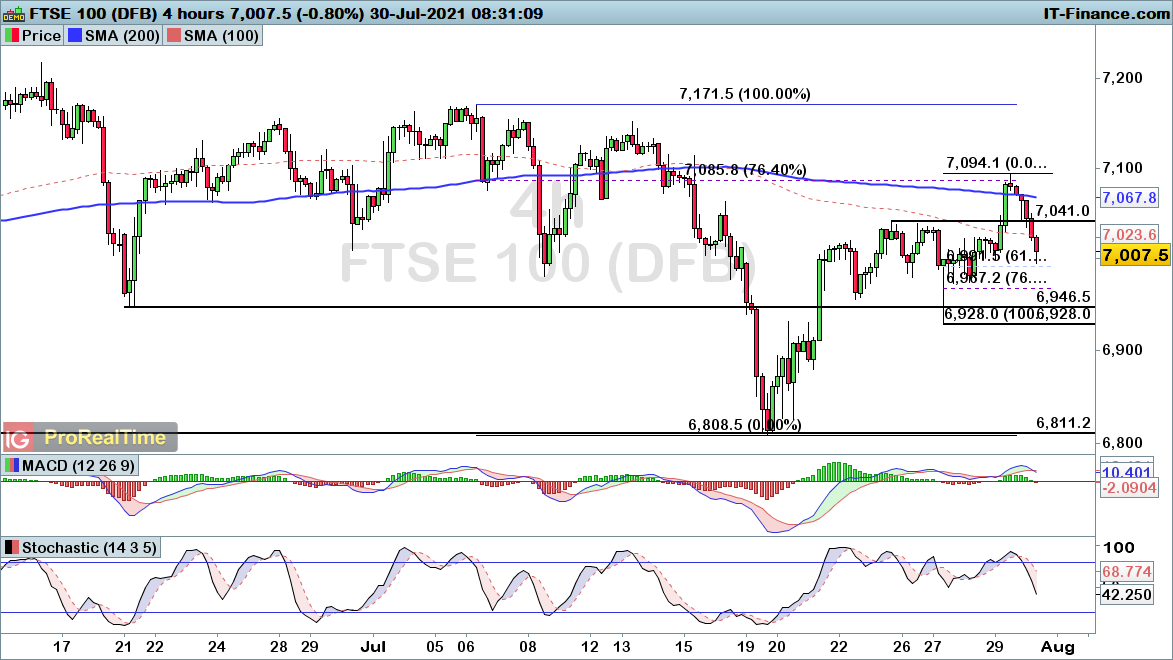
FTSE 100 turns lower from Fibonacci resistance
The FTSE 100 has been on the back foot in early trade, with the index falling back from the 76.4% Fibonacci resistance level of 7085. That decline may not necessarily mark the beginning of a wider bearish phase though, with a break below 6928 required to signal a more protracted downside move for the index.
Until then, it is worthwhile watching to see another potential higher low, with the near-term Fibonacci levels of 6991 (61.8%) and 6967 (76.4%) bringing key levels that could spark another upside move.
Source: ProRealTime
DAX declines provide warning sign for the FTSE
The DAX has similarly sold off from the 76.4% Fibonacci resistance level of 15630, with the index falling towards the key 15420 level. A drop below that level would bring a potential bearish picture into play for the day ahead, highlighting the possibility of a more protracted move lower in Europe.
As such, watch out for whether price breaks the 15420 level as a gauge of sentiment for the day ahead, with such a break bringing about a bearish double top formation.
Source: ProRealTime
Dow Jones falls back towards key support
The Dow has similarly been on the back foot this morning, with the index falling back towards the 34859 level respected over the course of past three days.
With that in mind, watch out for price to potentially find support around the 34859 and 76.4% Fibonacci support zone for the bulls to potentially come back into play. A decline through 34761 would be required to bring a wider bearish picture into play.
 Source: ProRealTime
-
Barclays have proven just why they should retain their investment banking arm, with a jump in profits pointing towards a likely bullish drive from here.
 Source: Bloomberg
Barclays earnings provide bullish impetus
Barclays has given its shareholders plenty to celebrate today, with the bank posting an impressive £5 billion profit for the first half (H1) of 2021.
That ability to almost quadruple their profits for H1 provided a fresh bout of buybacks and dividends to reward investors banking on a pro-cyclical boost for the sector.
Part of the boost came from the ability to claw back provisions that had been made in anticipation of bad debts, with Covid-19 sparking a wave of defaults.
However, the government’s supportive measures managed to stave off much of those effects, with banks reclaiming those funds set aside in preparation of such losses. Meanwhile, the bank saw positive signs that consumer demand was starting to grow once again.
Nonetheless, much of the profits seen at Barclays came thanks to their investment banking division, drawing a line between the bank and its UK peers. The US banks have historically outperformed UK banks thanks in part to their more volatile trading divisions.
However, while shareholders had been pushing Barclays to shift away from their investment banking exposure, Jes Staley’s decision to fight off those moves have been justified today.
Instead, we could now see investors specifically look towards Barclays as a potential outperformer thanks to that greater risk profile.
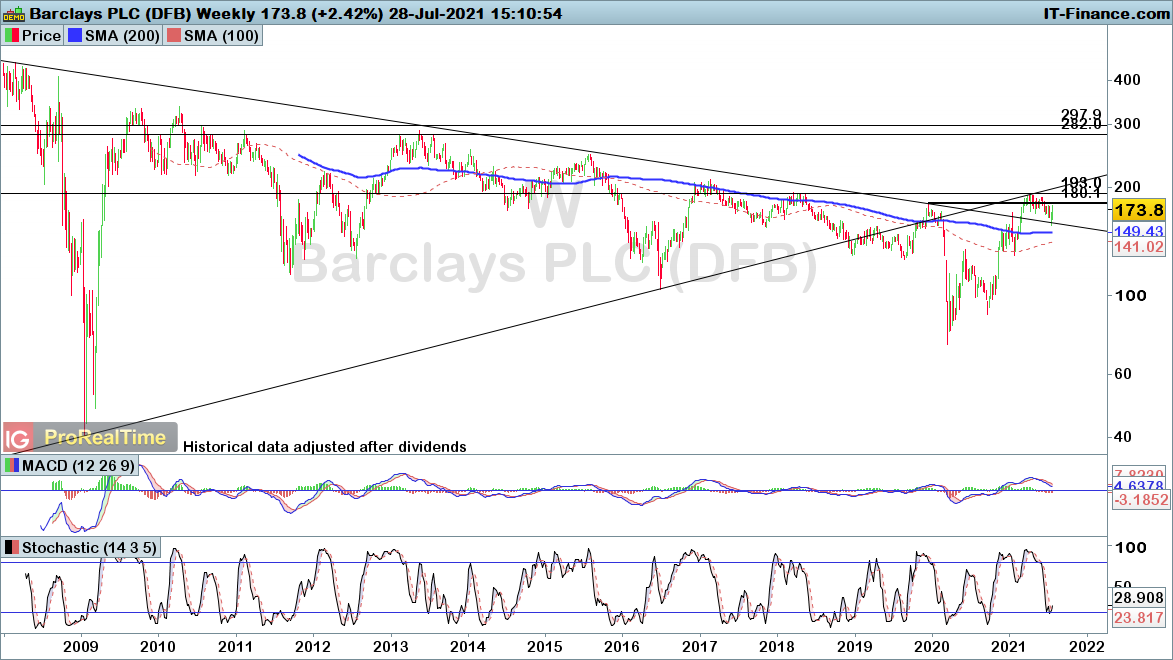
Bullish breakout could bring long-term reversal
The stock managed to break up through the £1.80 resistance level back in March, with the decline in treasury yields seeing the stock ease back since.
However, we have seen price find support on the descending trendline, with price now stuck between two long-term lines.
With the rally through £1.80 bringing an end to the long-term downtrend, there is a good chance that we are set for another leg higher from here.
The fact that the stochastic is turning upwards after a period of downside highlights how momentum appears to be shifting in favour of the bulls.
 Source: ProRealTime
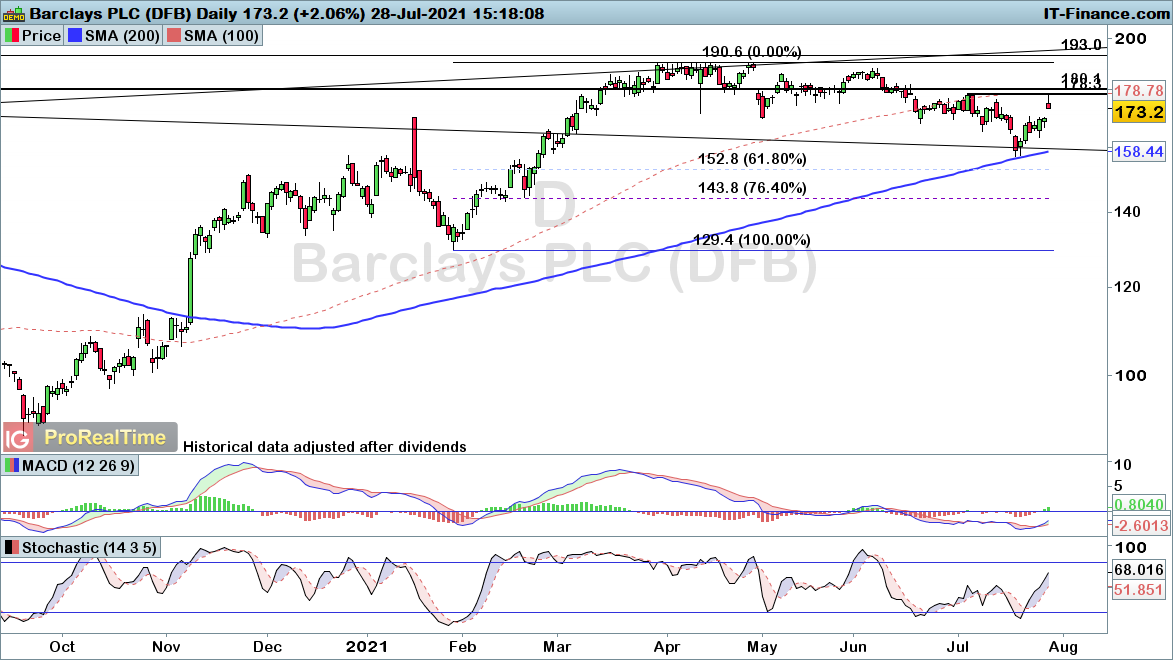
The daily chart highlights the uptrend in place over the past 16 months, with todays rally taking price back into that £1.80 region.
The declines seen over the course of the past three-months does still remain in play unless we see a rise through the July high of £1.78, yet the fact that the price appears to have topped out at that level does raise the likeliness that this recent pullback is over.
Further upside through that level would provide greater confidence of such a bullish surge, although ultimately any further downside would simply be deemed a buying opportunity unless the price breaks the £1.29 low established in January.
Find out more on how to buy, sell and short Barclays shares
 Source: ProRealTime
-
Hi @Marcraffard It is a good thing you did your research, it is one key tool for trading. With the research you have done, as a trader you will get a better understanding why the market is moving in a certain way, while at the same time you will be able to anticipate these moves when such announcements happen again in future.
All the best - MongiIG
-
1
-


IG & MT4
in IG Technical Support - Platform and App Help
Posted
Hi @Win, you are able to trade on IG online trading platform when you open your My IG dashboard. Please see below the trading platforms that we offer:
Kindly visit this link to view IG online trading platform features https://www.ig.com/uk/trading-platforms#features
All the best - MongiIG