

MongiIG
-
Posts
9,890 -
Joined
-
Last visited
-
Days Won
41
Content Type
Profiles
Forums
Blogs
Events
Community Tutorials
Store
Posts posted by MongiIG
-
-
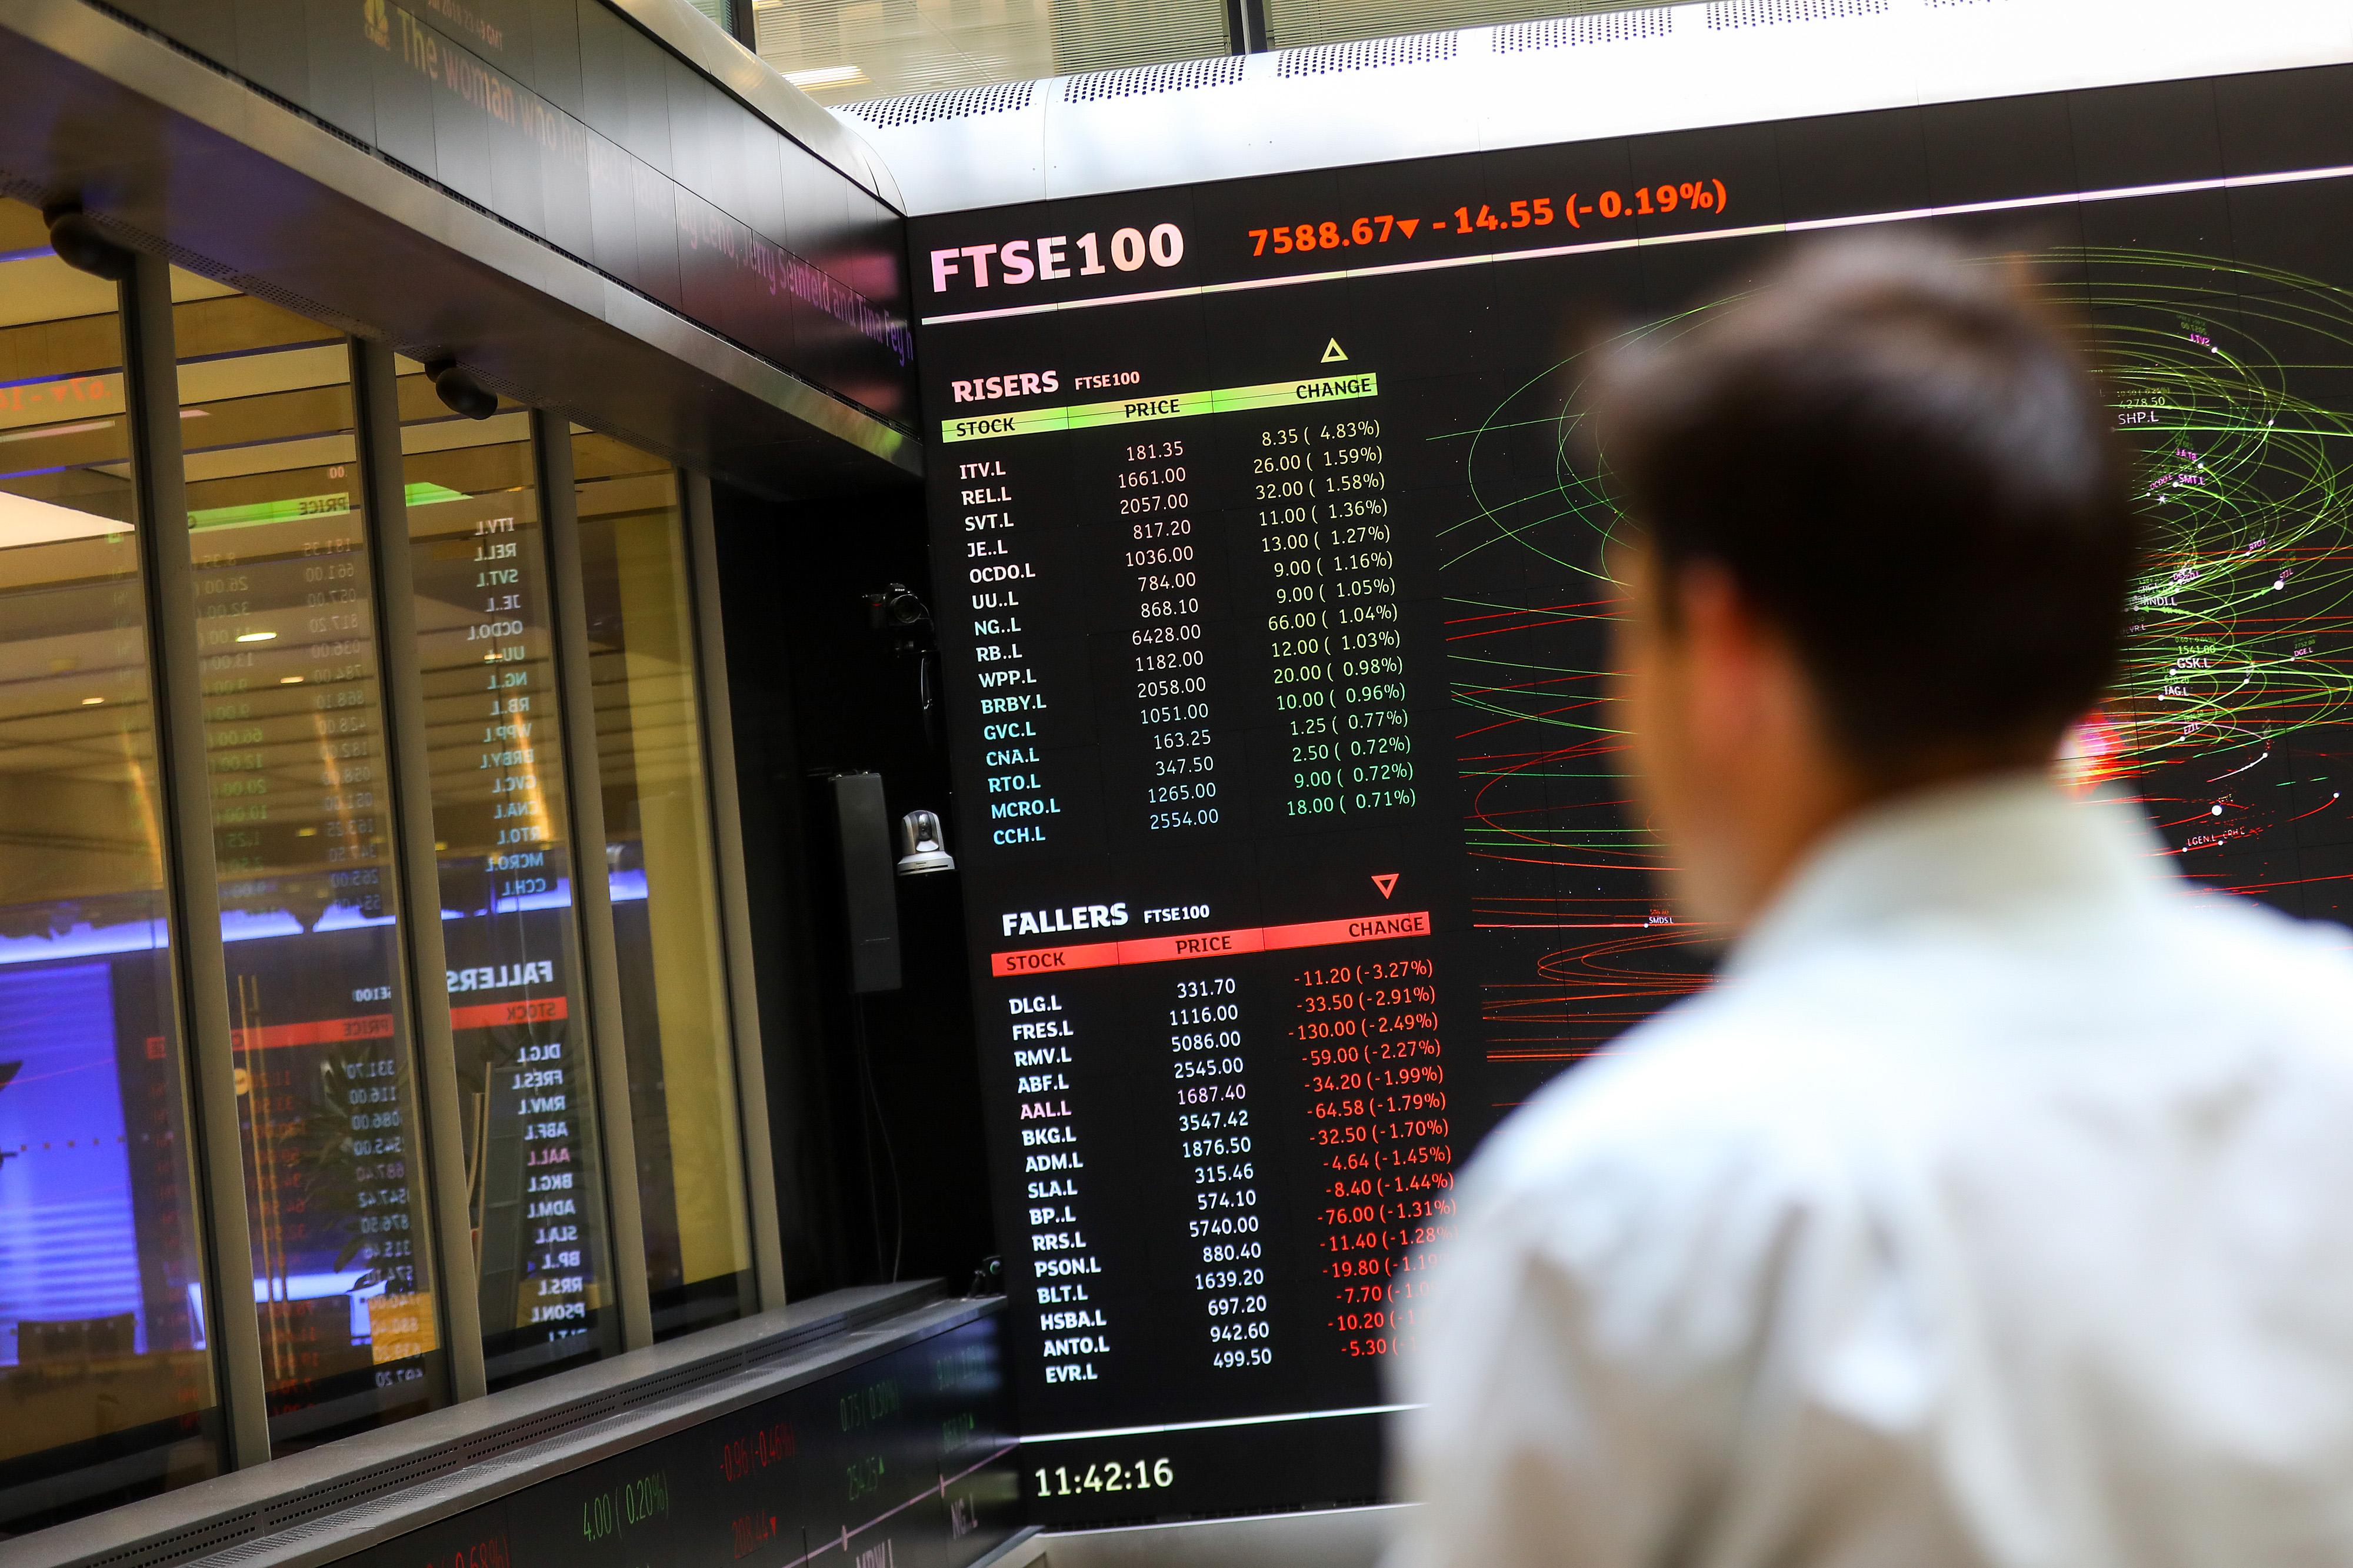
FTSE 100, DAX and Dow head back into key support
FTSE, DAX, and Dow head lower, but will this retracement represent a buying opportunity for stocks?
 Source: Bloomberg
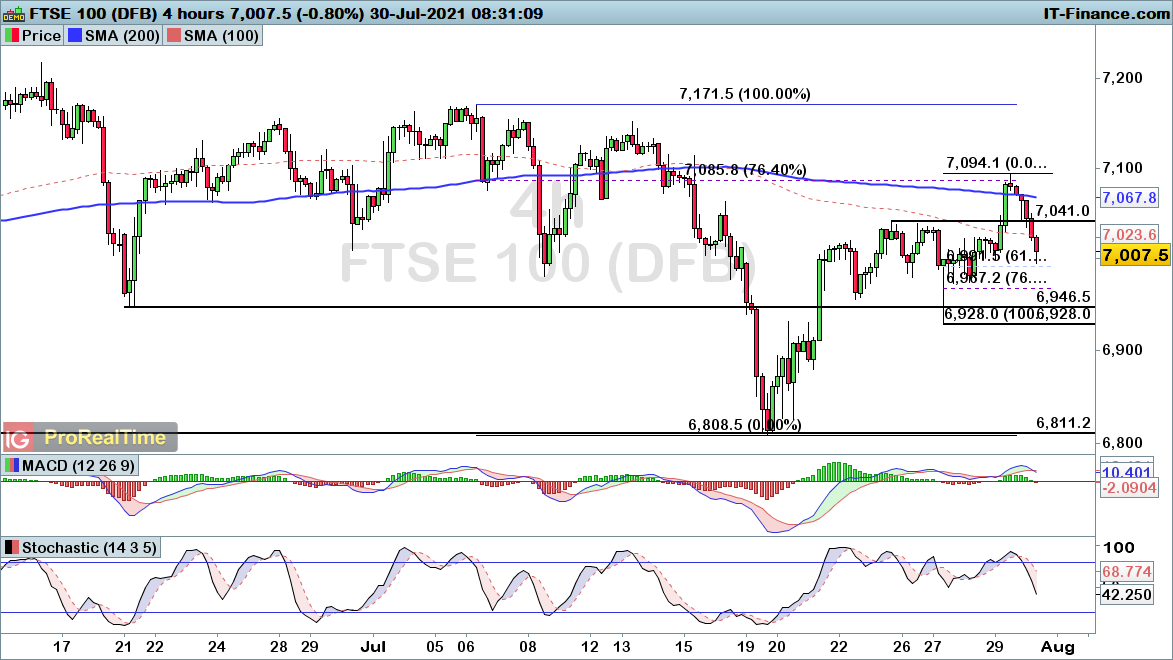
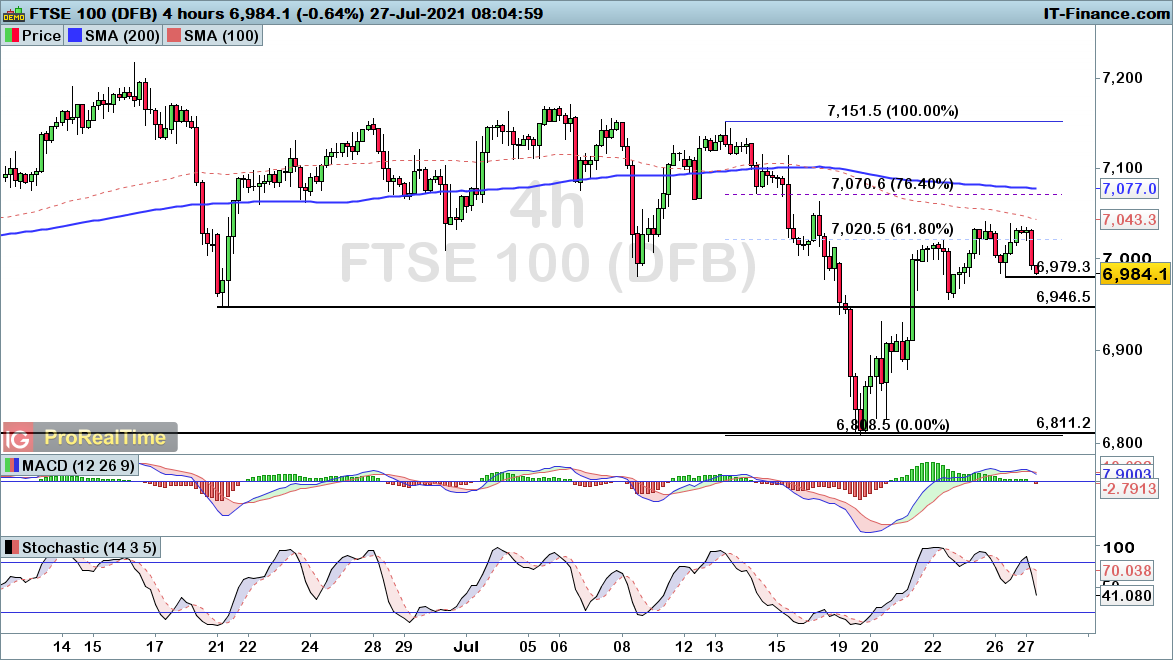
FTSE 100 turns lower from Fibonacci resistance
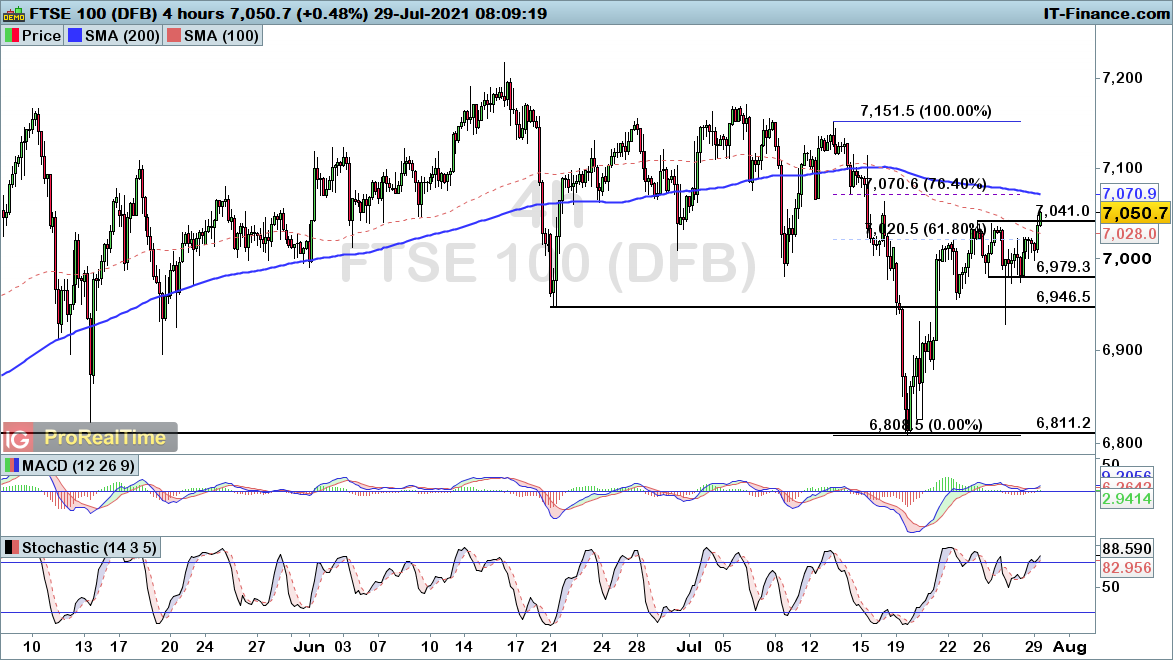
The FTSE 100 has been on the back foot in early trade, with the index falling back from the 76.4% Fibonacci resistance level of 7085. That decline may not necessarily mark the beginning of a wider bearish phase though, with a break below 6928 required to signal a more protracted downside move for the index.
Until then, it is worthwhile watching to see another potential higher low, with the near-term Fibonacci levels of 6991 (61.8%) and 6967 (76.4%) bringing key levels that could spark another upside move.
 Source: ProRealTime
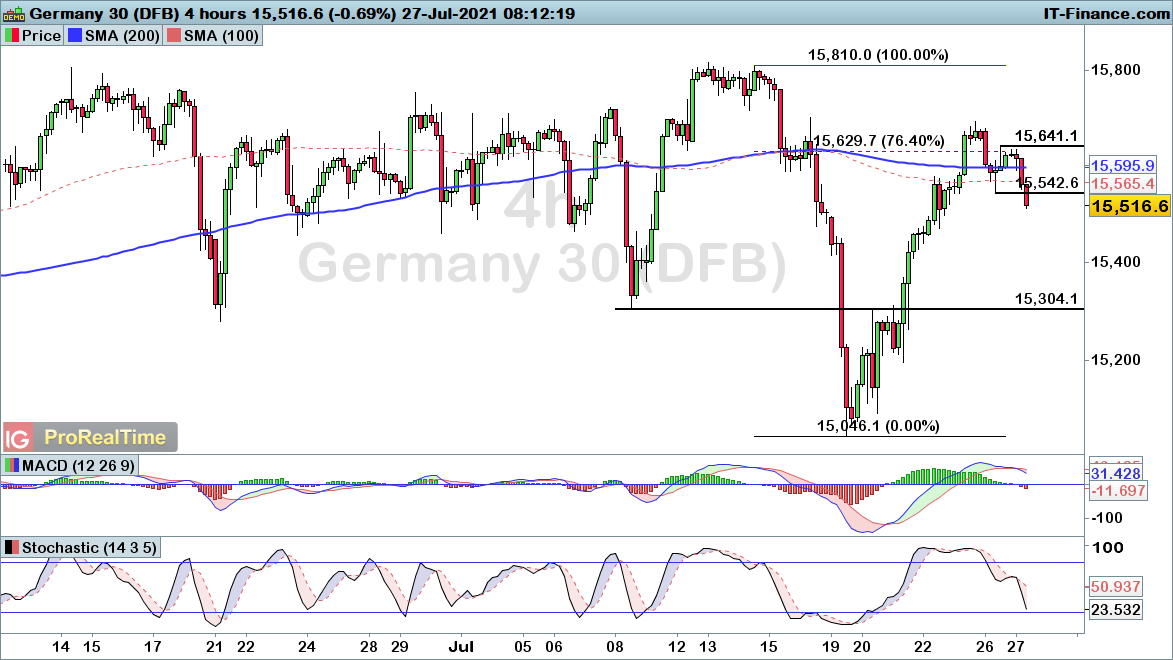
DAX declines provide warning sign for the FTSE
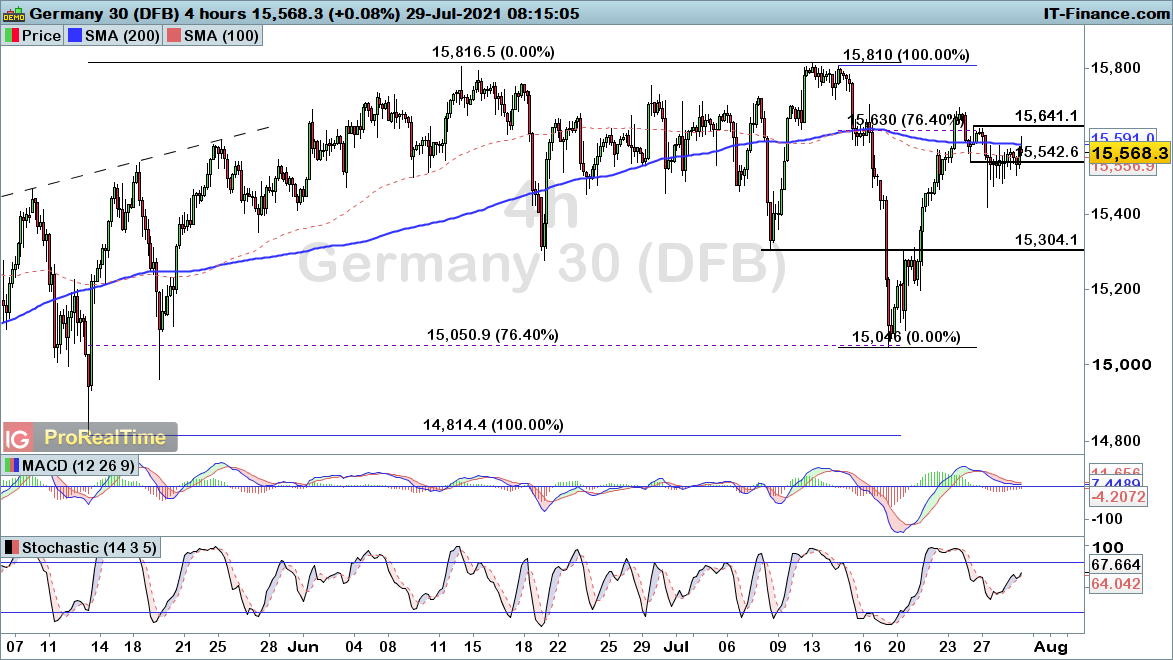
The DAX has similarly sold off from the 76.4% Fibonacci resistance level of 15630, with the index falling towards the key 15420 level. A drop below that level would bring a potential bearish picture into play for the day ahead, highlighting the possibility of a more protracted move lower in Europe.
As such, watch out for whether price breaks the 15420 level as a gauge of sentiment for the day ahead, with such a break bringing about a bearish double top formation.
 Source: ProRealTime
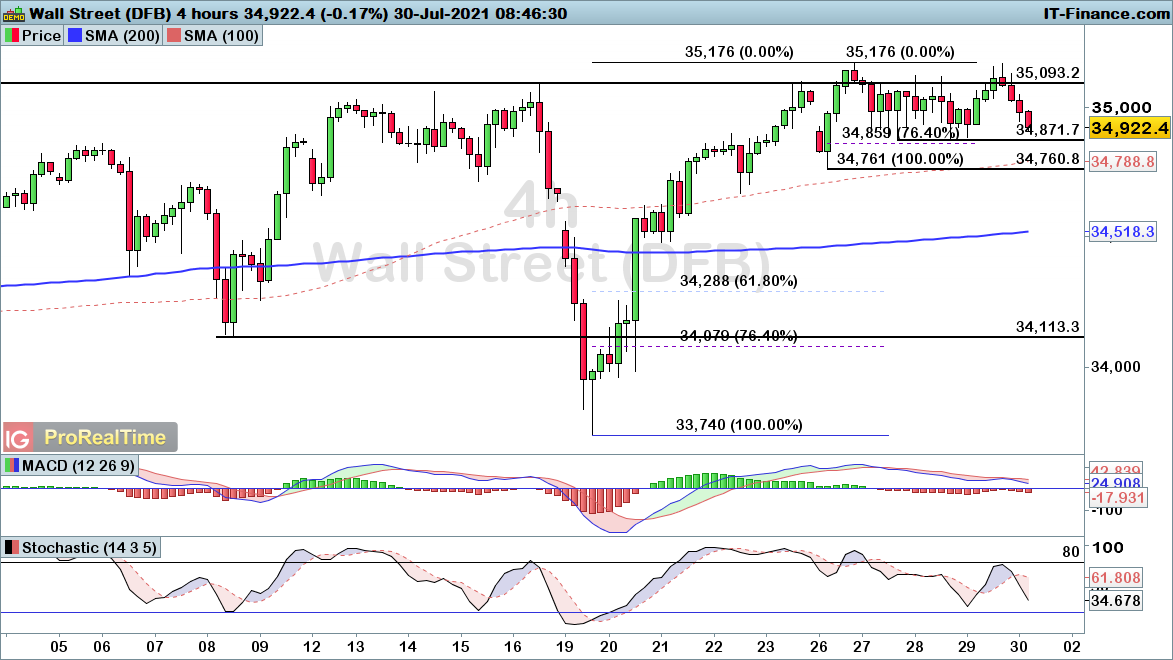
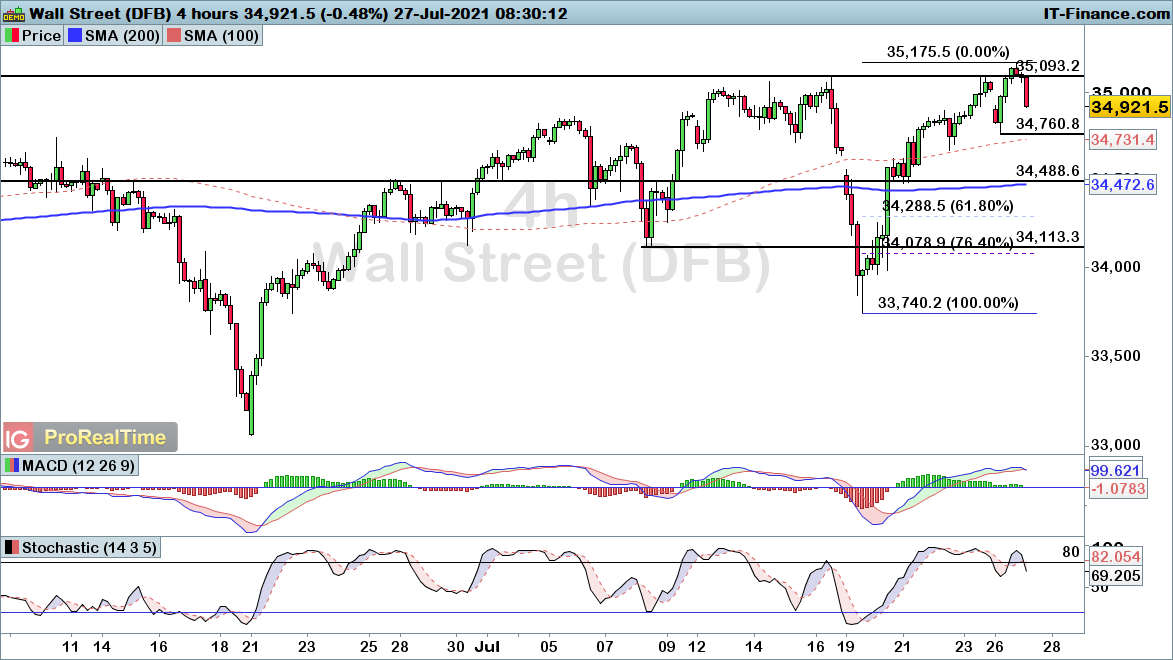
Dow Jones falls back towards key support
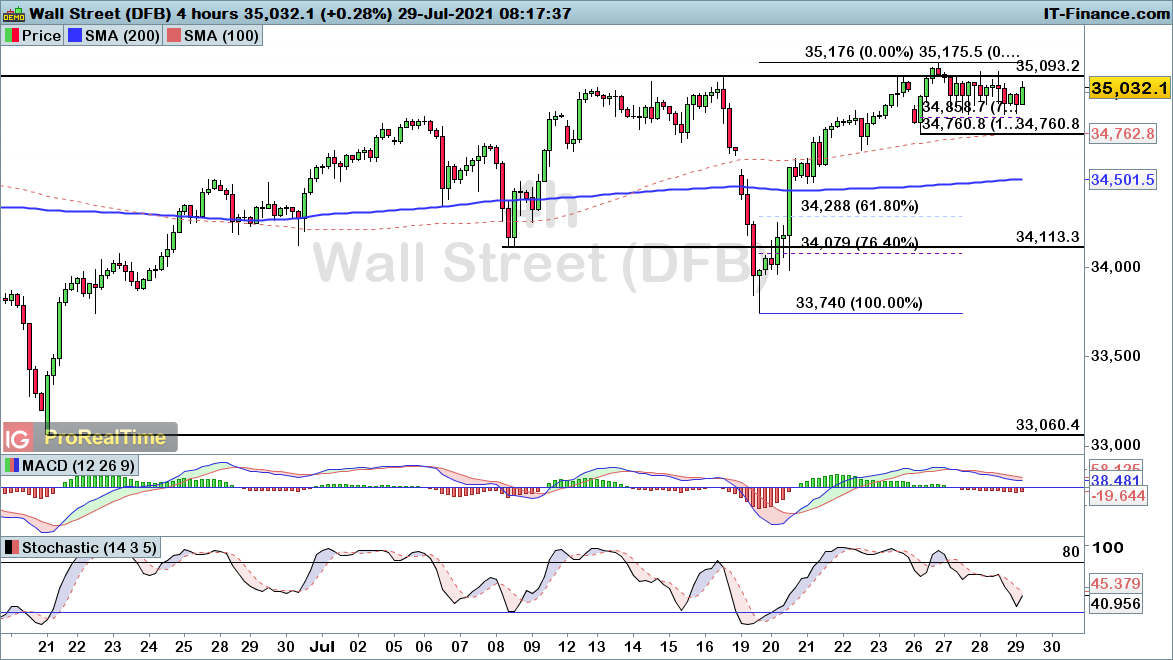
The Dow has similarly been on the back foot this morning, with the index falling back towards the 34859 level respected over the course of past three days.
With that in mind, watch out for price to potentially find support around the 34859 and 76.4% Fibonacci support zone for the bulls to potentially come back into play. A decline through 34761 would be required to bring a wider bearish picture into play.
 Source: ProRealTime
-
Barclays have proven just why they should retain their investment banking arm, with a jump in profits pointing towards a likely bullish drive from here.
 Source: Bloomberg
Barclays earnings provide bullish impetus
Barclays has given its shareholders plenty to celebrate today, with the bank posting an impressive £5 billion profit for the first half (H1) of 2021.
That ability to almost quadruple their profits for H1 provided a fresh bout of buybacks and dividends to reward investors banking on a pro-cyclical boost for the sector.
Part of the boost came from the ability to claw back provisions that had been made in anticipation of bad debts, with Covid-19 sparking a wave of defaults.
However, the government’s supportive measures managed to stave off much of those effects, with banks reclaiming those funds set aside in preparation of such losses. Meanwhile, the bank saw positive signs that consumer demand was starting to grow once again.
Nonetheless, much of the profits seen at Barclays came thanks to their investment banking division, drawing a line between the bank and its UK peers. The US banks have historically outperformed UK banks thanks in part to their more volatile trading divisions.
However, while shareholders had been pushing Barclays to shift away from their investment banking exposure, Jes Staley’s decision to fight off those moves have been justified today.
Instead, we could now see investors specifically look towards Barclays as a potential outperformer thanks to that greater risk profile.
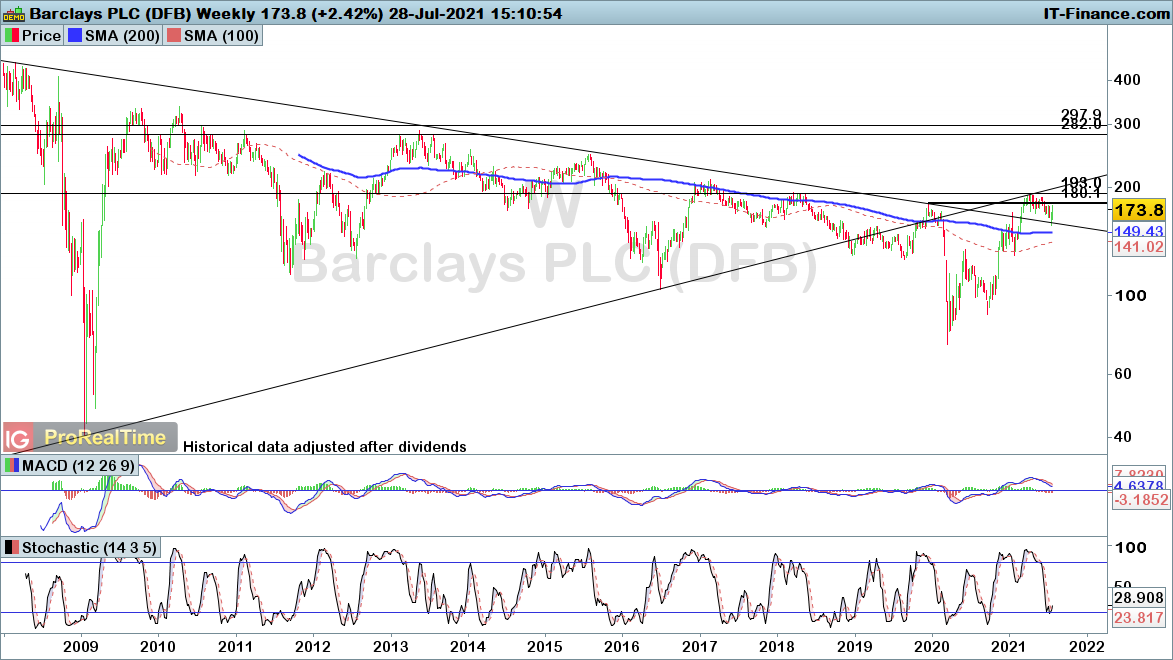
Bullish breakout could bring long-term reversal
The stock managed to break up through the £1.80 resistance level back in March, with the decline in treasury yields seeing the stock ease back since.
However, we have seen price find support on the descending trendline, with price now stuck between two long-term lines.
With the rally through £1.80 bringing an end to the long-term downtrend, there is a good chance that we are set for another leg higher from here.
The fact that the stochastic is turning upwards after a period of downside highlights how momentum appears to be shifting in favour of the bulls.
 Source: ProRealTime
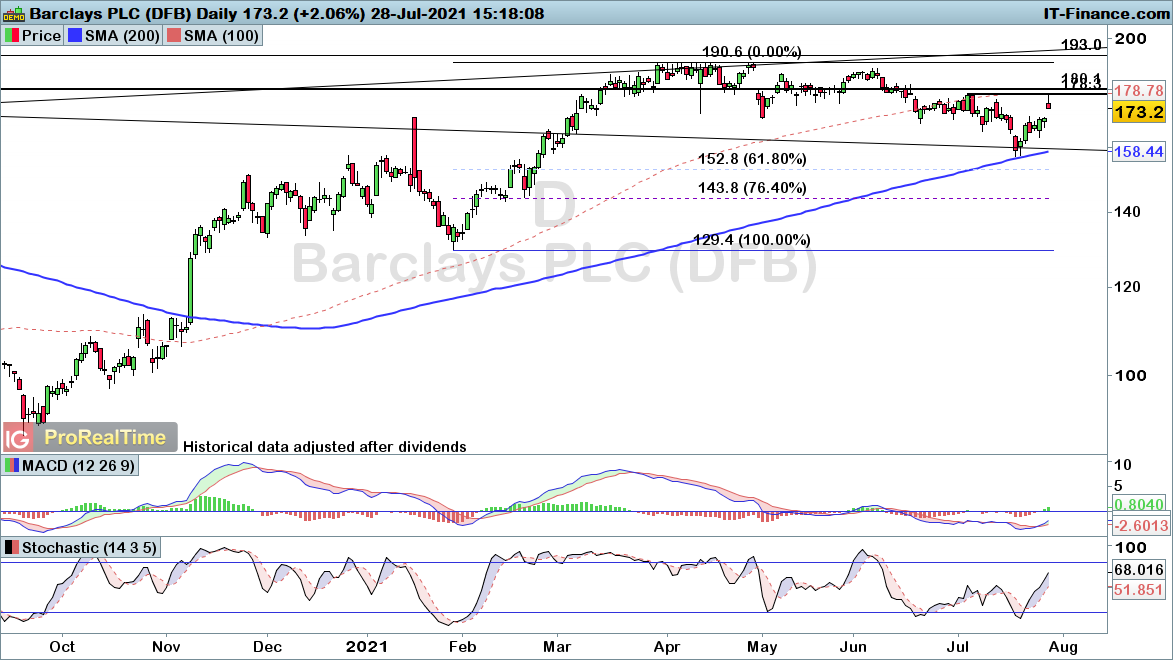
The daily chart highlights the uptrend in place over the past 16 months, with todays rally taking price back into that £1.80 region.
The declines seen over the course of the past three-months does still remain in play unless we see a rise through the July high of £1.78, yet the fact that the price appears to have topped out at that level does raise the likeliness that this recent pullback is over.
Further upside through that level would provide greater confidence of such a bullish surge, although ultimately any further downside would simply be deemed a buying opportunity unless the price breaks the £1.29 low established in January.
Find out more on how to buy, sell and short Barclays shares
 Source: ProRealTime
-
Hi @Marcraffard It is a good thing you did your research, it is one key tool for trading. With the research you have done, as a trader you will get a better understanding why the market is moving in a certain way, while at the same time you will be able to anticipate these moves when such announcements happen again in future.
All the best - MongiIG
-
 1
1
-
-
Gold and Brent crude head higher as dollar weakens
Gold and Brent crude manage to push through resistance, as the dollar weakens in the wake of yesterday’s FOMC meeting.
 Source: Bloomberg
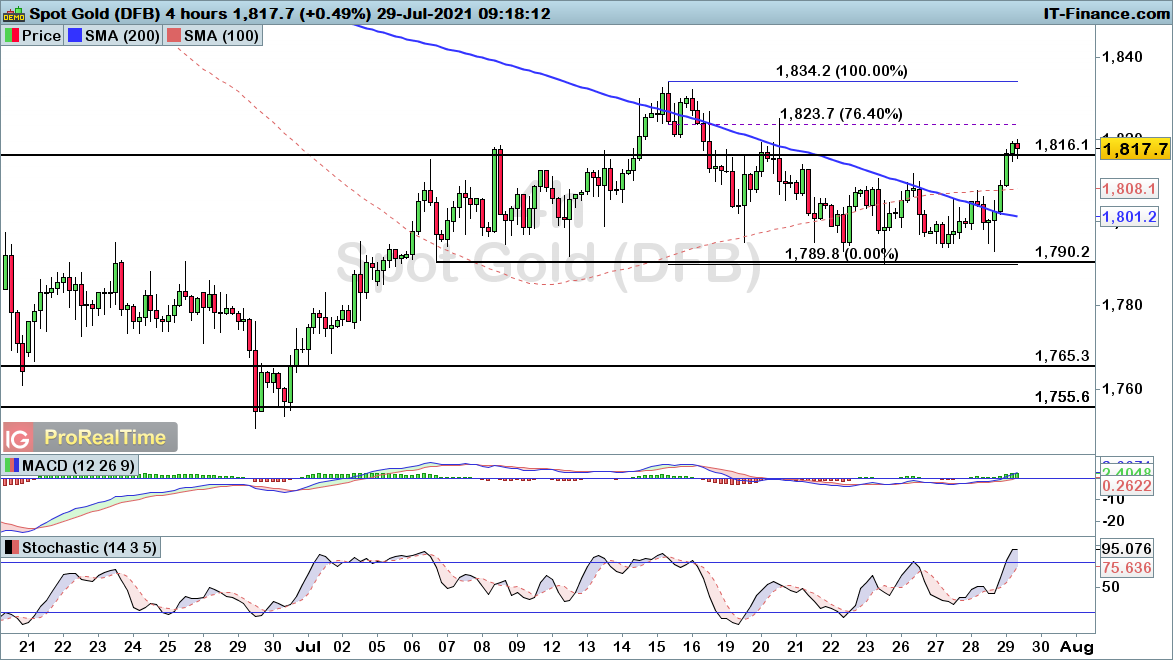
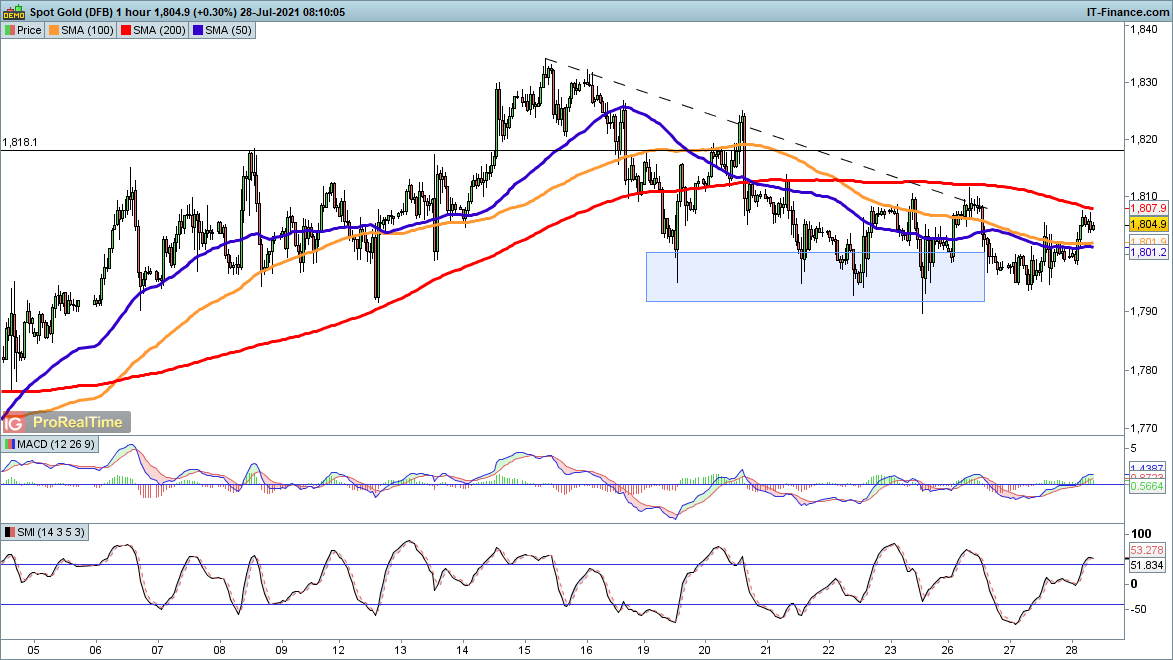
Gold drives higher from key support
Gold has managed to push sharply higher from the $1790 support level overnight, with the Federal Open Committee Meeting (FOMC) bringing a decline for the US dollar.
That helps to alleviate the pressure on gold for now, with price seemingly heading back into the recent uptrend seen throughout early July. Near-term resistance comes in the form of $1823, yet there is a risk that we post a retracement before long given the sharp moves seen overnight.
In either case, the uptrend does remain intact, with a break back below $1790 required to negate that recent bullish pattern.
 Source: ProRealTime
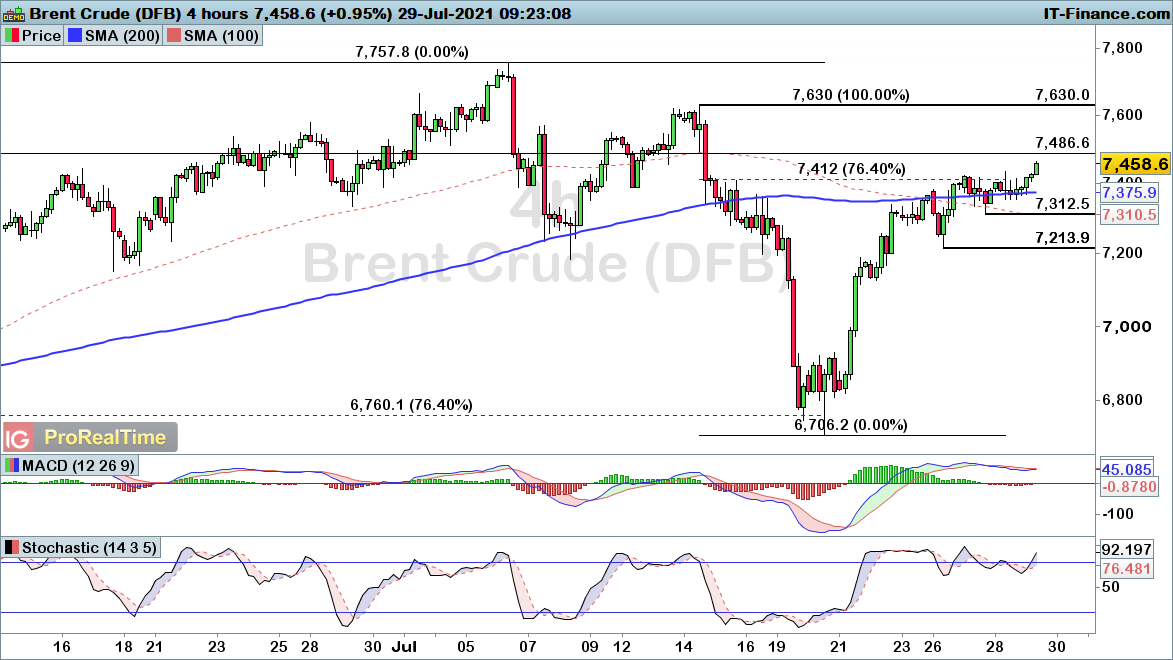
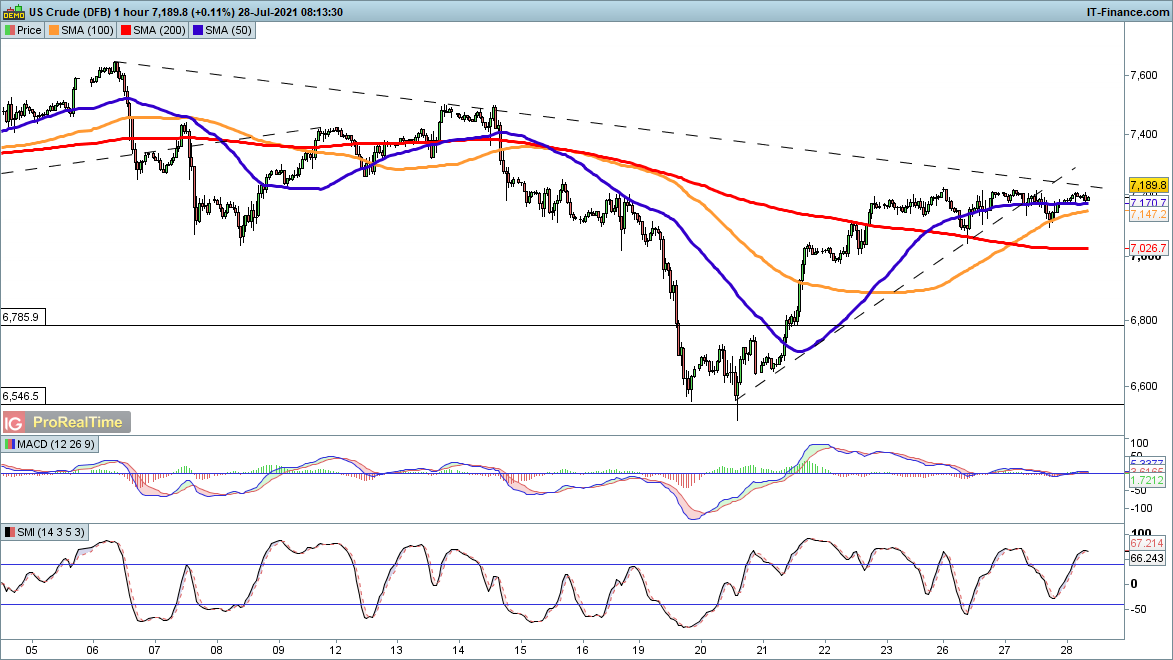
Brent crude pushing through resistance as it builds on recovery
Brent crude has pushed up through the 76.4% Fibonacci resistance level of $74.12, helping to alleviate fears of a bearish reversal. The recent declines seen around the OPEC+ talks are behind us, and we look likely to continue the long-term uptrend from here.
As such, while a move through $76.30 would be required to fully eradicate this recent selloff, it makes sense to favour bullish positions unless price falls through the prior swing-low (currently $73.12).
 Source: ProRealTime
-
Dollar weakness drives EUR/USD and GBP/USD gains, while USD/CAD breaks lower
FOMC-fuelled dollar weakness sparks EUR/USD and GBP/USD gains, while USD/CAD breaks through Fibonacci support.
 Source: Bloomberg
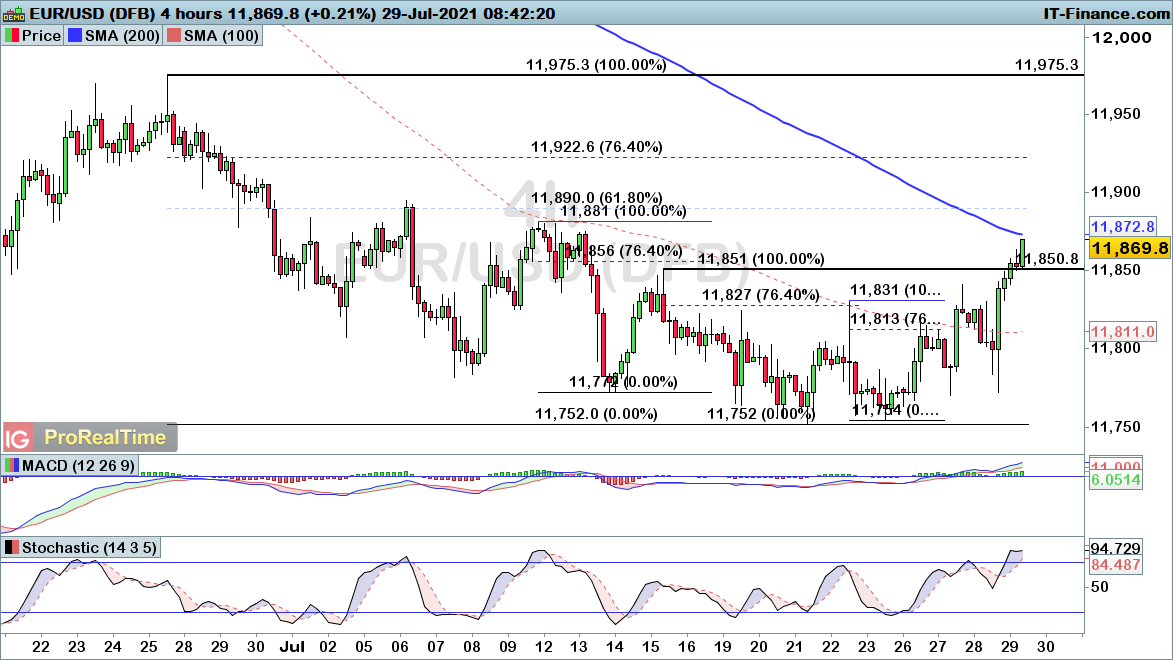
EUR/USD drives higher after recent upside break
EUR/USD has built on the rise through $1.1831, with the pair driving into a fresh two-week high. The gradual nature of the recent downtrend did point to such a move likely coming into play before long, and we are now looking for clues as to where this rise will push into.
The wider Fibonacci retracement from $1.1975 is of particular interest, with $1.189 and $1.1922 representing the two notable deep Fib levels worth considering from the bears to come back into play once again. Until then, further short-term upside looks likely from here.
 Source: ProRealTime
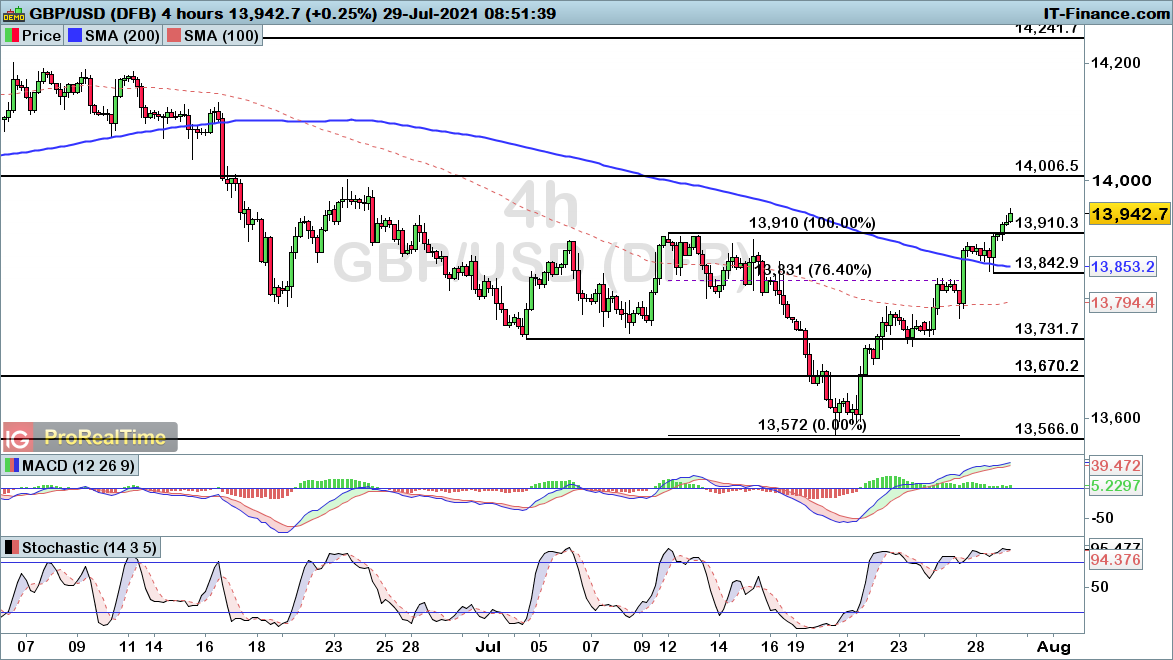
GBP/USD breaks key resistance to end recent bearish threat
GBP/USD has managed to push up through the $1.391 resistance level overnight, with the pair negating the downtrend in play over the course of June and July.
With a more bullish outlook now confirmed, it makes sense to simply follow the intraday trend of higher lows, with a bullish outlook in play until the price breaks back below $1.3843.
 Source: ProRealTime
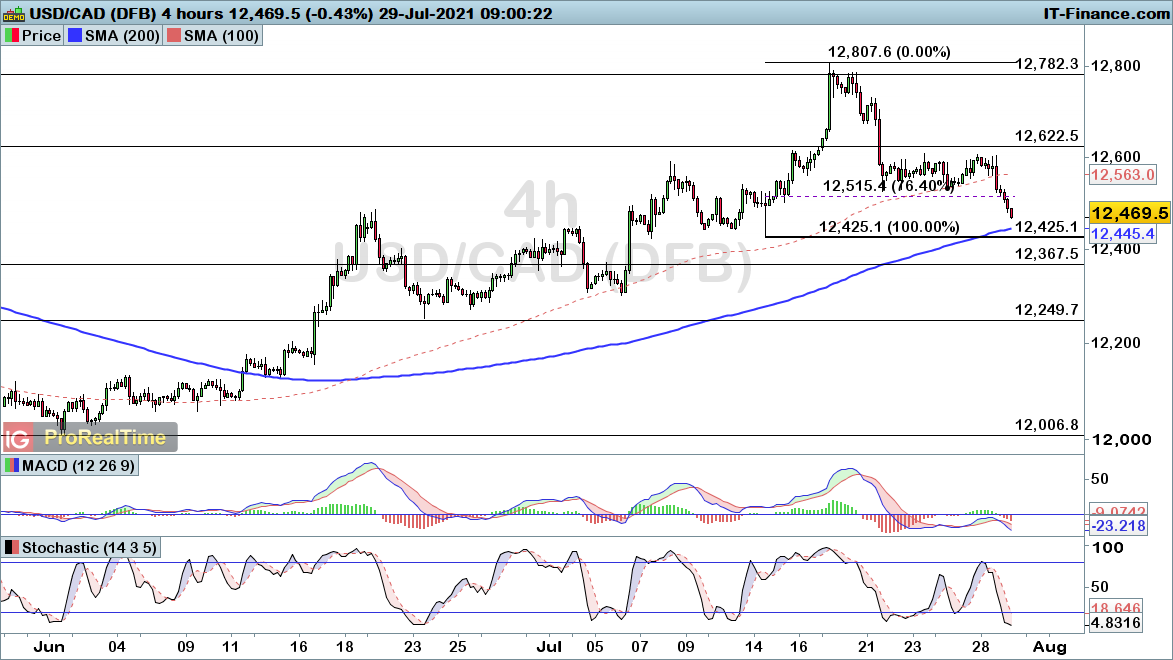
USD/CAD breaks Fibonacci support after recent consolidation
USD/CAD has finally broken from its consolidation phase, with the pair falling into a two-week low this morning.
Crucially, that brings us back below the 76.4% Fibonacci support level as we close in on the key swing low of $1.2425. A break back below that level would confirm the end of the uptrend that has dominated the past two months. As such, watch out for further downside from here, with a break below $1.2425 in particular providing greater confidence in that bearish outlook.
 Source: ProRealTime
-
FTSE 100, DAX and Dow consolidation expected to bring fresh push higher
FTSE, DAX, and Dow consolidation likely to ultimately resolve in another push towards the upside.
 Source: Bloomberg
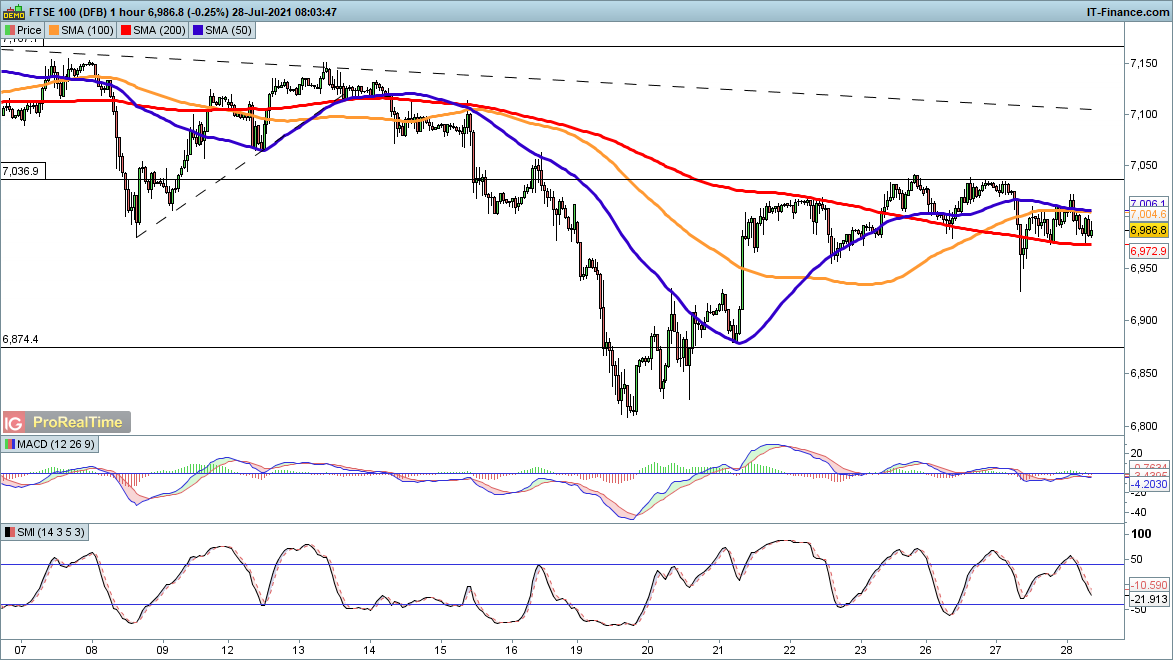
FTSE 100 rallies back into Friday’s high
The FTSE 100 has managed to push back into the recent high of 7041, with the index largely warding off selling pressure evident on Tuesday.
The ongoing recovery phase points towards a potential move into the 7070 resistance level given the current break through 7041.
From a wider perspective, we would want to see a rise above 7151 to entirely negate the declines seen in mid-July and confirm the uptrend once again.
 Source: ProRealTime
DAX pausing after recent recovery move
The DAX has been attempting to regain ground over the past 10-days, with price on the rise after a wider 76.4% Fibonacci retracement.
While Tuesday saw a break back below 15542 support, the lack of follow-through highlights how we are likely to head higher before long.
Watch for a push through the 15641 level to build a more bullish picture once again, with the index likely to grind lower until that upside break occurs.
 Source: ProRealTime
Dow Jones likely to push into fresh highs before long
The Dow has seen a brief move into the 76.4% Fibonacci support level at 34858 this week, with the downside moves proving somewhat limited in nature.
A break back below 34761 would signal a potential wider retracement coming into play. Until then, another move higher looks likely from here as we build on the bullish trend.
 Source: ProRealTime
-
For more up to date news on how markets will open, the latest earnings and economic news, watch IGTV live in the platform at 07:30am UK.

Today’s coverage:
China’s Hang Seng tech index rebounds sharply on reports China is responding to investor concerns over regulatory outlook.
UK earnings: Lloyds Q2 pretax profit tops estimates, announces acquisition of EmbarkShell to resume share buybacks targeting $2bn by year-end
BT Q1 earnings top estimates, AZN, Diageo also report
US earnings: Facebook warns on growth outlook, shares lower, PayPal disappoints, Amazon ATB
Europe earnings: VW raises FY outlook
Credit Suisse Q2 net income falls short of estimates
Fed last night, rates unchanged, considers tapering bond purchases , US quarterly GDP later today
Brent crude closing in on $75 as EIA inventories fall short of estimates.
-
Hi @ChocoIG, thanks for your question. Please reach out to our client facing team as we can't assist with these queries on the community, the client facing team will be able to check with the desk and see why your orders are not valid and give you feedback, but we do apologise for the inconvenience. You can reach them on helpdesk.uk@ig.com
All the best - MongiIG
-
Hi @bkhan, please reach out to our client facing team as we can't assist with these queries but we do apologise for the inconvenience. You can reach them on helpdesk.uk@ig.comAll the best - MongiIG
-
Hi @Marcraffard, thanks for sharing the link on why Tesla stock fell after the earnings. Great article to read.
Regards
MongiIG
-
1
-
-
The Federal Reserve keep markets guessing around taper talk, with the rise in Delta cases expected to result in a more cautious approach.
 Source: Bloomberg
The Federal open market committee (FOMC) return to the fold this week, with investors keenly looking out for clues from a meeting that is likely to be more talk than action. That two-day meeting concludes on Wednesday 27 July.
Inflation fears remain
Recent months have seen a significant degree of uncertainty after the Federal Reserve (Fed) took a notable shift in tone away from their explicitly dovish and supportive stance seen since the beginning of the Covid-19 pandemic.
Instead, the recent rise in inflation has brought a more cautious approach, with the committee clearly losing confidence that this recent rise in prices will be transitory.
The chart below highlights how those inflationary pressures remain highly present, with both headline and core consumer price index (CPI) pushing through the 5% threshold. Notably, that takes core inflation to the highest level in 20-years.
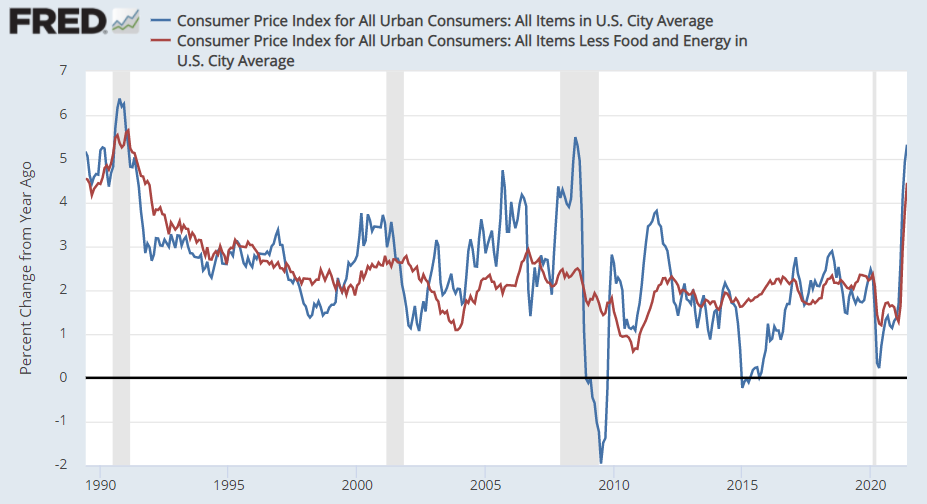 Source: Federal Reserve
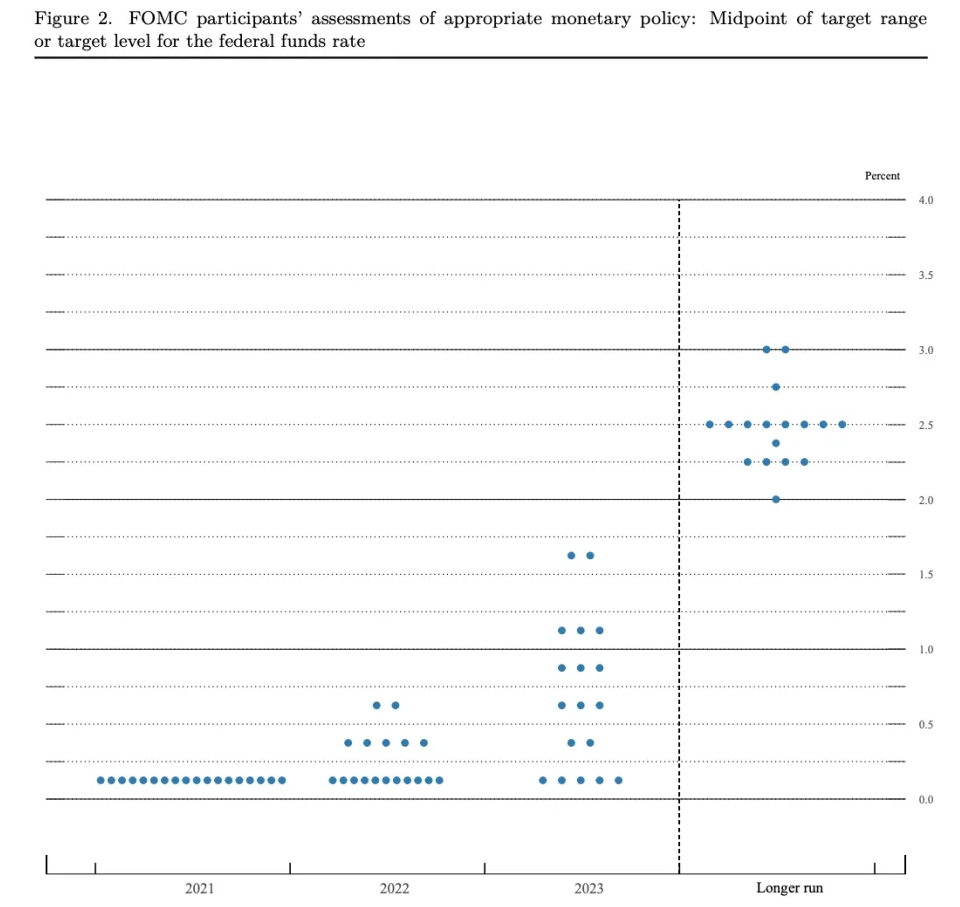
Last month’s dot plot highlights how that rise in inflation has pushed outlook at the Fed, with a majority of members seeing rates rising in 2023.
Meanwhile, we have also seen a total of seven members that foresee higher rates as early as next year.
 Source: Federal Reserve
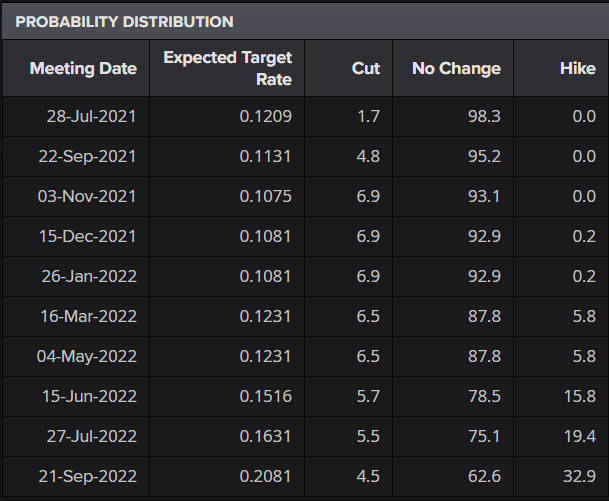
Expectations of a 2022 rate rise are evident when looking at the market pricing of the first hike. Any rate rise at Wednesday’s meeting looks highly unlikely given the 0% currently priced in. However, the longer-term outlook sees expectations rise towards the end of 2022.
 Source: Eikon
Delta variant could result in cautious approach
Despite the ongoing pressure brought about by soaring inflation, the rise of the Delta variant does provide the basis for a more cautious Fed this time around.
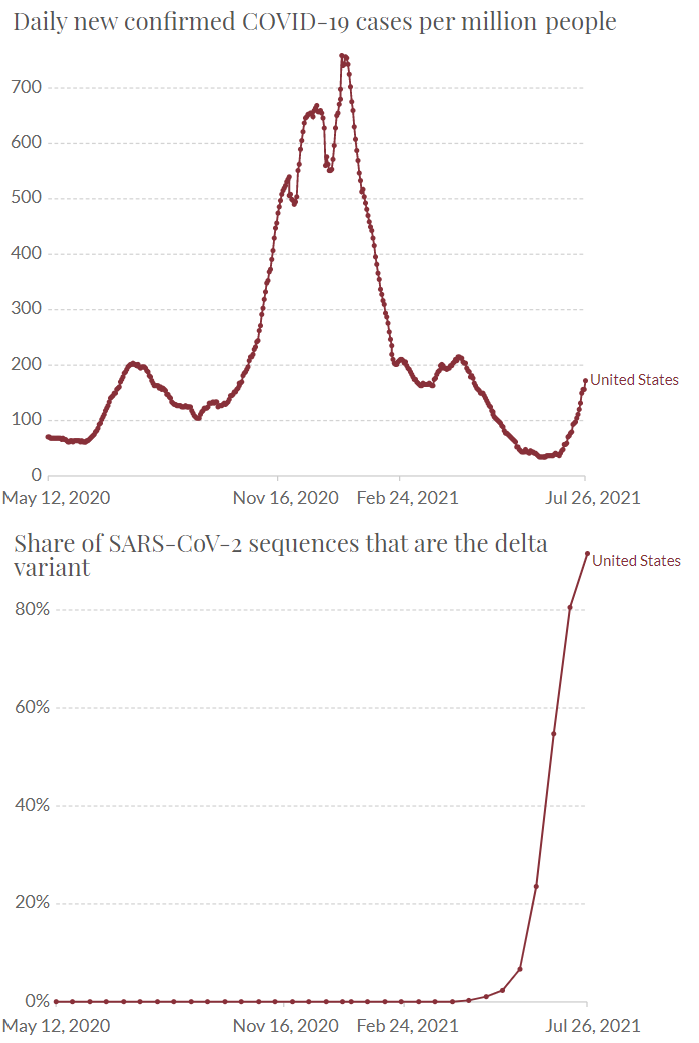
Despite 48% of the US enjoying full vaccination status, those efforts have been undermined by rise of the more contagious Delta strain which now accounts for 91% of US cases. The surge in Delta dominance has been simultaneous with a rise in cases, with new cases rising to the highest level since April 2021.
 Source: Ourworldindata
Tapering the key topic for traders
With a rate rise unlikely this year, traders will instead focus on tapering given the fact that the Fed will look to address their asset purchases scheme first. The ongoing quantitative easing policy helps to drive equity prices upward and a weaker dollar. With that in mind, any move to withdraw this stimulus would likely drive markets lower.
From an FX perspective, the dollar trajectory is less clear as the strength that could come from tighter policy can be counteracted by haven demand as equity prices head lower. While we are unlikely to see tapering commence yet, we are likely to see volatility if the Fed provides forward guidance on when tapering will start.
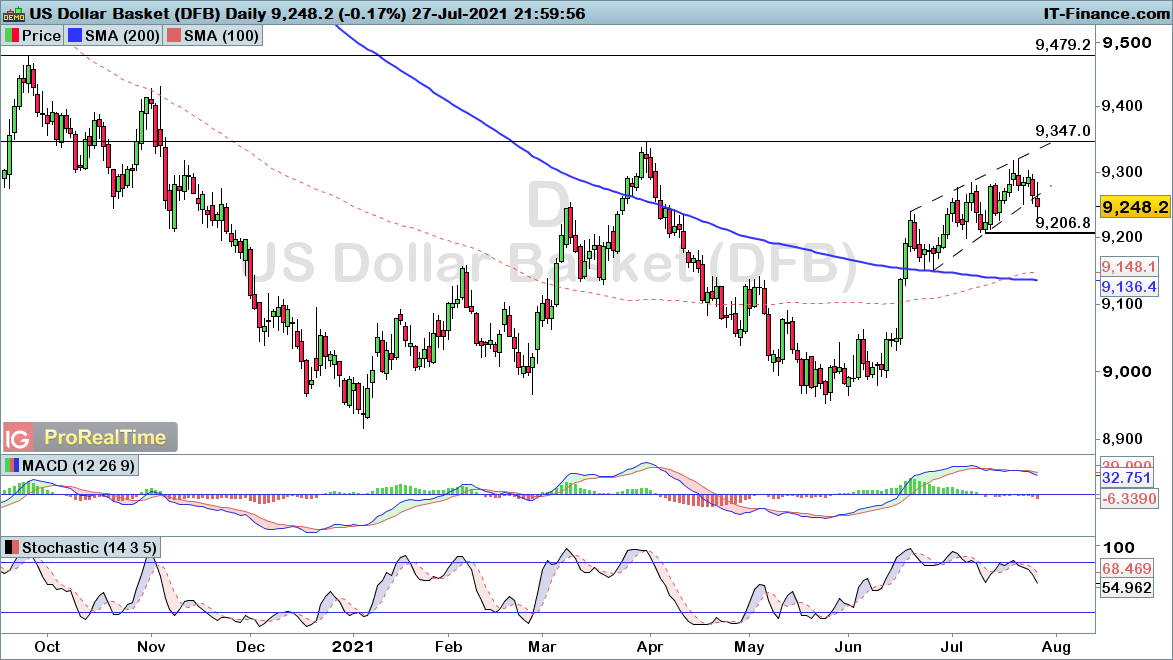
Dollar index technical analysis
The dollar has started to head lower as we move into this week’s meeting, with price falling back below the ascending trendline that supported price over the past month. The recent rally is yet to take us up through the prior high of $93.47, with the long-term downtrend yet to be debunked.
Until then, there is a risk of a move lower, with a decline through the $92.07 swing low bringing a more bearish outlook. Until that level breaks, there is a risk we could see the uptrend of the past two-months come back into play.
 Source: ProRealTime
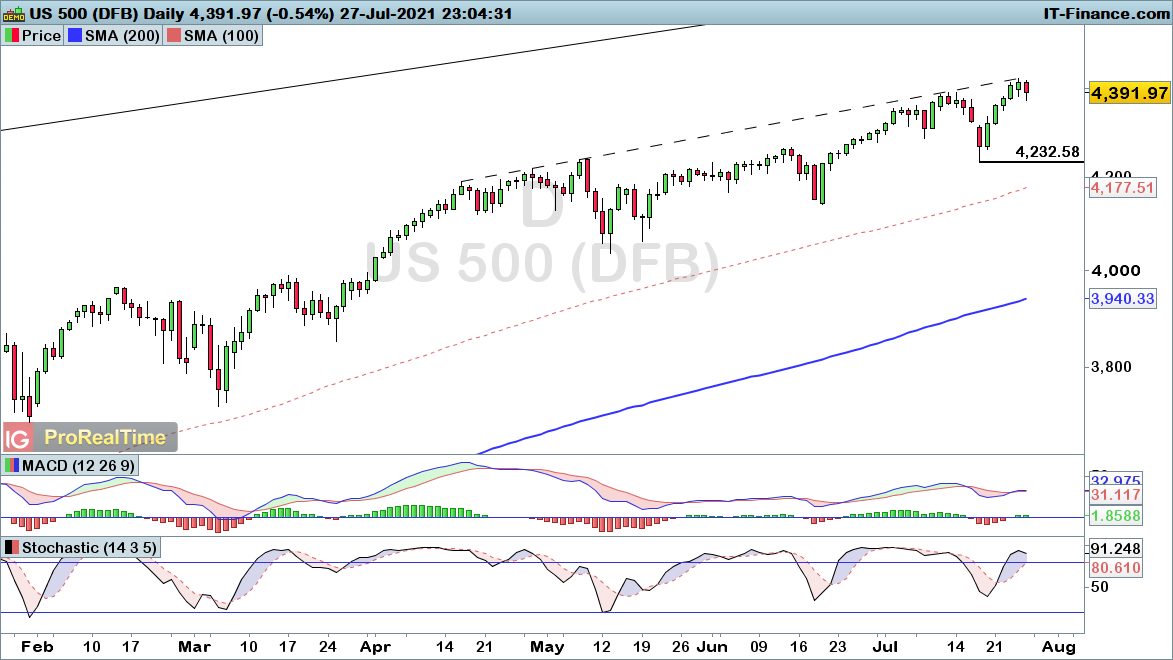
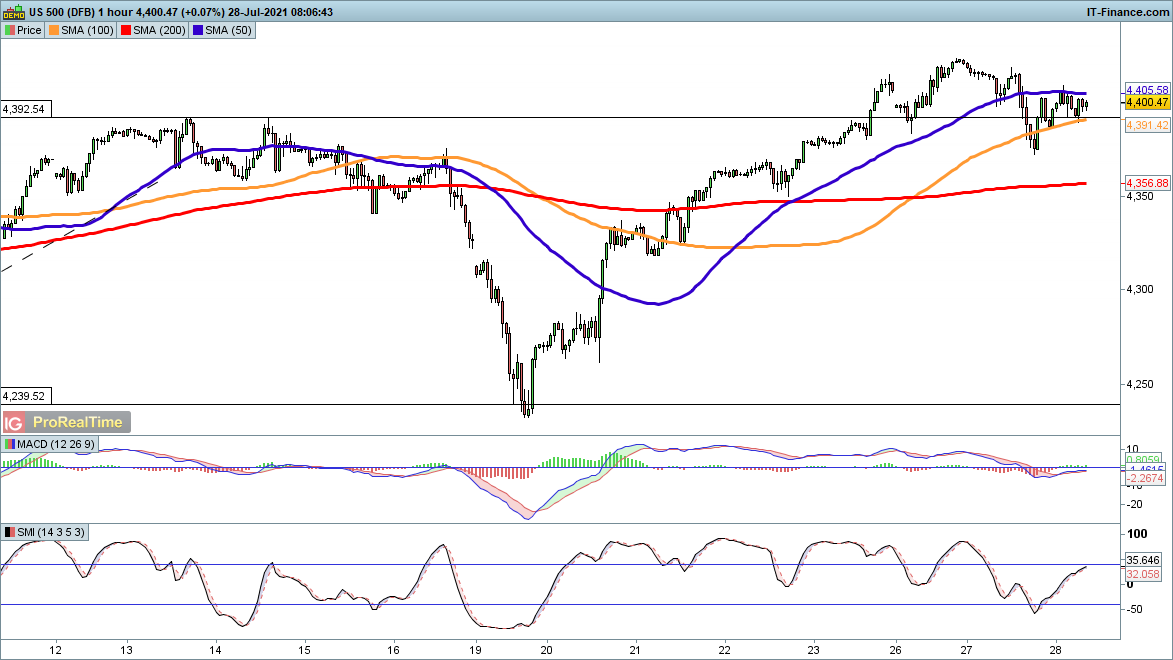
S&P 500 technical analysis
The S&P 500 is also weakening as we head into the meeting, with prices easing back from Monday’s record high. Should the Fed decide to bring a more hawkish stance, we could see this pullback extend. However, such a move would likely represent a retracement of the rally from 4232.
As such, even if we do see a somewhat unlikely roadmap for tapering laid out, it would likely present another opportunity to buy the dip. Meanwhile, a more patient approach would raise the likeliness of a swift move back towards previous highs
 Source: ProRealTime
-
EUR/USD and GBP/USD on the rise as AUD/USD lags behind
EUR/USD and GBP/USD show potential for a bullish resurgence, while AUD/USD lags behind.
 Source: Bloomberg
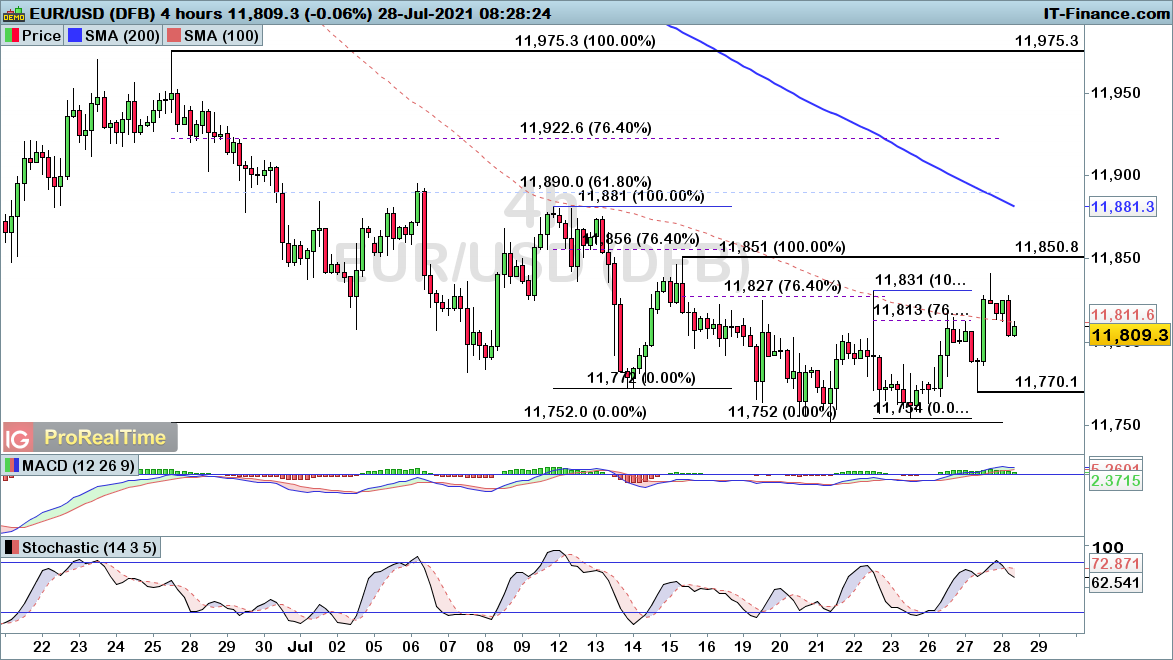
EUR/USD shows first signs of bullish phase
EUR/USD managed to rise through the $1.1831 resistance level yesterday, with the pair showing the first signs of a bullish phase after two months of downside. The very gradual nature of this sell-off has highlighted the potential for a breakout before long, yet we needed to see a push through resistance for that to come into play.
While $1.1831 is a notable level, a rise through $1.1851 would bring greater confidence that a bullish phase is coming into play. Nonetheless, with the intraday trend showing higher highs and higher lows, it makes sense to look at this with a more bullish view unless the price falls back below $1.177.
 Source: ProRealTime
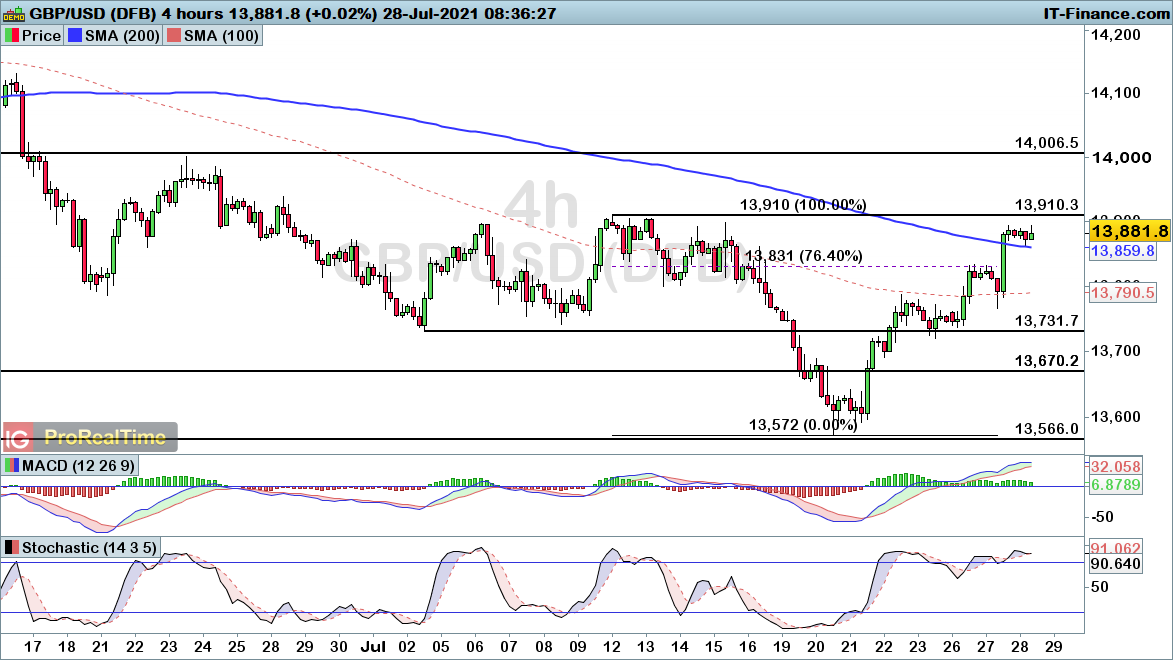
GBP/USD closes in on key resistance
GBP/USD has been on the rise over the course of the past week, with the pair pushing up through the 76.4% Fibonacci resistance level yesterday.
With pricing closing in on the key $1.391 swing high, a break through that level would bring a bullish reversal signal after two months of downside. As such, the ability to break up through $1.391 will be critical in determining sentiment as we move forward.
 Source: ProRealTime
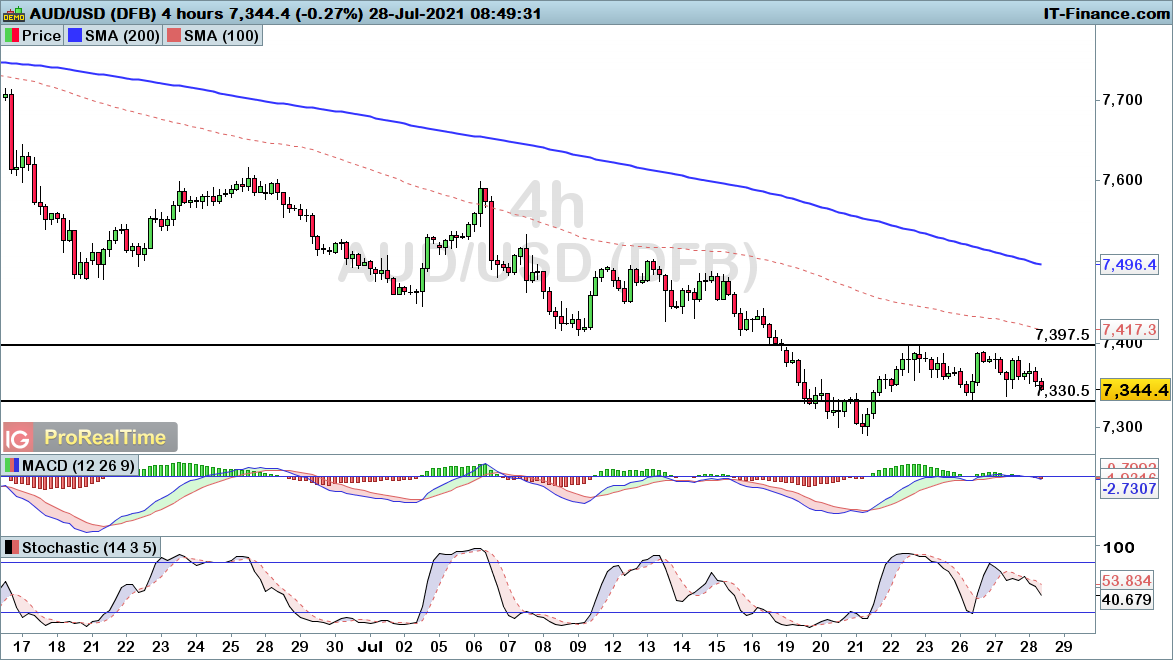
AUD/USD lags behind as it falls towards double top support
AUD/USD has failed to replicate the gains seen elsewhere, with the dollar dominating this pair once again this morning. A break through the $0.733 level would complete a double top formation, highlighting the potential for further downside from here.
As such, watch for a potential break below $0.733 to bring about a bearish continuation signal. Notably, the underperformace of the Australian dollar also brings attention to the fact that we could see strength for the likes of EUR/AUD and GBP/AUD in the day ahead.
 Source: ProRealTime
-
Gold stabilises above support as oil holds its ground
Both gold and oil are consolidating, the former after losses and the latter after gains.
 Source: Bloomberg
Gold
The gold price fell back from Monday’s high, but once again found support around $1795.
The rally from Tuesday’s low appears to be stalling below $1808, below Monday’s peak, suggesting selling momentum remains strong for now. But the continued formation of a base around $1795 does at least suggest downside will be limited in the short-term.
 Source: ProRealTime
WTI
Oil has avoided a renewed turn lower for now, but a break above trendline resistance from the recent highs remains unbroken.
However, losses below $70.50 have been contained, which leads the bullish side to have the upper hand for a time. That being said, a breakout above $72 is needed to revive bullish momentum.
 Source: ProRealTime

See opportunity on a commodity?
-
Indices look for new gains after mixed few days
While indices have avoided further losses there is still some concern that the bounce from last week has begun to stall.
 Source: Bloomberg
FTSE 100
The FTSE 100's gains have stalled over the past three days, but dips below 6950 have found buyers.
The rally seen since last week needs to push on above 7050 to suggest that further momentum is tending towards the upside.
 Source: ProRealTime
DAX
Bulls will be hoping that the DAX's bounce has stabilised above 15,450, after a short-term drop back from last week’s peak near 15,700.
Trendline resistance from Friday’s high continues to hold back progress, so in the short-term a move above 15,570 is needed to provide a more bullish view.
 Source: ProRealTime
S&P 500
After touching a record high on Monday the price has weakened, but overall the bounce is intact. Further gains seem unlikely unless we see a move back below 4370.
 Source: ProRealTime

See opportunity on an index?
-
For more up to date news on how markets will open, the latest earnings and economic news, watch IGTV live in the platform at 07:30am UK.
Today’s coverage:
Olympics: UK now standing 6th in medals table in Tokyo behind JPN US CHI ROC AUS
Indices: Drifting despite massive beat on tech earnings last night. Europe expected down as earnings deluge continues. HSI drop unabated
FX: USD 2wk low ahead of US rates – Fed’s not expected to do or say much
Equities: Massive day on earnings: ITV BATS MTRO GSK RIO BARC GSK DBK FB BA F MCD PFE - last night GOOG AMD MSFT all rise AAPL massive beat but stk slides amid chip shortage. MRW investor refuses bid attempt
Commods: Oil holds recent gains gold has brief respite from recent drop
-
GlaxoSmithKline Q2 revenue is expected to show revenue growth from newer drugs partially offset by increased generic competition in older drugs.
 Source: Bloomberg
When is GlaxoSmithKline earnings date?
The GlaxoSmithKline (GSK) earnings release date is scheduled for the 28 July 2021. The scheduled results will cover the groups second quarter and half-year earnings.
GSK results preview: What does the street expect?
While GlaxoSmithKline (in partnership with Sanofi Pasteur) look to stage three trials of their Covid-19 vaccine, the company has not yet released a vaccine to market. The global rollout of Covid-19 vaccines (by competitors) looks to have disrupted the course of other vaccine programmes in key markets such as the US and the UK for GSK.
Revenue for second quarter (Q2) 2021 is expected to be bolstered by sales of newer drugs in the respiratory and HIV segments, with a partial offset from older drugs which are finding increased competition through generic offerings.
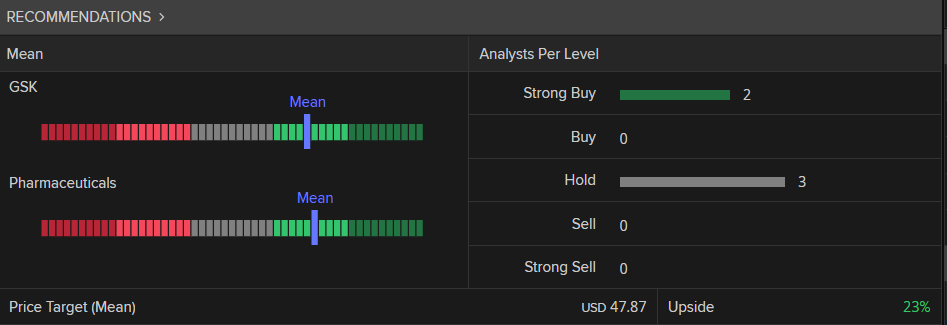
In terms of the upcoming results, a mean of analyst estimates compiled by Refinitiv data arrive at the following:
- Revenue $10.433 billion (+10.27%) year on year (YoY)
- Earnings before interest tax depreciation amortisation (EBITDA) $2.855 billion (-8.91% YoY)
- Earnings per share (EPS) $0.51 (+10.87% YoY)
How to trade the GlaxoSmithKline results
 Source: Refinitiv
A Refinitiv poll of analyst ratings arrive have a long term consensus rating of ‘buy’ for GlaxoSmithKline with a target price $47.87.
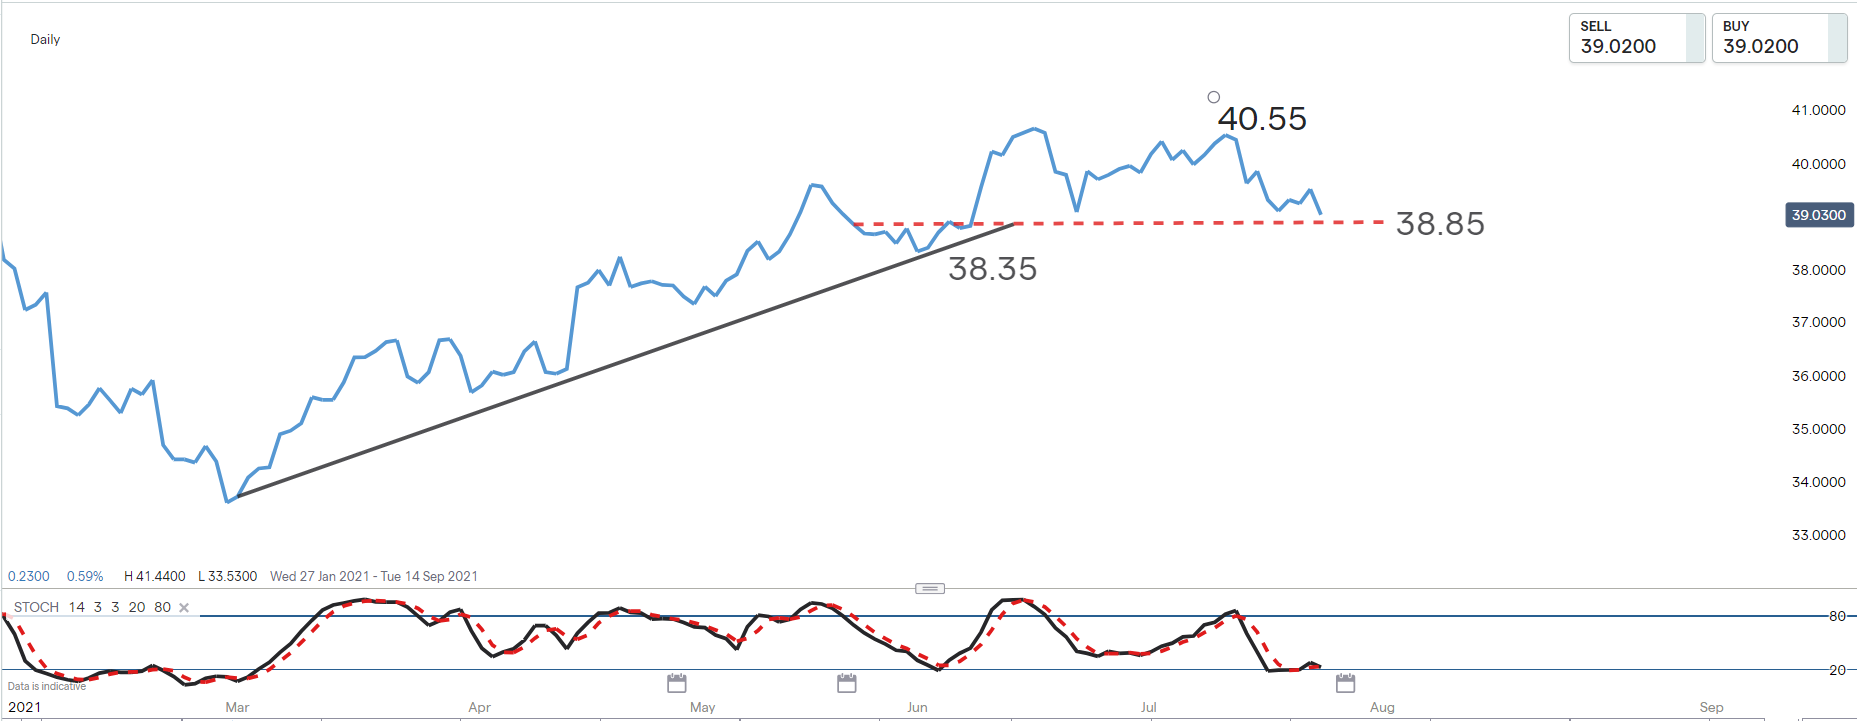
GlaxoSmithKline (ADR) share price: technical analysis
 Source: IG
The share price of GlaxoSmithKline continues to trade in an uptrend which has been in place since the beginning of March 2021. The price has however started to correct from near term highs.
The correction sees the price now testing support at the 38.85 level. Traders looking for long entry might prefer to see a bullish price reversal around current levels accompanied by a sharper move out of oversold territory by the Stochastic oscillator. In this scenario, the recent high at 40.55 would become the initial resistance target, while a close below 38.35 could be used as a stop loss consideration for the trade.
However should a bullish price reversal not manifest and we see the price move to close below both the 38.85 and 38.35 support levels, this could instead be a suggestion that the uptrend has failed and perhaps a new downtrend for the share price is forming.
In Summary
- GSK reports Q2 2021 results on the 28 July
- Q2 revenue of $10.433 billion (+10.27% YoY) is expected
- Q2 EBITDA of $2.855 billion (-8.91% YoY) are expected
- EPS $0.51 (+10.87% YoY) in the Q2 are expected
- The average long term broker rating for GSK is a ‘buy’
- The share price of GSK is testing support as it finds itself in a short-term correction of a longer-term uptrend
-
Alibaba continues to enjoy strong revenue and customer growth, but the decline in its stock price reflects a bleaker outlook thanks to the actions of the Chinese government.
 Source: Bloomberg
When is Alibaba’s earnings date?
Alibaba reports earnings on 3 August, covering its fiscal first quarter (Q1).
Alibaba earnings – what to expect
Alibaba is expected to report revenue of $32 billion, with earnings per share of $2.24.
Alibaba continues to enjoy excellent growth, achieving one billion customers in the 2021 financial year (FY2021), with the vast majority of these based in China. Profit margins and revenues have risen at a steady pace in every year since 2013, at 10% and 23% respectively.
However, for Chinese tech shares such as Alibaba, the main concern is no longer business performance, but the attitude of the Chinese government instead. The cancellation of the Ant Financial initial public offering (IPO) and the current clampdown on tutoring stocks points towards a much more restrictive approach to the private sector.
As many could have predicted, the culture clash between free market capitalism and the controlling instincts of the Chinese Communist Party has begun anew, with the Party determined to rein in the perceived excesses of the free market.
This is a situation unfamiliar to many investors, unused to the impact of government interference on most companies except in relatively isolated circumstances, and accounts for the underperformance of Chinese shares, with Alibaba no exception.
Find out more on how to buy, sell, and short Alibaba shares
Alibaba broker ratings
A total of 17 analysts currently rate Alibaba as a ‘strong buy’, with 30 more at ‘buy’. Three analysts have a ‘hold’ rating, and only one ‘sell’.
Alibaba stock – technical analysis
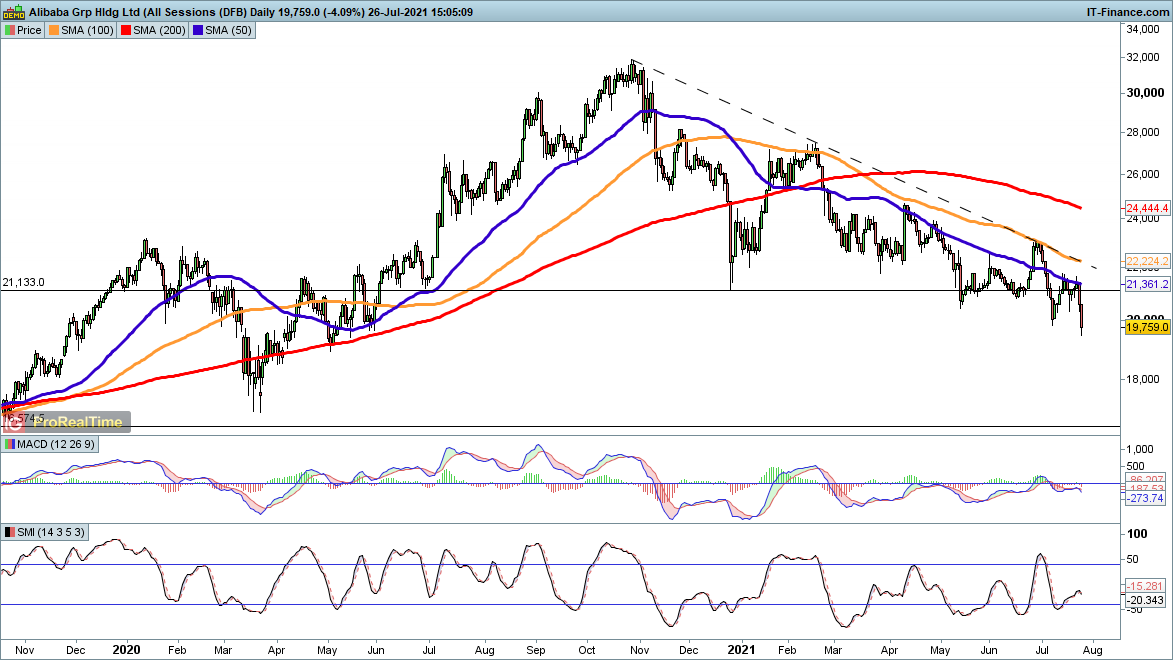
The direction in Alibaba stock is clear for the time being. Rallies have been regularly sold, with the latest bounce in late June running into the 100-day simple moving average (SMA), currently 22,225.
With the macro outlook so unfavourable the stock continues to reflect investor caution, so it looks like further declines are on the cards as the price targets 18,000 and lower.
 Source: ProRealTime
A solid business, but outlook continues to darken
Alibaba has plenty to commend it from a fundamental perspective, but with Beijing adopting an activist position the stock continues to decline.
Investors might argue that this means Alibaba is becoming a bargain, but traders will want to see a turnaround in the price, which is unlikely to happen unless the Chinese government reduces its interventions.
-
EUR/USD, GBP/USD and NZD/USD weaken from Fibonacci resistance
EUR/USD, GBP/USD and NZD/USD turn lower after posting a deep 76.4% Fibonacci retracement.
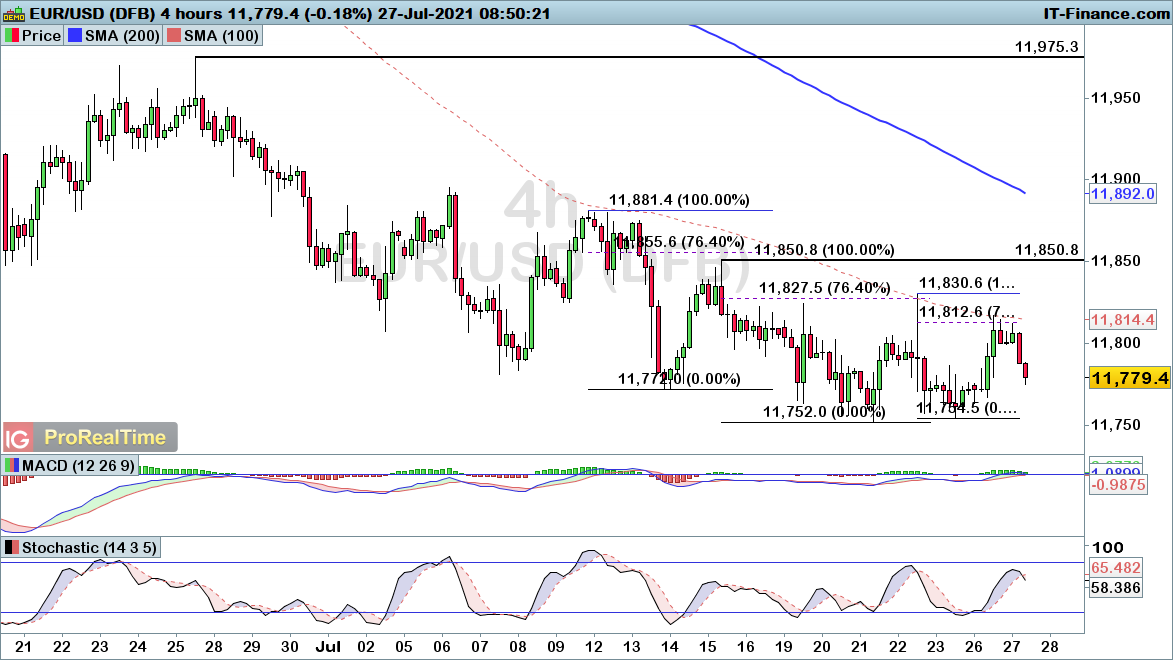
EUR/USD turning lower from latest retracement
EUR/USD has managed to post yet another 76.4% Fibonacci retracement, with the pair heading lower once again. This highlights how the trend seen over the course of the past two months remains worth following.
While the trend is very shallow in nature, that does bring a higher likeliness of a deep retracement. As such, a bearish outlook holds from here, with a push up through the prior swing-high of $1.183 required to negate that downside bias.
 Source: ProRealTime
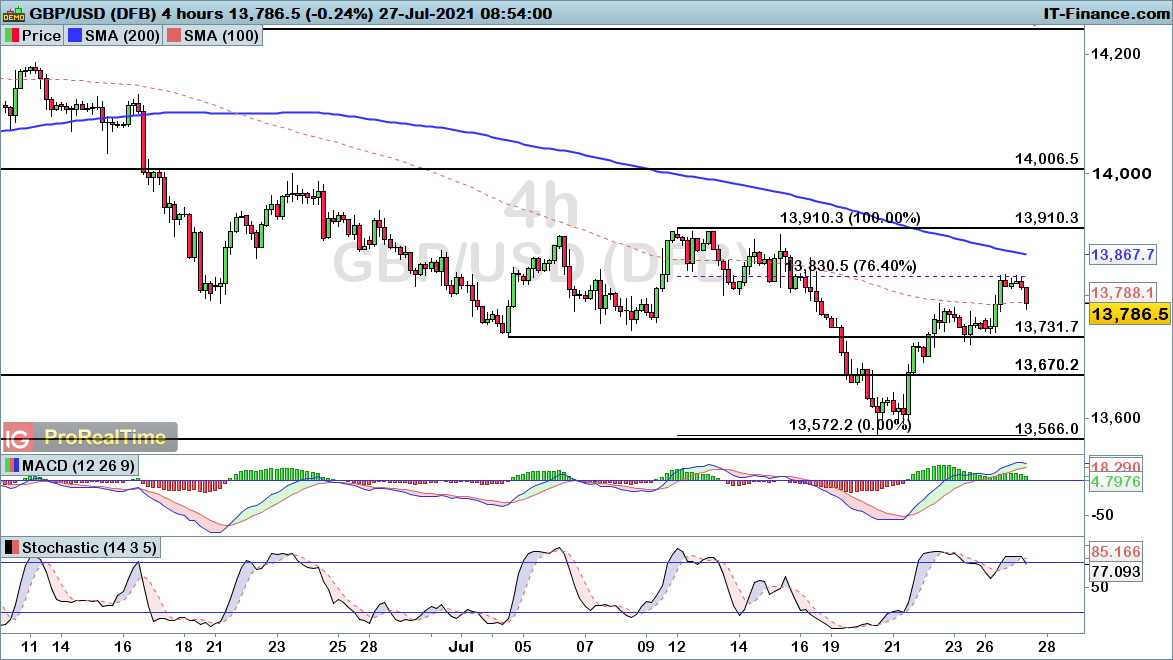
GBP/USD turning lower after 76.4% retracement
GBP/USD has started to lose ground in early trade today, following the rally into the 76.4% Fibonacci resistance level at $1.383.
With a wider bearish trend playing out over recent months, there is a good chance we see further downside from here. A rise up through the $1.391 level would be required to negate that outlook.
 Source: ProRealTime
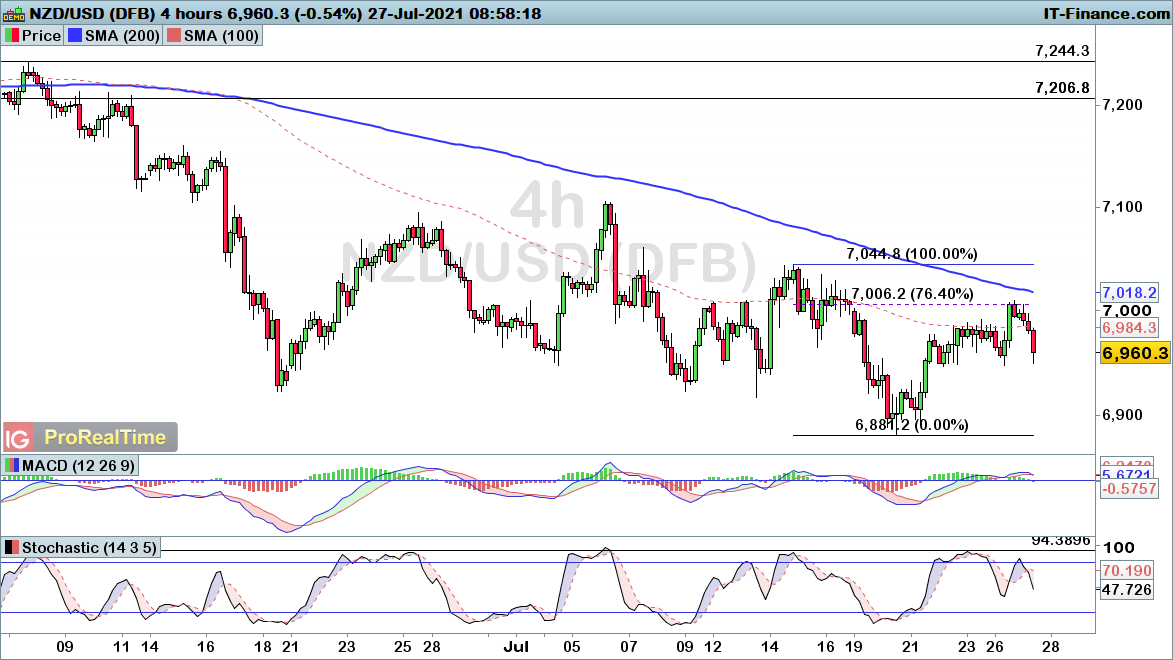
NZD/USD slumps after deep pullback
NZD/USD has similarly turned lower after a 76.4% Fibonacci retracement yesterday.
The wider downtrend points towards such a move coming into play, with a rise through $0.7045 required to negate that bearish outlook. Until then, further weakness looks likely from here.
 Source: ProRealTime
-
Gold falls back into support as Brent crude pushes into Fibonacci resistance
Gold falls back into key support, while Brent crude has rallied up into Fibonacci resistance in its bid to regain previous highs.
 Source: Bloomberg
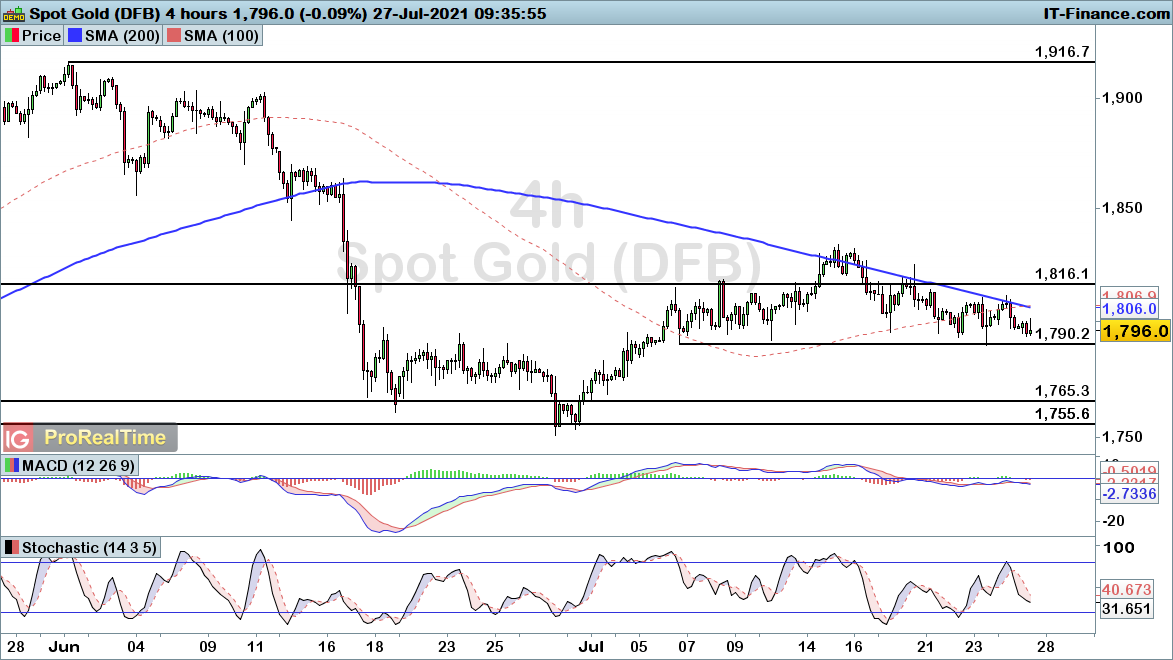
Gold drifts back into key support level
Gold has been on the back foot once again, with price moving back into the key $1790 support level. A break below that level would bring a bearish picture into play following a period of consolidation.
However, with price typically managing to post a short rebound from this level, it is worthwhile expecting another move higher until we see $1790 break.
 Source: ProRealTime
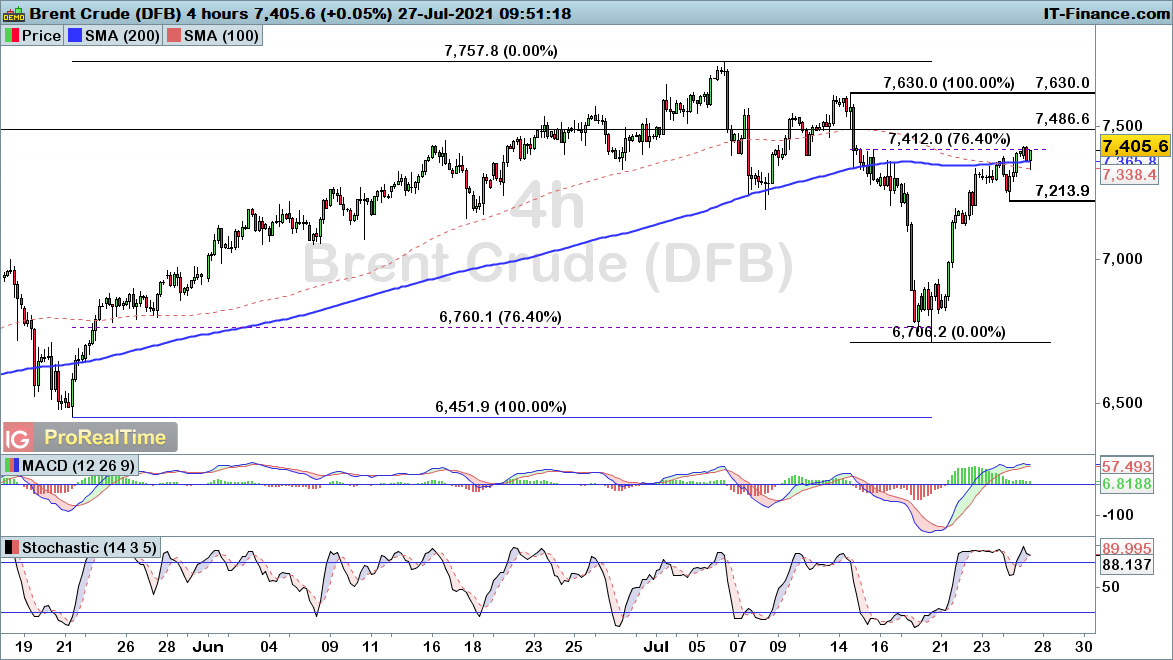
Brent crude rallies back into Fibonacci resistance
Brent crude has been on the rise since a pullback into the wider 76.4% Fibonacci retracement level at $67.60. That rally has brought us back into yet another 76.4% level at $74.12. The wider uptrend points towards a likely push up through this level in a bid to regain the previous peaks of $76.30 and $77.57.
However, whether that will come in a straight line remains to be seen. For now, we need to see whether price respects that Fibonacci resistance level or simply pushes through.
To the downside, any pullback would need to break the $72.14 level to bring a more bearish short-term outlook. Until then, there is a good chance we see further upside come into play.
 Source: ProRealTime
See opportunity on a commodity?
-
Astrazeneca Q2 revenue is expected to show strong growth, although an increased cost base will pressure underlying earnings.
 Source: Bloomberg
When are the AstraZeneca results?
AstraZeneca, the biopharmaceutical company, earnings release date is scheduled for 27 July 2021. The scheduled results will cover the groups second quarter (Q2) and half-year earnings.
What to expect from AstraZeneca results?
While a large Covid-19 vaccine rollout will have boosted revenue for the group, it would have done little for underlying earnings due to the company selling the product as a non-profit item.
Consensus estimates derived from Refinitiv data arrives at the following expectations for Q2 of 2021:
- Revenue $7.530 billion (+20%) year on year (YoY)
- Earnings before interest tax depreciation amortisation (EBITDA) $2.233 billion (-10.75% YoY)
- Earnings per share (EPS) $0.93 (-3.01% YoY)
What is expected to be accretive to future earnings for the group (although may weigh in the short term) is the groups acquisition of biopharmaceutical business Alexion, which was concluded on 21 July 2021, shortly after the reporting quarter.
Find out more on how to buy, sell and short AstraZeneca shares
How to trade AstraZeneca results
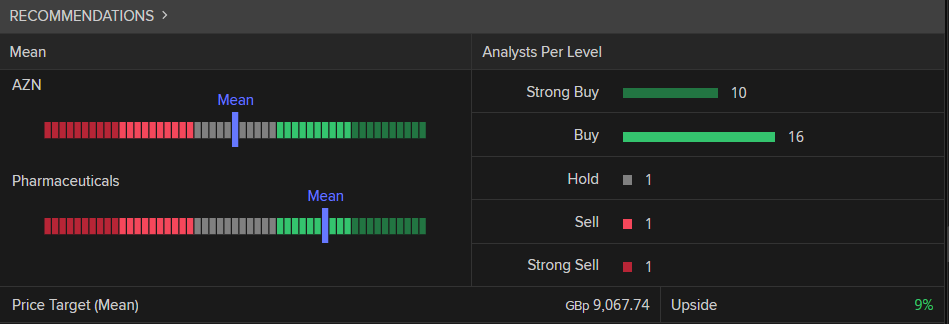
A Refinitiv poll of 29 analysts maintain a long-term average rating of ‘buy’ for AstraZeneca (as of 26 July 2021), with 10 of these analysts recommending a strong buy, 16 recommending a buy, 1 hold, 1 sell and 1 strong sell recommendation on the stock.
 Source: IG
AstraZeneca share price – technical analysis view
 Source: IG charts
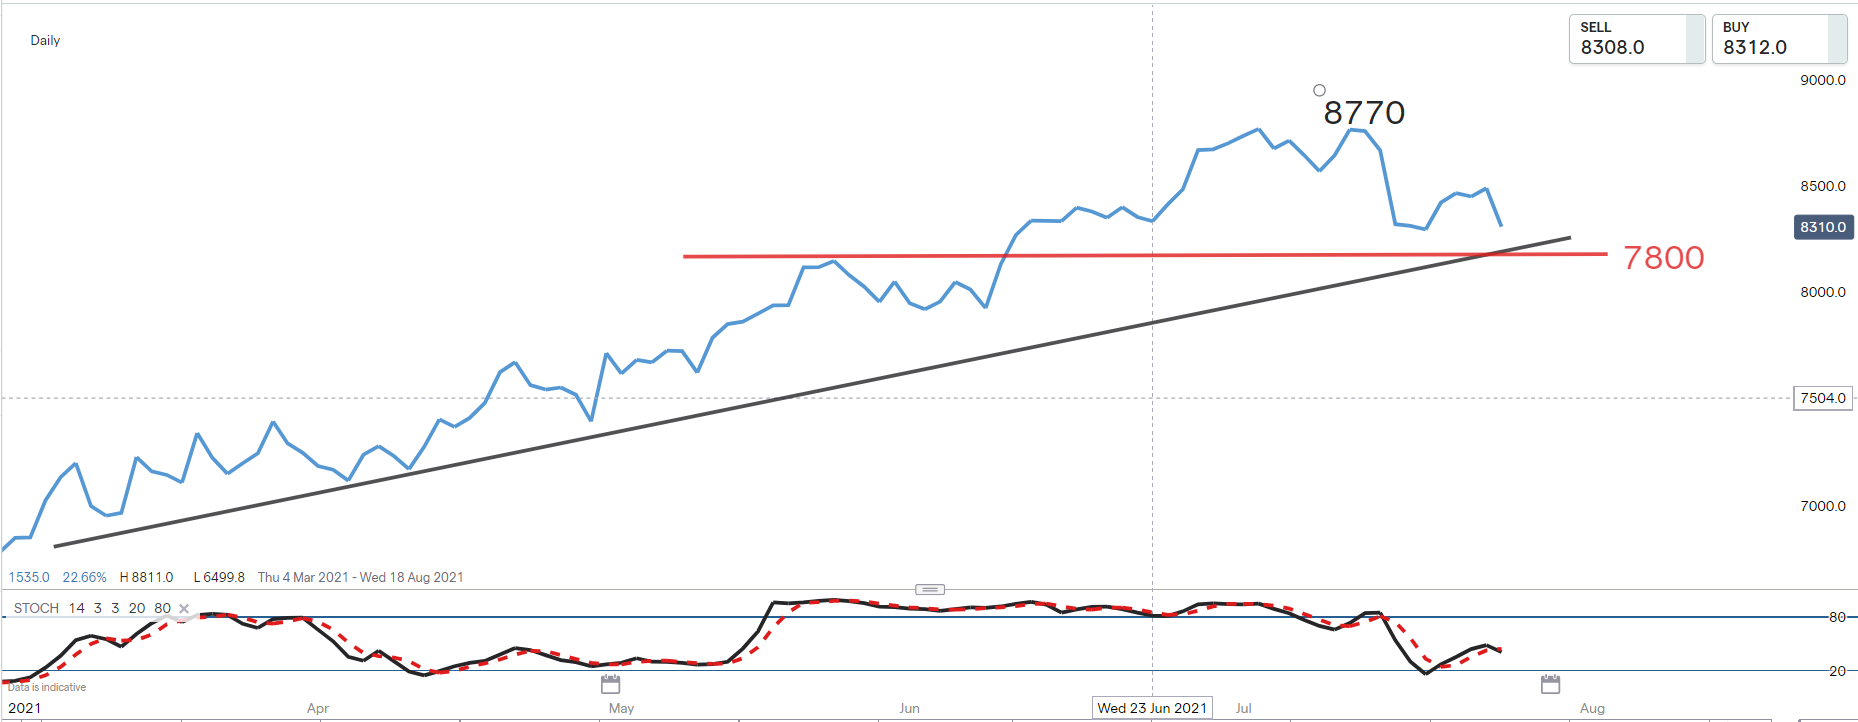
The share price of AstraZeneca continues to trade in an uptrend which has been in place since the beginning of 2021. The price has however started to correct from near-term highs.
Traders respecting the longer-term uptrend will prefer to keep a long bias to trades targeting a retest of the 8770 level, provided that the price does not move to break the confluence of both trend line and horizontal support at the 7800 level. A break of the 7800 level would instead suggest the uptrend to be broken.
In summary
- AstraZeneca results are scheduled for release on 27 July 2021
- Q2 revenue of $7.530 billion is expected
- Q2 EBITDA of $2.223 billion is expected
- EPS of $0.93 is expected
- The average broker rating for AstraZeneca is ‘buy’
- The share price of AstraZeneca is currently in a short term correction of a longer-term uptrend
-
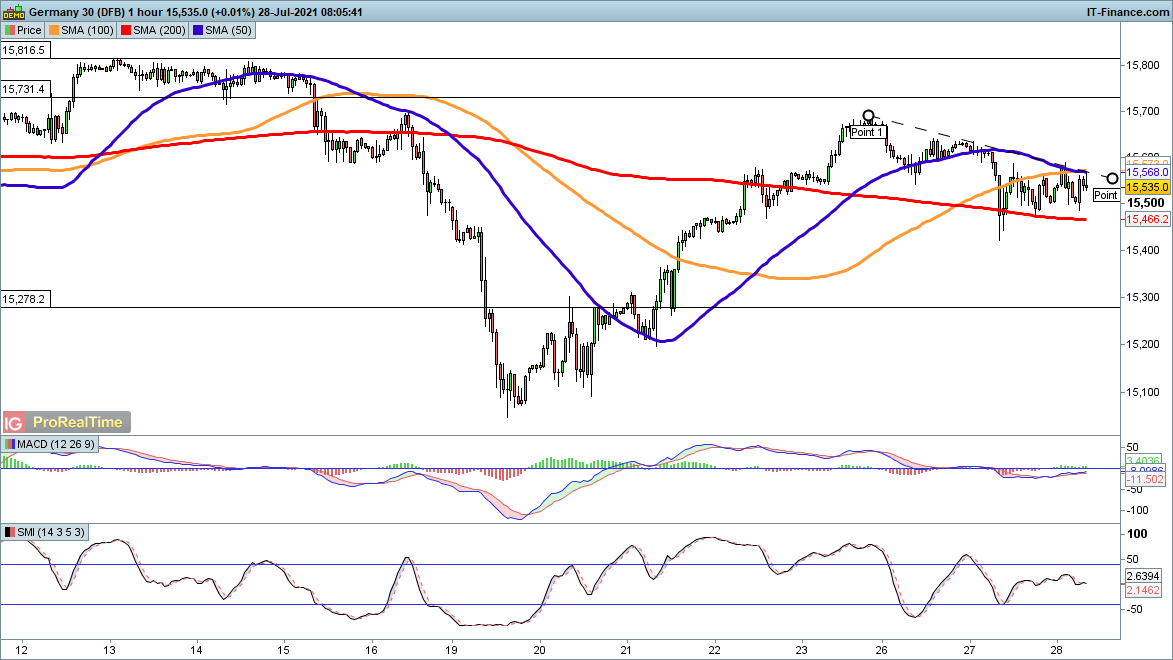
FTSE 100, DAX and Dow head lower as recovery comes into question
FTSE, DAX, and Dow head lower, with the breakdown for the DAX potentially laying the groundwork for a similarly bearish move elsewhere.
 Source: Bloomberg
FTSE 100 at risk of downturn
The FTSE 100 has started the day on a negative footing, with the index heading back towards the key 6979 swing-low.
Coming off the back of a deep retracement above the 61.8% threshold, a break back below that support level points towards a potential period of weakness coming into play. As such, watch out for whether that 6979 level breaks as a gauge of sentiment for the day ahead.
 Source: ProRealTime
DAX on the slide after breaking support
The DAX has already broken through the key 15542 support level, following a rally up through the 76.4% Fibonacci threshold. There is a good chance this move lower will provide a retracement of the latest rally rather than an all-out capitulation.
However, the break below 15542 does point towards a heightened chance of near-term downside, with a bearish view in play unless price rises through the 15641 level.
 Source: ProRealTime
Dow Jones turns lower after record high
The Dow is similarly on the back foot in early trade, coming off the back of a rise into record highs.
That intraday uptrend remains intact unless price falls back below the 34760 swing-low. Such a breakdown would point towards a potential retracement of the rally from 33740.
However, for now we need to see whether or not price ends this intraday uptrend by breaking 34760 as a gauge of sentiment.
 Source: ProRealTime
-
 Taking a look at the economic calendar, it is set to be a busy week for the forex market. There’s a central bank rate decision, GDP, inflation and employment reports scheduled for release. A number of big tech companies have earnings reports and, with U.S. stocks hitting a new record high on Monday, investors will be watching those results carefully as major disappointments could trigger widespread profit-taking.Here are the 10 most important things to watch this week:1. U.S. Federal Reserve monetary policy announcement2. Big Tech Earnings3. U.S. Q2 Advance GDP4. EZ Q2 Advance GDP5. Canada GDP6. Eurozone CPI7. Australian CPI8. Canadian CPI9. Germany’s Employment Report10. U.S. Personal Income & SpendingFull article by Kathy Lien, 26th July 2021. Investing.com
 -
For more up to date news on how markets will open, the latest earnings and economic news, watch IGTV live in the platform at 07:30am UK.
Today’s coverage:
GBR remains 5th in medal table after US JPN CH ‘ROC’
Indices: Europe consolidating around Monday’s highs as all e Wall St indices hit record highs. Asia sees another record high for ASX but HSI strikes Nov 2020 lows on China crackdown
FX: USD lower ahead of durable goods today sending GBPUSD to 8 day high. EURUSD defends 177.72 support again
Equities: TSLA up 3.2% after Q2 last night. MC strong leather good sales, Awaiting RB RCH & FGP at 7amUK and MSFT AAPL GOOG & AMD after the US close tonight
Commods: Gold hovering at Monday’s close at lowest level since 7 July. Oil 10day high
-
With Virgin Galactic’s Q2 earnings in sight, we explore what investors and traders need to know.
 Source: Bloomberg
When does Virgin Galactic report earnings?
Virgin Galactic Holdings Inc (SPCE:US) reports financial results for quarter two (Q2) of 2021 following the close of the US markets on 5 August. The release comes at an interesting time, for the business, having achieved the major milestone by undertaking the first civil passenger flight to brush space.
What does Virgin Galactic do and what should traders be looking for?
Virgin Galactic pitches itself as a vertically integrated aerospace and space travel company, pioneering human spaceflight for private individuals and researchers. It manufacturers its own air and space vehicles and will continue to refine spaceflight systems designed to offer space travel to private individuals.
Having achieved history, on 11 July this year, as being the first space flight to lift-off with private passengers aboard and being designed with the specific job of opening up space travel to private citizens, the work now really begins. Founder Sir Richard Branson was aboard the flight to witness the experience.
What to expect in Q2
The costs associated with pioneering space travel are so immense, it is difficult to accurately predict, on a quarterly basis, what to expect. However, what we do know is that, going into Q2, back on 1 April 2021, the company had cash and cash equivalents of $617 million, but recorded a quarter one (Q1) net loss of $130 million. That compared favourably to the same period last year when it published a loss of $377 million.
Clearly, this first space trip, in Unity22, as the reusable space craft is called, was always going to be disproportionately expensive. However, the business model is now to work on a commercially competitive package for people to fly over the margin of earth’s atmosphere up into space.
In an effort to move ahead with the plan, Virgin Galactic is going to need considerably more money. To this end the company announced plans to sell $500 million of stock, which came the day following the inaugural flight. This wiped $1 billion off the company’s value, immediately, taking its market capitalisation down to $7.4 billion.
How to trade the stock
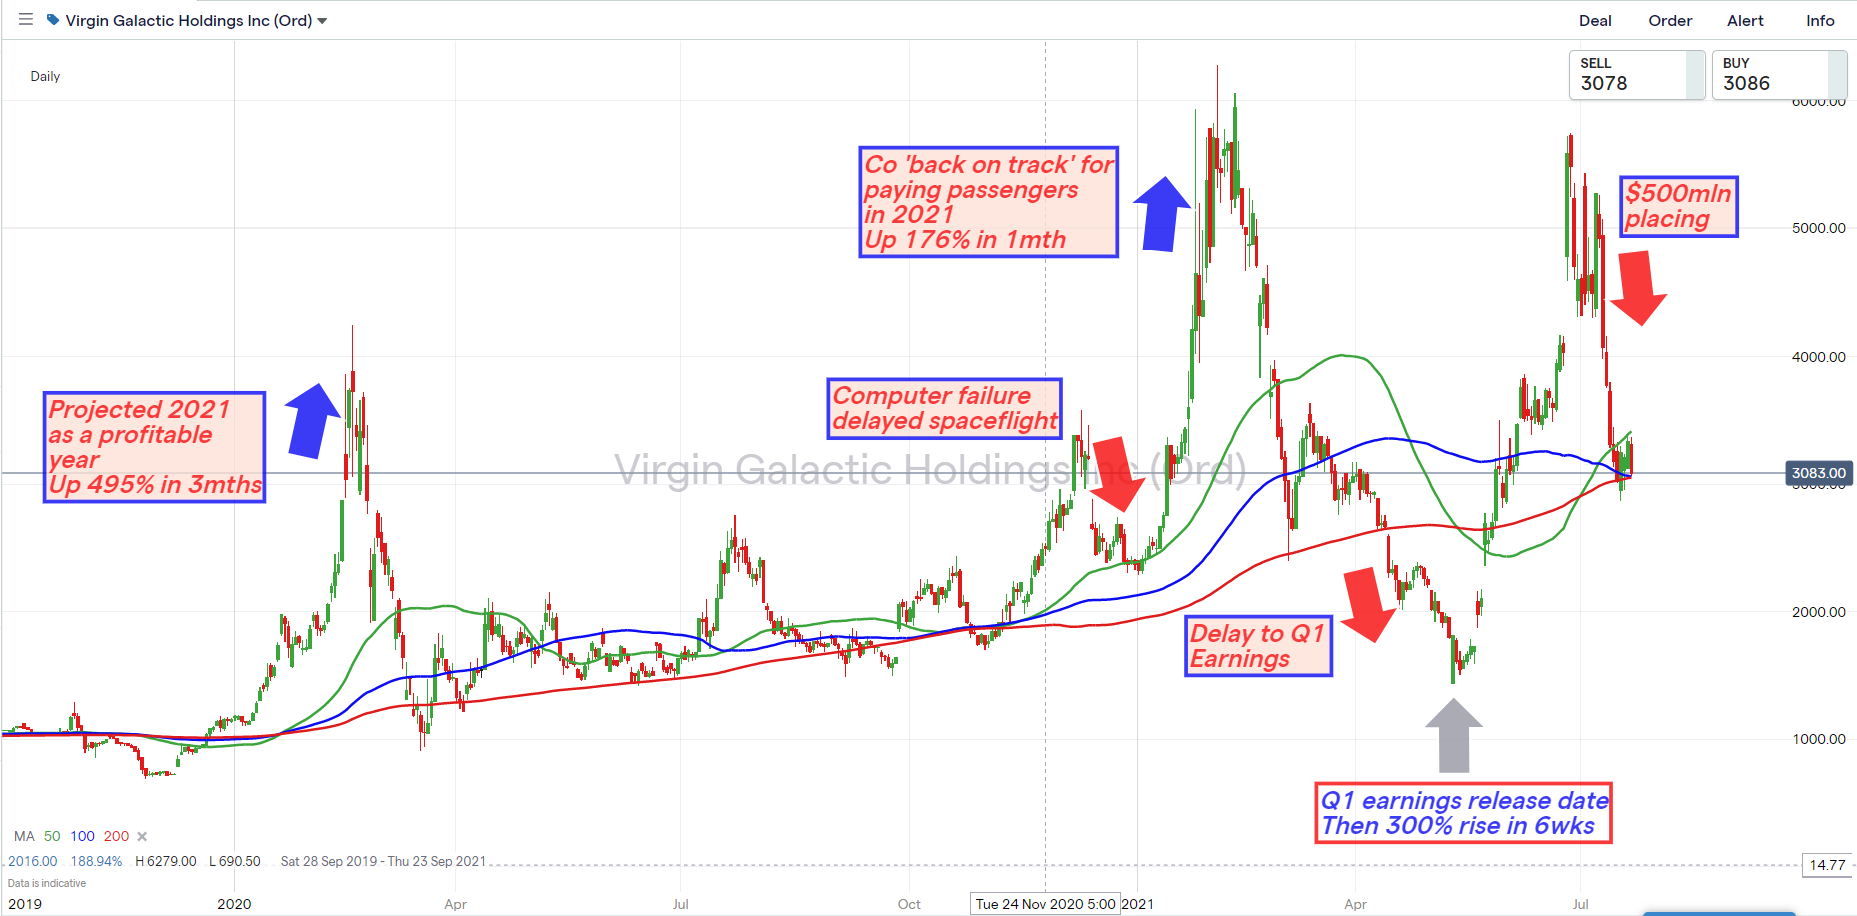 Source: IG
Shares of the space tourism pioneer, which went public in October 2019, at $11.79 per share via a reverse merger, not a traditional initial public offering (IPO), have had the proverbial rollercoaster ride.
Investors and traders need to know that volatility in the stock is to be expected. The company is a cash gobbler and it is inevitable that there will be unexpected hurdles along the way in the tight schedule it has set itself.
Moving from left to right across the chart, the stock price saw the first big leg up just ahead of the point at which the Covid-19 pandemic struck. At the time there was the statement that, assuming that launch occurs as planned, management projected that the company would reach profitability in 2021.
Thereafter, a disappointing delay to a space flight saw a stock pull-back, then came the bold prediction of space flight within the year saw a 175% rise in just four weeks at the start of 2021. A delay to earnings brought about another wobble, but traders and investors need not have worried as the release date thereafter saw a 300% rise in just six weeks.
Will the company now be able to provide a clearer picture of how the remainder of this year develops, will it be able to share its vision for the second half with any clarity from within the Q1 earnings release? It really is down to your own personal view as to whether the whole venture will succeed.
Find out more on how to buy, sell and short Virgin Galactic shares
Virgin Galactic shares: where next?
Branson, a master of publicity, timed the first manned spaceflight to steal a march on his arch rival, Amazon founder Jeff Bezos, for maximum impact. But Bezos, in his Blue Origin rocket, went further and has a more detailed plan for commercial space travel. How it will all end for each remains to be seen, but the bottom line is that, to succeed, each will need a steady stream of people willing to stump up a disproportionate amount of money for such a short thrill.
As Ray Davies wrote for The Kinks: ‘Let me take you on a little trip, in my supersonic rocket ship’ foreseeing the opportunity that will, surely, come our way at some point. The big question is whether it will be Virgin Galactic that will end up being a regular provider of commercial trips beyond our atmosphere.

News and Trade Ideas (Commodities)
in Commodities
Posted
Gold and Brent crude continue to gain ground as the dollar declines
Gold and Brent crude continue to rise, with key resistance levels coming into play as we close out the week.
Gold rallies into key resistance level
Gold has taken advantage of the dollar decline, with the precious metal rising back into the key $1834 resistance level.
The ability to break through that level will be key here, with a reversal or break providing a clue of where we go from here.
Brent crude looks likely to continue recovery trend
Brent crude has been on the rise over the course of the week, with price pushing up through the 76.4% Fibonacci resistance level yesterday.
That points towards a likely rise through the $76.30 swing-high before long, with a bullish outlook in place unless price falls back below the latest swing low of $73.12.