

Mercury
-
Posts
3,580 -
Joined
-
Last visited
-
Days Won
48
Content Type
Profiles
Forums
Blogs
Events
Community Tutorials
Store
Posts posted by Mercury
-
-
Ha! if ever there was a more timely object lesson in keeping an open mind than EURGBP just now I don't know of it. Reminds me yet again not to trust H&S on low time frames. In any case the over picture remains intact until the past lows are broken, let's see what GBPUSD does next...
-
Whatever caused the GBP spike: rumour, speculation whatever, Eur didn't follow suit and US indices are heading up (Nasdaq just off 7700). IF this continues I doubt GBP and FTSE100 current direction is sustainable but let's see how it unfolds before passing judgement. My biases remain unchanged at this juncture.
-
Quick update to my original post, current 1 hour charts showing a much faster retrace than I previously reflected but still within the overall assessment. In fact on Gold it is better because the market is currently showing a retest of the support area and bounce away. If this holds then the break of the Daily tram-line could be swift. There was a similar breakout and retest of support/resistance on Silver, not yet confirmed as a failed retest but one to watch as it is path-finding for Gold at present.


-
Thanks @elle I tend not to use H&S in lower time-frames myself and even in higher time-frames only with certain conditions and so hadn't seen that but I take your point, especially if you also look at the recent up/down as a higher high (just) and higher low, so it all seems to stack as a bullish move set up (at least ST). And with GBP and EUR turning down again, and if my assessment that EUR will not fall as far as GBP in this move, then EURGBP should rally. I would like to see a firm jump soon to confirm.
-
I like to look at FX Triads to keep my analysis honest (or at least to identify where something doesn't look right). Not always easy to assess, especially when the two main sides to the Triad (in this case EUR/USD and GBP/USD) are going the same way.
I am looking at EUR/GBP with a contrarian bias (Warning! I have a bias here but at least I recognise it...) in that I believe the majority view that Brexit is doom for the UK to be misguided. People will point to GBP/USD as proof but I believe this will turn out to be confirmation bias as if you also look as USD across the board you will see USD strength and others do not have Brexit issues to contend with (EUR, CAD, Yen, etc. etc).
Anyway back to the only data that matters to me, price action.
On the weekly chart I have a very strong Triangle consolidation formation since the 7 Oct 2016 market top, which I believe to be a wave B top leading to a strong Wave C Bearish move (check out a Monthly chart to see this more clearly). The alternative assessment, aligned to the anti-Brexit viewpoint, is that the Euro will charge up against GBP and that this Triangle consolidation is building toward this move but I find it hard to see such a strong move against GBP if the Euro also drops heavily against USD. Either way when there is a breakout of this Triangle it will be a trading opportunity, especially if it is to the Bearish side (more potential points in that scenario for me).
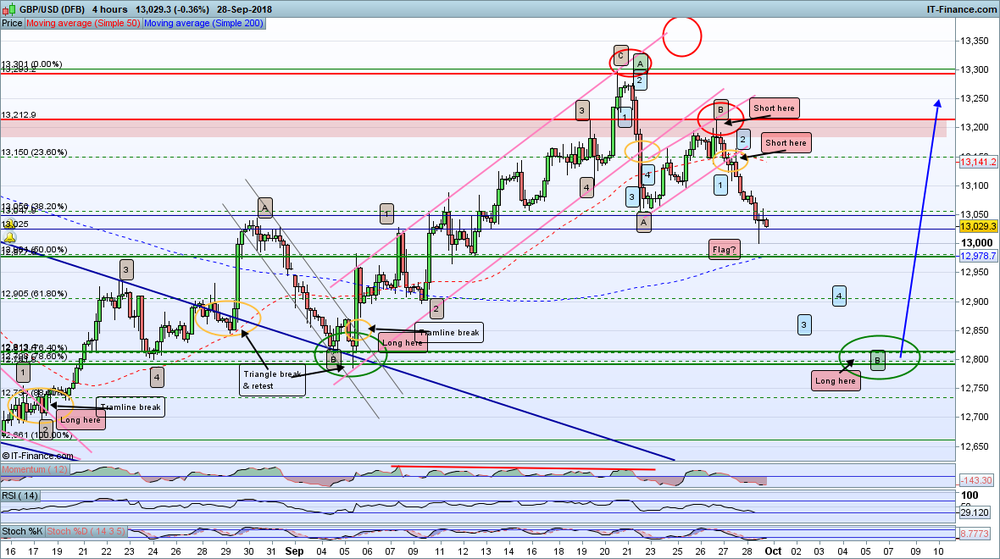
Looking at the Daily chart I see a Flag formation (blue lines) that has been broken and now the market is seeking to retest that Flag resistance. It is possible that this has happened already on Friday 21 Sept (my Brown A label) but I believe we will see another rally to the Fib 76/78% area where it intersects with the lower Flag trend-line to complete an A-B-C retrace. If we see a rebound back off this area of resistance then a Bearish move could be on. This could coincide with a rally in both EUR and GBP vs USD (as I have indicated in other posts is my assessment) OR a full on Bearish move in both cases with EUR getting hammered faster and harder (trade wars anyone?).
Looking at the Hourly chart I see a potential A-B retrace completion with a breakout of the upper tram-line. If you like to trade short term there could be 100-150 points on offer here. I prefer to keep my power dry for the Short side of this market, unless the breakout from the Weekly Triangle is bullish of course but in that case I would seek better market opportunities elsewhere.
Anyone have any thoughts to offer on this market? I'm really very keen to hear challenges especially.


-
Spike in GBP/USD probably @Caseynotes, there seems to have be some inverse correlation of late, doesn't last of course. I don't pay too much attention to that stuff anyway. However on the hourly chart the 8am pin bar rejection of the bear move and subsequent Flag breakout (not yet fully confirmed) is a bullish signal. A fresh high on this rally phase (i.e. break of Thurs 27th high) would seal the bullish move for me and then I will be looking for the major turn on all indices for an exit and reversal.
-
Thanks for the comments @elle I am not sure if your chart is supporting my assessment or suggesting a bounce off your hashed line is showing a Bearish move. It could certainly be the case that GBP (and EUR) has put in a more shallow retrace and is now on it's way into that LT motive Bear move I was talking about. A break of the recent lows would confirm this for me. At present I still favour a higher retrace for both EUR and GBP but let' see... Right now we are seeing some buying pressure on both GBP and EUR but I am not sure yet if the Wave B is done. Got to be patient as these moves develop and wait for the trade triggers...
-
Re FTSE100 I agree @Caseynotes in the sense that a short term rally is in play in my opinion. This falls in line with my assessments of the US indices. Right now I think we may be seeing a Flag/Pennant breakout rally on the FTSE100 (1 hour chart). If correct the FTSE100 has quite a rally in it, probably more so that the US indices if it is going to make another all time high before end times... You can see similar set ups on the 3 major US indices also, in fact Nasdaq has already broken a Flag and has just poked above the previous all time high on 30 Aug. All looks bullish in the ST to me as we move towards US NFP on Friday, if we make it that far before a reversal...


-
I see a similar pattern in GBPUSD as in EURUSD so overall it looks like GBP, like EUR, is set for a retrace rally, which, if correct, is already underway. When this concludes the Bear should get it's claws in again as USD rallies strongly across the board.
Looking at the GBPUSD Monthly chart we can see that GBP has been in decline for a long time, in fact a steady decline since the early 1900s but we don't have that much data here. In more recent times GBP crashed down to almost parity in 1984, something I expect to see revisited in the relatively near future and perhaps a breakthrough to below parity this time? One thing of note is that GBP was falling significantly well before Brexit and therefore I do not subscribe to the notion that Brexit is a major driver because macro global factors are much stronger. Not that it really matters much to me what is driving a move, so long as I recognise a move and get in... We can see on the Monthly chart that recent price action has been in consolidation in a Flag formation, hard to trade due to whiplash effects. However there has been a significant breakout to the Bear side now and I believe this market to be in a short term retrace (or relief) rally that will set up a strong motive wave Bearish move soon.
The Daily chart shows the Flag break and current retrace more clearly. This appears to be moving in a classic A-B-C form and is mirrored in EUR and AUD (probably more too but note CAD and JPY are on different paths). By my reckoning the Wave A is done and now the markets are moving back down to complete the Wave B before rallying hard to complete the overall relief rally. I am looking for such a rally to come into the resistance zones around about the point at which the Flag was first broken through (probably beyond that for AUD as it happens). This would be in the 13800 area for GBP/USD. Actual turn point can only be pinpointed by price action of course, so this is only a guide.
Hard to pinpoint a Wave B termination, they are unpredictable in nature as the market forces slung it out between Bear and Bull sentiment. Sometimes they run fast to closure and sometimes there is a lot of whiplash. Of note it looks to me that GBP will drop more heavily than EUR in the coming week or so. If price breaks the 15 Aug low then the retrace is already done but I think the likelihood of this is lower (at this point).
Trading:
- I was long from the tram-line breaks off the Wave 1 turn (mid Aug) but cashed near the Wave A top
- I am short from the wave A turning point and holding stop protected at break even until I see a Wave B turn (otherwise can hold if this is already the Bear continuation)
- Upon seeing price action moves into a rally phase I will seek to cash shorts and go long up to the previously identified retrace terminus zones
- Then it is about beginning a long term (several years) Shorting campaign (Long USD)
Any one see it differently? Let me know your reasoning if you do.


-
 2
2
-
 1
1
-
So if Indices are close to a top, as I have suggested in other posts, and USD is closing on a strong rally phase (maybe a month or so to go) what of Gold/Silver? Of late these precious metals have been impacted by USD (travelling inversely to the dollar) but if Indices do begin a major Bear phase then the flight to safety would push both USD and precious metals into a strong rally. In fact I believe USD has already started a strong long term rally and of late has been in a natural retrace prior to a major push north (see my post on the "are Indices over-valued" post. But what about Gold and Silver.
The monthly Gold chart shows a very long term support trend line, which remains strong. We can see the major rally to the commodity highs in Sept 2011 and since then a classic A-B-C retrace. If this holds (i.e. if the market does not break below the LT trend line) then we have already seen a major 1-2 wave move pointing to a huge motive wave rally to come. The Weekly chart shows a series of 1-2 retrace moves [Purple and Pink labeling] within a large Triangle formation with the LT supporting trend-line as the bottom line of the Triangle. Furthermore there is a potential Head & Shoulders formation (blue circles) and a very nice associated neckline, which is also the top of the aforementioned Triangle. This is a strongly Bullish set up in my opinion, which will only be negated by a significant break of the LT supporting trend-line/Triangle.
Zooming in to the Daily we can see a pair of tramlines [green] on the retrace move down to the recent bottom where a significant reversal pin bar can be seen on both the Weekly and Daily charts (very bullish). And it looks like the LT trend-line is still strong with a short term 1-2 retrace completion {blue labels} that occurred on Friday. My hourly chart shows this move in more detail. I am expected another 1-2 retrace either before a breakout from the tram-line or afterwards with a retest of the tram-line. Either way a breakout of the tramline is a Long trade trigger for me.
I am long from the LT tramline and looking for confirmation of the move to add a long term rally campaign. Out of interest Silver looks to have already broken out. I will be waiting for a retrace back to support levels to seek a Long on Silver also.
Thoughts?


-
Regret is a killer in my view. It is hard to do but you have to let missed opportunities go and focus on something else or they will eat you up and make you trade on emotion. Similarly chalk failures up to experience and move on, with learnings of course.
-
Agreed if you are a day trader re things going how you expect but staying out to avoid the whipsaw affect. For longer term traders such days are both good and bad: good because they bring about what you may have been forecasting and bad because you miss the turn, especially if it happens over night. However overall they are good if they show the long term direction has changed. Still need to confirm with a new low on stock indices but it is looking good.
-
Happy Anzac day Zero, gald it all worked out ok. I think the Yen is in for a little bit of strength but this current weakness against the USD isn't over just yet.
-
BTW, Zero, for the avoidance of misunderstanding, I'm not suggesting that you don't post your trades just that you don't need to feel you have to do so to justify your posts. I'd also love to hear more perspective on the Asian markets if you felt you wanted to.
-
LOL! I don't know anything about binaries and will stick to the main indices spreadbetting to keep it simple in my simple mind, the analysis of the market is taxing enough, but I do check out your posts Zero to try an glean any interesting directional titbits and to get a view from overnight down under so please keep it up.
Regarding posting of trades etc I can go either way. Boasting is a bad sign for a trader in psychological terms I feel but information on what made a successful trade (identification, entry and exit) is always interesting to me. In particular the reasoning behind the identification. Predominately I post to indicate (with my red and green circles) where I are seeking to take a trade and later where I may exit. I don't keep a running commentary of success or failure because I am not trying to gather a following or anything and don't feel I have to prove my analysis that way (I assume people can make up their own minds on that...).
My chief objective in making posts here is to get input on my ideas (supportive or not, especially not!). I am keen for people to tell me why they have a different view and to show that with some supporting analysis or thinking.
you can assume that it the market turned at or near the points I indicated I have made a trade there, unless something changed my view on the way there, in this case I will usually have already made a corrective post.
-
Hi Zero,
I'm not sure what you are saying, was there any reason given for not taking business? I assume they haven't refused you as a client, just some particular form of trade or is it something else?
-
Hello again Welshman,
From my previous post ont he FTSE100 you will know that I use EW extensively as part of my trading methodology. I find it vital to assessing where the market is at in its cycle. I start with the Weekly charts to get the long term position and then hone into the hourly to trade. There is always at least two alternatives to contend with so it is a process of constant evolution and re analysing for new price action information.
Using your gold example I have the same count as you but also an alternative. Everytime we start a new move it could be either a 1-5 motive wave OR an A-B-C counter trend rally and we won't know until Wc or W3 is complete and then the next move will tell the tale. However it doesn't much matter until then as the opportunities are the same. In gold I see either an Wave A/1 completed moving down to a W B/2 OR this is a Wave 3-4 move with a further Wave 5 to go to get up to a Weekly chart Wave A.
Note that there is a strong Negative Momentum Divergence and Stochastic is dropping, which is indicative of a significant retrace. When these bottom out and if they coincide with a Fib resistance line then that will be a good place to go long. On the hourly I foresee a lot of up and down noise in the short term with another pop up to $1290iish quite possible before the Wave B or 4 gets going.
At this stage what is important is that gold is set to drop and the Fib tool can help us pin point where it will turn back up. Long term gold is going up in my view so I only want to add ot my long positions until I see a major turn. I'm targeting the $1400 area for that major turn and looking at the Fib 50% or 62% to get in long having already got long and holding at $1080.
Here is the chart:


GBPUSD retrace trade
in Foreign Exchange (FX)
Posted
LOL @cryptotrader but it depends where you are going on holidays I suppose. If it's the US then yeah you need to buy forward but if elsewhere then maybe ok. Note that I suggest Brexit is not a major driver but I don't discount it totally. I suspect it is a short to medium driver of sentiment but by overall contention is that it will prove NOT to be significant in the face of larger geopolitical and global economic forces. Perhaps we need a separate thread on this particular topic.
Note that Brexit doom mongers point to a falling GBP as a problem for UK economy but this is incorrect in my view. a weaker pound is good for exports and is a natural reaction to a poor trade deficit position, which is what we have. Perhaps, we will look back and that the stars for Brexit if the EU collapses in on itself, the Euro collapses (as I believe it will) and the UK successfully opens trade deals with the commonwealth nations and others that, together with a weaker pound fuels export trade. In such a scenario the UK becomes, what it has historically been very good at, a trading nation.
Food for thought...
PS: if you are planning holidays to Europe you will probably be fine, in fact I'd hold off buying Euros for a while yet to see which way that Triangle breakout goes (see EUR/GBP/USD Triad post)