

WallStFoxy
-
Posts
202 -
Joined
-
Last visited
-
Days Won
3
Content Type
Profiles
Forums
Blogs
Events
Community Tutorials
Store
Posts posted by WallStFoxy
-
-
40 minutes ago, FFS_Daytrader said:
Oil looks under pressure today - broken channel minor support and heading toward 5573 (38.20% Fib)
I see support @ $56.06 and a test of the d30sma this could be a nice pullback to buy.

-
 1
1
-
-
3 minutes ago, Caseynotes said:
Always a possibility, the daily has taken on a nice twin reversal pattern look about it, this last hour of play should be telling before the US market close.
Yep, I noticed the last hour on Friday saved the day and it could again so we wait and see yet again!!
-
1
-
-
24 minutes ago, Caseynotes said:
It was the US open that did it and if you look at the Sunday 1 hour bar as a weekend gap then what we are seeing now since the US open is a gap fill, interesting.
I get that, but it shouldn't have filled so soon under the circumstances especially so close to the ATH and if so it should have rallied as soon as the gap filled, we will see soon enough but I think this could turn out to be a reversal. 👿
-
22 minutes ago, Caseynotes said:
I see the S&P has fallen away too after setting a new ATH and the US manu PMI figure this afternoon was ok and no other big news that I've seen so the move up turned out to be a test of resistance which was confirmed and price is now is looking to test support. It may find it around here at 26640, if not will need to look lower at around 26520.
26640 is under pressure now and 26520 could be next, but not what you would expect after Trumps U Turn at weekend. The FTSE & The DAX held on as long as they could before they followed The DOW down, clearly not expected. 👿
-
Any idea why the Dow failed to tag the ATH today? unless we get a late rally today I'm thinking this looks pretty bad, any ideas? 👿
-
3 hours ago, Caseynotes said:
Mine auto calc each day as well but there is also the choice of 4 other versions of which Woodies is one. I've got two other pivot indicators and was just comparing the 3 of them and see that they are all the same and match your values except for the R3 and S3 on the one I've been using so I need to ditch this one and use one of the others, thanks.
You are welcome I hope it helps, I love my pro-real charts & wouldn't change for the world. Previously I used MT4 charts and was very happy with them but never found a good pivot Indicator for them, some how they never seemed right.
-
1
-
-
On 28/06/2019 at 17:19, Caseynotes said:
@Foxy, that's quite a big difference in the R3 number, I get your R3 figure if I switch the calc from standard to 'Woodies', might pay to check.
I have noticed you often have different levels to the Pro-Real Charts but they work fine and are well respected so I have no problem with that. They say the pivot point formula I use is (H+L+C) / 3 and the exact level of R3 was 12487.3
I don't have to work them out, they are on my chart every day and work fine. In fact R2 was 12411 and was very well respected all morning so I guess it's not a case of right or wrong it's what you like to use.
-
1
-
-
Wall st is looking for long stops around 2550 Maybe?
-
49 minutes ago, Caseynotes said:
May well work out fine if Dax can carry itself over this 12334 which has held it up repeatedly since Monday.

It's been the DOW that's pulled us back every day this week, I just hope we get a bull run for the end of Month. Proreal has R3 at 2490 so I've set that as TP, if it happens it will be a great day.
-
1
-
-
1 hour ago, Caseynotes said:
That would be fun 🙂 but the ATH? maybe a bit too speculative. Interestingly on top of the G20 uncertainty is today's Week end, Month end and Q2 end flows and I think Trump and Xi aren't meeting til tomorrow so we may end up seeing an exiting of longs before the close instead.
That we remain to see, I am long on the DAX and hope to close sometime after 21:00 all being well.
-
Dow to hit 27000 by 22:00 today, Maybe!!!
-
1
-
-
I don't know but I think wall st. traders must want to follow the s&p ATH of last week so Friday and last Day of the month tomorrow we could see a big rally on wall st. Thursday/Friday that would leave us with a big stop hunt before the rally possibly. 👿
-
1
-
-
Thought this may feel good, if you haven't worked it out. 50,000 shares of JD = £500pp @ 580 he was down 17.8 points almost £9000.00
-
6 hours ago, dmedin said:
It's looking okay today for JD Sports short. Got a ways to go but on the right path! Would like to find a way to remove the open order overlay when taking pics of my chart. Just for modesty's sake.

Yep & Ocado is moving in the right direction. I guess the smarty pants with £300,000 of JD wished he knew what you knew now. Ha Ha Feels good to be right. Like I said yesterday don't beet yourself up to quickly just follow the charts your not doing so badly.
-
 1
1
-
-
8 minutes ago, TrendFollower said:
When you are spread betting for example then shorting is no different to going long as you are betting on the price movements in either direction up or down. Now if you apply for example trend following principles to any trading decision then it really should not matter.
I agree that traders should be very careful when thinking about shorting as it is high risk and if they cannot make money on the 'long' side then do they have the right strategy to make money on the short side? The article is just an opinion of the writer but I would encourage anyone trading to consider going both long or short depending on the price action and trend.
A trader wants to make money regardless of how the general market or asset they are following is trending. They want to profit from markets trending up and down. Sideways markets are the ones to avoid as they tie up your capital and you are not making much returns during this period.
In many ways I agree and I do use both longs and shorts, however there is a time to trade long and a time to trade short. With equities they are bullish most of the time and inexperienced trader short a share just because it is high, this is very dangerous and they are well advised to look for a low to buy as apposed to looking for a high to sell. I posted that link because I feel several new traders here are loosing money because they don't realise how dangerous it is to short a share compared to being long on quality stock.
-
Why You Should Never Short Sell Shares.
https://www.marketwatch.com/story/why-you-should-never-short-sell-stocks-2015-11-19
Everybody should read this before they short sell. 👿
-
1
-
-
32 minutes ago, dmedin said:
I've also had one of those days where I realize how futile and pointless all of this is.
Take heed from the pros and experts who quit day trading and make their money from selling courses, books, seminars, training etc. If even the 'best' get out of day trading hell as soon as they can, what does that mean for those unfortunate punters still trying to make it work for them?
Don't get so down on yourself, follow your picks up and down don't just look for a quick short, if a share price trend turns up go long in fact long is safest with shares because unless you get yourself a Northern Rock or something the price will come back sooner or later but that is not true about a short. 👿
-
1
-
-
3 hours ago, dmedin said:

Indices are almost as difficult to trade as forex. Ugh I feel so stupid.
The DAX and the FTSE are pushed and pulled by wall st. and today it's not clear what will happen. Because wall st. pulled back over night today's move on the DAX & FTSE have been nervous.

-
1 hour ago, dmedin said:
@Foxy
Yes, I'm still holding on for dear life.
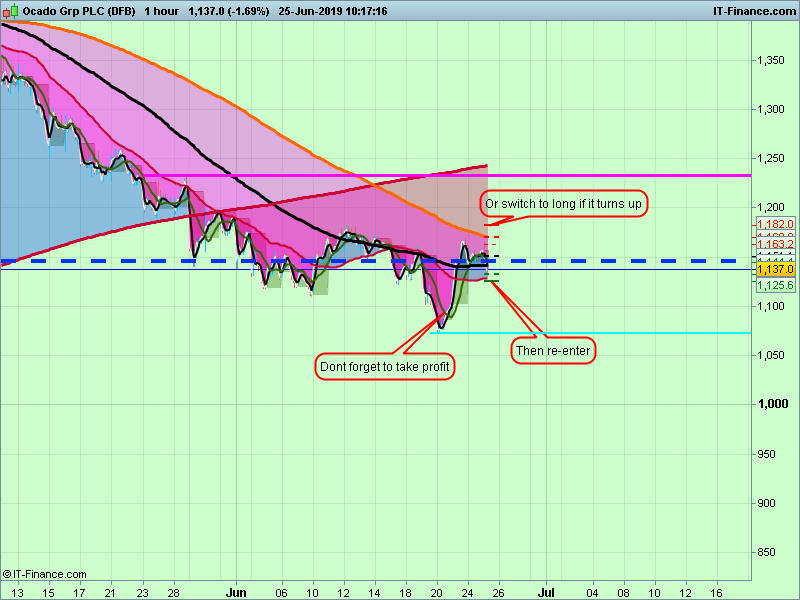
(Also still holding on to Ocado.)
Chart for Ocado!!
-
1
-
-
-
1
-
-
4 minutes ago, dmedin said:
It's the in-built ProRealTime one.
")
I didn't even know they had one, must take a look. 👿
-
1
-
-
18 minutes ago, dmedin said:
Looks like we are building up for a second assault on 602 - 603. 🙈
The point of this chart is simple you sell highs in the Red/Pink and you buy lows in the Blue. Because you entered so late you will have to decide if you want to hold but it's still a sell the high type of market for now.

-
1
-
-
11 minutes ago, Foxy said:
That spike looks like a stop hunt, there will be a lot of stops around 600 to 605. Watch-out for a bounce before it breaks support but a stop hunt can be a signal for the next leg down. 👿
Maybe I should point out, if it's not a stop hunt it may signal a reversal so be sure to watch for that bounce don't be afraid to close out if you don't like what you see. 👿
-
1
-
-
That spike looks like a stop hunt, there will be a lot of stops around 600 to 605. Watch-out for a bounce before it breaks support but a stop hunt can be a signal for the next leg down. 👿
-
1
-


US OIL
in General Trading Strategy Discussion
Posted
@FFS_Daytrader
Sorry I thought you were implying a short target @ $55.73. I was taught that horizontal support is King so if $56 is broken then a short to $54.40 looks good.