

Provaton
-
Posts
153 -
Joined
-
Last visited
-
Days Won
10
Content Type
Profiles
Forums
Blogs
Events
Community Tutorials
Store
Everything posted by Provaton
-
I don't think I would be using him as a source of "facts": https://en.wikipedia.org/wiki/Sucharit_Bhakdi
-
From: https://www.ons.gov.uk/peoplepopulationandcommunity/birthsdeathsandmarriages/deaths/bulletins/deathsregisteredweeklyinenglandandwalesprovisional/weekending25december2020 The point I was making was that there is a huge increase in excess deaths this year. This, for me anyway, is the most important statistic. As I have pointed out several times, due to improvements in treatments, demographics etc. there is bound to be a difference in how cases feed into ICU beds and deaths. Me? I just keep pointing out where your analysis is faulty and you just keep ignoring it!
-
https://www.theguardian.com/world/2021/jan/08/sadiq-khan-declares-covid-emergency-in-london Hospital statistics show that, between 30 December and 6 January, the number of Covid patients in the capital increased by 27%, with those on ventilators rising 42%. The current number in hospital due to Covid, 7,034 people, is 35% higher than at the peak in April. The London ambulance service is taking up to 8,000 emergency calls a day, compared with 5,500 on a normally busy day. Speaking alongside the prime minister at a Downing Street press conference on Thursday, Simon Stevens, the chief executive of NHS England, said hospitals in London were receiving 800 Covid patients a day, the equivalent of the entire capacity of St Thomas’,one of the capital’s flagship hospitals.
-
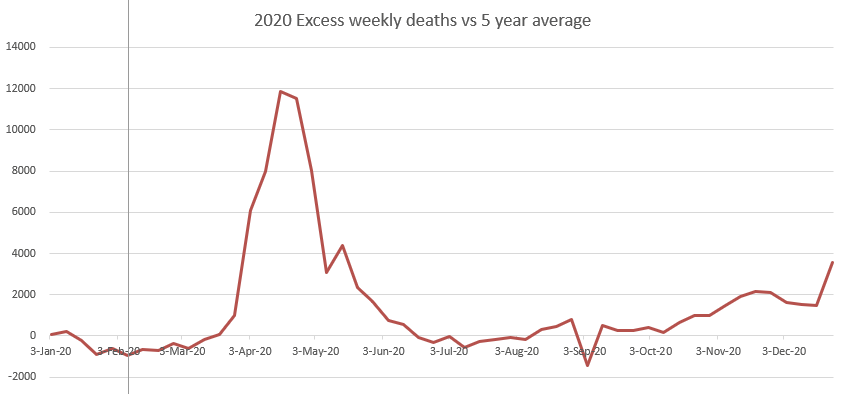
All cause deaths have been above average since September and are heading in only one direction: Source: https://www.ons.gov.uk/peoplepopulationandcommunity/birthsdeathsandmarriages/deaths/datasets/weeklyprovisionalfiguresondeathsregisteredinenglandandwales

-
Improved treatments as we better understand the virus, changing demographics, hospital facilities/capacity etc. WILL have an impact on the proportion of cases>ICU>Death. I remember reading this in the FT back in October: https://www.ft.com/content/11113534-9531-4fab-ba2c-039644134e70 Your own data source shows ICU beds occupied (dark blue column) increasing throughout December/January:

-
Just as well that we have 20% more ICU beds in 2020 than 2019. Current national occupancy is at 80.57% according to you link. Many Trusts at capacity (for ICU):

-
This is the latest weekly all-cause excess deaths data: Source: https://www.ons.gov.uk/peoplepopulationandcommunity/birthsdeathsandmarriages/deaths/datasets/weeklyprovisionalfiguresondeathsregisteredinenglandandwales Not necessarily, for several reasons. The medical profession now understands much more about COVID compared to the early days back in Mar/Apr. There are more effective treatments available so the relationship between cases/ICU/deaths will change over time. It also depends on the demographics, younger people now account for a higher proportion of cases and are therefore less likely to end up in ICU and die. Again, all these stats do not account for those that have "recovered" but are still suffering from the long term affects of COVID.

-
What???? The charts I posted show ICU occupancy above average for winter. The article from the Health Service Journal warns we are approaching a critical point with respect to ICU beds. Numerous reports from frontline staff report the same, the government (ministers, medical advisors, chief medical officer etc) are warning the same, and anecdotally I hear the same from a doctor relative in the NW. Are all these people wrong and you are right? We are on track for 70,000+ excess deaths for 2020: 2020 Total so far: 604,045 Average previous 5 years: 531,129 Source: https://www.ons.gov.uk/peoplepopulationandcommunity/birthsdeathsandmarriages/deaths/bulletins/deathsregisteredweeklyinenglandandwalesprovisional/weekending25december2020 Again, all these stats and charts do not account for the "recovered", many of whom are still suffering. I don't understand what it takes to prove to you that we are in the middle of a global pandemic and health crisis?
-
Yes, that "moron" John Burn-Murdoch at the FT. 10 years working in data journalism and an MSc in Data Science. No, one of them is showing that there are 4x the number of ICU admissions compared to previous winters. Patients either die or recover and the bed can be re-used. The other is showing ICU beds in use average 700 in London over the winter, currently that number is over 1000. I'm not sure why you are so keen to downplay what is going on. There are countless stats, reports from inside hospitals, etc. all saying that things are dire. Here's one example describing the critical situation in London: https://www.hsj.co.uk/acute-care/exclusive-london-will-be-overwhelmed-by-covid-in-a-fortnight-says-leaked-nhs-england-briefing/7029264.article?storyCode=7029264
-
Adjusted for population, the gray lines are previous winters. And here are ICU occupied beds for London: You can view loads more charts and data collated by John Burn-Murdoch at the FT (@jburnmurdoch). What none of the statistics/charts show are the people who have "recovered" from COVID but are still suffering affects months afterwards. I know of one person, in their 30s, previously fit and healthy who now stuggles to walk up a flight of stairs. Another was a keen singer who since COVID (again "recovered" months ago) struggles to get enough breath to sing. Anybody who claims it's "just the flu" frankly has no idea what they are talking about.


-
That is not how it works, you don't post some random chart/theory and then expect somebody else to try to prove if it's true or false. I've tried looking online (ONS, gov.uk websites, WHO, John Hopkins etc.) and can't find the source data for the charts you recently posted. You've been posting to this thread for months now and as soon as somebody asks for sources (real sources, links to government/medical websites) you go on the attack without providing those sources. If I was a moderator at IG I would take down this thread.
-
That doesn't help, I want to see the original official source i.e. web address and check it for myself. We all need to be transparent on where the data we quote comes from. Anybody can knock up a chart in Excel and post it on the internet....
-
And the official source for this chart?
-
Do you have an official source for this? I'd like to investigate further.
-
Again, this is very misleading. The 2020 number is not complete. The latest number is 604,045 so well above previous years. Source: https://www.ons.gov.uk/peoplepopulationandcommunity/birthsdeathsandmarriages/deaths/datasets/weeklyprovisionalfiguresondeathsregisteredinenglandandwales
-
My point was that case numbers are feeding into hospital admissions. I have no idea whether hospital (NOT A&E) admissions are above or below seasonal averages - I can't find the official data. I then criticised your ICU chart which you never really responded to. It is very misleading. I then show ONS charts that demonstrate a clear above trend increase in deaths (above 5 year averages) and you just respond with some chart from an app and some chart about 999 calls. We are going round in circles....
-
These are the ONS figures. How are they in line with previous years? (note below, the last week is misleading due to public holidays): But the chart is misleading as I have already stated. I didn't draw any conclusions, I was just showing that increasing cases are leading to more hospital (not necessarily A&E) admissions.
-
I never suggested that hospitals or ICUs were being overwhelmed. Firstly, I pointed out that you were wrong to say that the increase in cases was not leading to an increase in hospital admissions. Then I pointed out that your chart for ICU capacity was highly misleading. You don't seem to be reading carefully any of my responses and are just ignoring any feedback on any of your data/charts. I think I will back away from this thread as it is obviously your personal outlet for anything COVID related that suits your agenda.
-
That's very misleading as there are 20% more ICU beds in 2020 than 2019 (see footnote on your chart). We also don't know how many beds were available in 2017 or 2018. It's comparing one day in 2020 versus the monthly average for the past 3 years. This is one of the worst charts I have ever seen and believe me I've seen a lot!
-
Can you post the source for this? I can't find any official data on general hospital admissions versus historic.
-
I was simply pointing out that your previous post was wrong. You claimed that rising cases were not being reflected in hospital admissions. They clearly are, just not via A&E.
-
This is just admissions via A&E. Most hospital admissions do not come via A&E. In the same report COVID-19 admissions towards end of Dec. via A&E are approx. 300 per day https://assets.publishing.service.gov.uk/government/uploads/system/uploads/attachment_data/file/948470/EDSSSBulletin2020wk52.pdf However, overall hospital admission for COVID-19 around the same time are around 3000 per day: https://coronavirus.data.gov.uk/details/healthcare Therefore A&E admissions are accounting for only 10% of COVID-19 total hospital admissions. It is incorrect to say that case increase is not being reflected in hospital admissions (COVID-19 hospital admissions below): Source: https://coronavirus.data.gov.uk/details/healthcare

-
This is worth a read, from an intensive care doctor in London:
-
The UK case mortality rate is 3.3%, so a survival rate of 96.7% not 99.97%, a huge difference: https://coronavirus.jhu.edu/data/mortality
-
That's odd, everything I've read about the PCR test says it is highly accurate, for example here is MIT Medical: https://medical.mit.edu/faqs/faq-testing-covid-19 Mate, I've no idea what your background is or where you find these strange websites but most of the stuff you post is either completely wrong or very misleading.


