Jump to content

Canadian Dollar Jumps on Energy Gains Ahead of OPEC+. Will USD/CAD Break Lower?


MongiIG

467 views

CANADIAN DOLLAR, USD/CAD, OPEC+, EVERGRANDE - TALKING POINTS

  • The Canadian Dollar has been supported by higher commodity prices
  • APAC equities, except ASX 200, went lower as Evergrande risks swirl
  • High energy prices boost commodity currencies. Will USD/CAD go lower?

Key USDCAD Fundamental Drivers You Should Keep an Eye


Asian equities were mostly softer today, despite a strong lead from the US on Friday. Uncertainties around Evergrande, OPEC+ and high energy price impacts appeared to weigh on investors’ minds. Mainland China are on holidays for Golden Week.

The US session was buoyed by upbeat data. Personal spending, PCE core deflator, University of Michigan consumer sentiment, as well as manufacturing PMI and ISM numbers were all slightly better than expected.

Evergrande shares went into a trading halt in Hong Kong as a major transaction announcement is expected. The perception is that the company will be selling an asset in order to raise desperately needed funds. The US$260 Jumbo Fortune Enterprise debt note guaranteed by Evergrande that matured on Sunday, has not been repaid. Unlike the coupons on Evergrande’s debt, there is only a five-day window for non-payment of the principal amount, due to administrative or technical problems.

The Australian and Canadian Dollars had a positive start to the week with commodity gains continuing to support them. Natural gas prices remain near 7-year highs and crude oil holds onto Friday’s gains ahead of the OPEC+ meeting today. The focus will be on the expected increase of 400,000 barrels per day of production.

Coffee rallied toward multi-year highs on bad weather in Brazil and Columbia.

The New Zealand Dollar softened as lockdowns were extended and the RBNZ meeting on Wednesday may not be as hawkish as the market had been expecting.

Looking ahead, there is US factory orders and the RBA meet tomorrow.

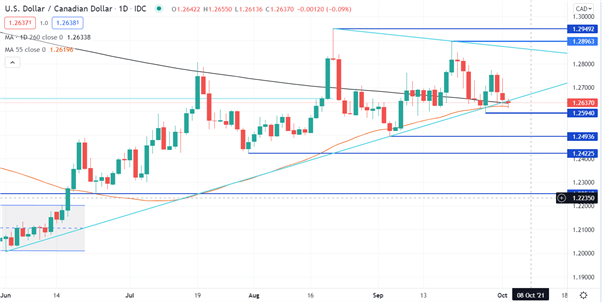
USD/CAD TECHNICAL ANALYSIS

USD/CAD has broken below an ascending trend line and is near the recent low of 1.2594. That level might provide support initially but a move below there could see bearish momentum.

The 55-day simple moving average (SMA) is currently 1.26197 and the 260-day SMA is at 1.26338, just below the spot price. A decisive move below those SMAs might be bearish.

The previous lows of 1.24936 and 1.24225, as well as a pivot point at 1.22518 may provide support. On the topside, possible resistance could be at the previous highs of 1.27746, 1.28963 and 1.29492.

USD/CAD CHART

Chart created in TradingView

Written by Daniel McCarthy, Strategist for DailyFX.com. 4th October 2021

0 Comments


Recommended Comments

There are no comments to display.

Create an account or sign in to comment

You need to be a member in order to leave a comment

Create an account

Sign up for a new account in our community. It's easy!

Register a new account

Sign in

Already have an account? Sign in here.

Sign In Now
  • Blog Statistics

    • Total Blogs
      3
    • Total Entries
      2,822
  • Latest Forum Topics

  • Our picks

    • International Workers' Day & Early May Trading Hours
      Please be advised that our opening hours will be adjusted on 1 May 2024 for International Workers’ Day and 6 May 2024 for the UK Early May Bank Holiday. Where appropriate, the times listed are in GMT.
        • Like
    • Are these the best AI stocks to watch in May 2024?
      Microsoft, Apple, Nvidia, Amazon and Meta could be the best AI stocks to watch next month. These stocks are the largest AI stocks in the US based on market capitalisation.
    • Natural Gas Commodity Elliottwave Technical Analysis
      Natural Gas


      Mode - Impulsive 


      Structure - Impulse Wave 


      Position - Wave (iii) of 5


      Direction - Wave (iii) of 5 still in play


      Details:  Price now in wave iii as it attempts to breach 1.65 wave i low. Wave (iii) is still expected to extend lower in an impulse.


      Natural Gas is currently breaching the previous April low, marking a decisive move as the impulse initiated on 5th March continues its downward trajectory, further extending the overarching impulse wave sequence that commenced back in August 2022. This decline is anticipated to persist as long as the price remains below the critical resistance level of 2.012.


      Zooming in on the daily chart, we observe the medium-term impulse wave originating from August 2022, which is persisting in its downward trend after completing its 4th wave - delineated as primary wave 4 in blue (circled) - at 3.666 in October 2023. Presently, the 5th wave, identified as primary blue wave 5, is underway, manifesting as an impulse at the intermediate degree in red. It is envisaged that the price will breach the February 2024 low of 1.533 as wave 5 of (3) seeks culmination before an anticipated rebound in wave (4). This confluence of price movements underscores the bearish sentiment prevailing over Natural Gas in the medium term.


      Analyzing the H4 chart, we initiated the impulse wave count for wave (3) from the level of 2.012, which marks the termination point of wave 4. Notably, price action formed a 1-2-1-2 structure, with confirmation established at 1.65 and invalidation set at 2.012. The confirmation of our anticipated direction materialized as price breached the 1.65 mark, signifying a resumption of bearish momentum. Presently, there appears to be minimal resistance hindering the bears, thereby reinstating their dominance in the market. It is projected that wave iii of (iii) of 5 will manifest around 1.43, indicative of the potential for the wave 5 low to extend to 1.3 or even lower. This comprehensive analysis underscores the prevailing bearish outlook for Natural Gas in the immediate future.


      Technical Analyst : Sanmi Adeagbo
       
        • Like
×
×
  • Create New...
us