Alibaba Q4 earnings: will the Chinese tech giant’s share price keep falling?
The Chinese tech behemoth has been on a rollercoaster all through the course of 2021.
When to expect the earnings report
Alibaba Group Holding Limited is estimated to report earnings on 1 February for the fiscal fourth quarter (Q4) ending in December 2021.
What to expect?
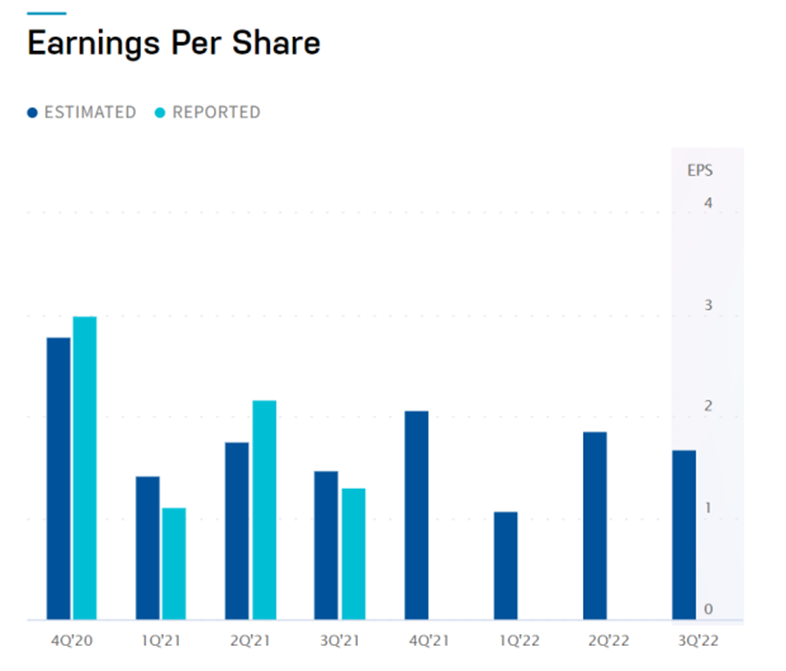
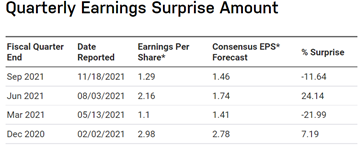
According to Zacks Investment Research, based on three analysts' forecasts, the consensus earnings per share (EPS) forecast for the quarter is $2.05. The reported EPS for the same quarter last year was $2.98.
 Source: Nasdaq.com
 Source: Nasdaq.com
Alibaba share price review
The Chinese tech behemoth has been on a rollercoaster all through the course of 2021 after the Chinese government began a series of industry-wide clampdowns starting in April 2021.
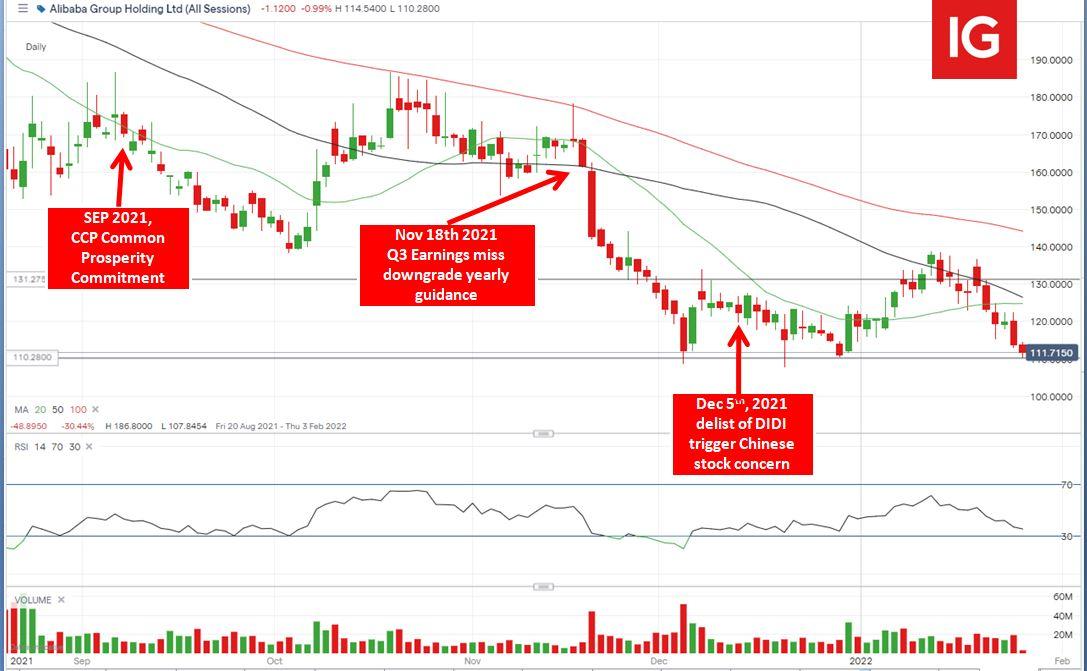
Since then, the price of BABA has skydived from $225 to close at $118 on December 31st, nearing a 50% loss. During the same period the S&P 500’s yearly return was 37% while the Nasdaq gained 21.4%.
A big miss in third quarter (Q3) earnings and the delisting of DIDI were another two key events which affected the online retail giant recently. Alibaba experienced one of its worst days following Q3 earnings in November with a jaw-dropping 11% intraday drop.
The company’s long-term profitability became the most significant concern for its shareholders as the margin on its most profitable sector (commerce) decreased from 35% in the quarter ending 30 September 2020 to 19% a year later.
 Source: IG charts
Too cheap to be ignored?
BABA's current valuation is only about 16x PE with a 20% growth rate, thus the PEG ratio is less than 1. In other words, the current price for BABA is already on the "Boxing day sale".
Charlie Munger, a long-term partner of Warren Buffet, doubled his stake in Alibaba first in Q3 2021 and again in Q4. The move seemingly serves as a great example of the half-century investment legend's famous quote: "When a great company gets into temporary trouble, we want to buy them when they're on the operating table."
However, if investors are looking to follow Mr Munger's path, the keyword is "temporary trouble". Despite the considerable challenges (i.e. inflation, supply chain, and tightening monetary policy) that many US tech companies continue to face, China's online conglomerate certainly has a longer list of "troubles".
The Chinese government's fast-changing policy, the slowing down of the Chinese economy, and the trade battle between the US and China may see Alibaba follow its peer DiDi's delisting path. It's not safe to call any of them "temporary".
Technical analysis
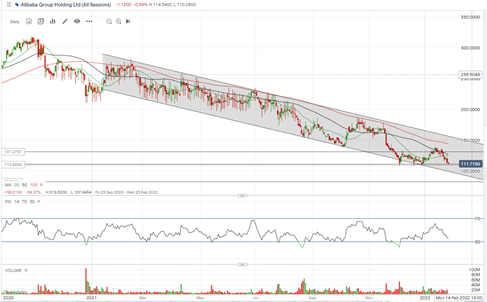
Based on the daily chart, BABA’s share price has been skewing to the downside trajectory formed since early 2021. Current support can be found at $111, the level back to September 2016. A break through this level will send the price as low as $88.
On the other hand, the 20 day moving average at around $124 will be the crucial resistance for the price to fight for if BABA looks to re-challenge the high this year at $131. The RSI indicator, from the weekly chart, shows the descending of the highs and supports a mid- term bear view.
Daily Chart
 Source: ProRealTime
Weekly Chart
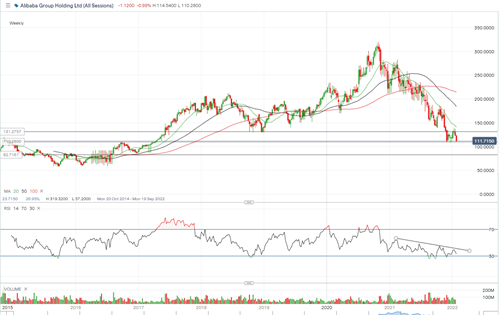 Source: ProRealTime


.jpeg.98f0cfe51803b4af23bc6b06b29ba6ff.jpeg)
0 Comments
Recommended Comments
There are no comments to display.
Create an account or sign in to comment
You need to be a member in order to leave a comment
Create an account
Sign up for a new account in our community. It's easy!
Register a new accountSign in
Already have an account? Sign in here.
Sign In Now