AUD/USD moves sideways on hotter than expected US PPI

Entry posted by MongiIG in Market News
411 views
Producer prices in the US increased 1% for the month.
 Source: Bloomberg
U.S. producer prices increased 1% for the month, and at 9.7% on an annualised basis, beating forecasts and delivering the biggest jump in eight months, another sign that high inflation could persist and a rate hike is right around the corner.
AUD/USD
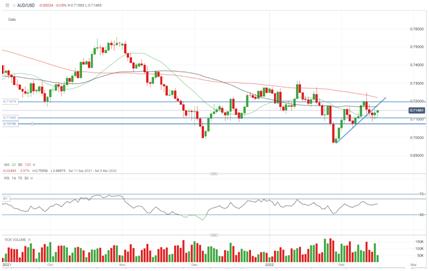
Pressured by the strength of the greenback, AUD/USD has moved sideways from its upward trendline previously supported by the resurgence of the iron ore price.
Slipping lower to start this week, the price now sits directly between the 20-day and 50-day simple moving averages (SMA) as the former provides great support at the moment.
If the price fades lower to breach current support, the next support can be found at 0.7074, the lowest point in February. Alternatively, long buyers could expect the pair to climb back towards the past trendline—which now acts as resistance and coincides with the 50-day SMA.
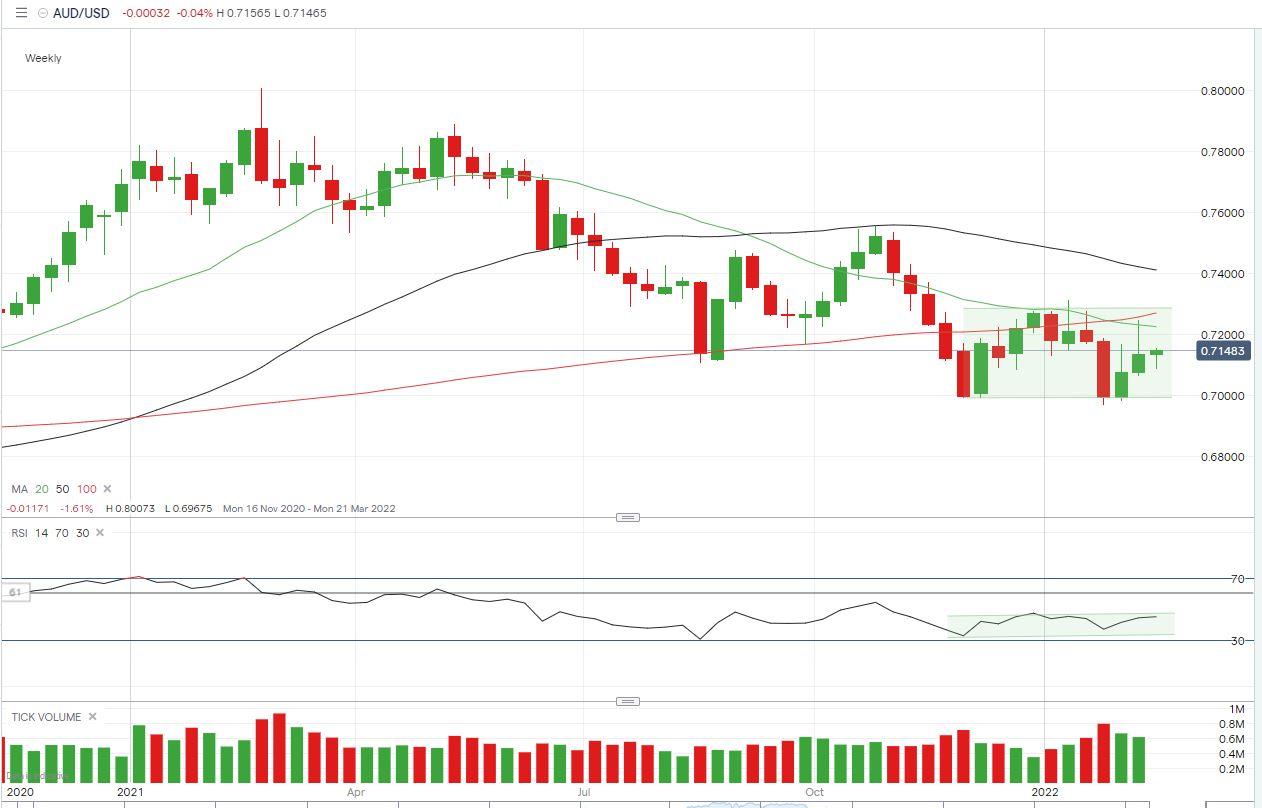
The conjunction of both lines will be a crucial level for the currency pair to fight for if it aims for the next target at 0.72. The weekly chart shows that the pair has been hovering around the slim band ranging from 0.7000 to 0.7286 since the end of November.
As such, the RSI indicator has been glued to below 50 territories, suggesting that the market momentum for this pair is subdued at the moment.
 Source: ProRealTime
 Source: ProRealTime
USD/JPY
The greenback continues to perform strongly against the yen, although the safe haven currency has been supported by uplifting economic rebound.
Japan reported the first estimate for its fourth quarter (Q4) gross domestic product (GDP) growth at 5.4% on an annualised basis, up from -2.7% in the prior quarter.
The rollback in Covid restrictions is believed to be the key driver for the island country’s economic recovery, which is expected to be on track for the upcoming months.
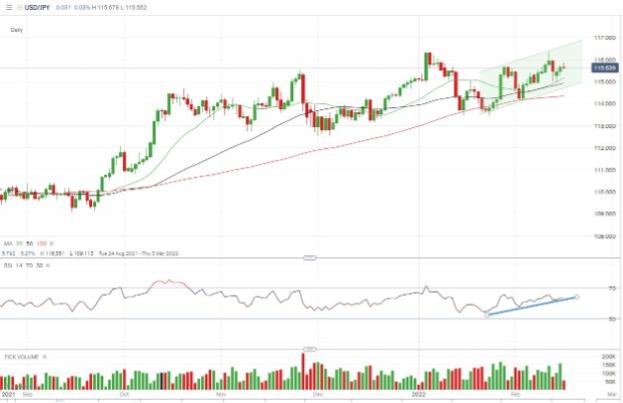
From a technical point of view, the price has been skewed to the ascending moving tunnel formed since the end of January. The current position, well above the 20-, 50-, and 100-day moving averages, shows the lead of bull buyers.
In addition, a clear up-pointing RSI trendline supports the view of a rosy outlook for the pair. Current support sits at 115.445, while the recent high at 115.952 should be the imminent resistance to watch.
 Source: ProRealTime


.jpg.92373c4439028b13d282696016d124e4.jpg)


0 Comments
Recommended Comments
There are no comments to display.
Create an account or sign in to comment
You need to be a member in order to leave a comment
Create an account
Sign up for a new account in our community. It's easy!
Register a new accountSign in
Already have an account? Sign in here.
Sign In Now