Where next for Target shares after worst plunge since 1987 crash?

Entry posted by ArvinIG in Analyst article
1,052 views
Target’s 25% share price fall, the worst one-day decline since 1987’s Black Monday, dragged other retailers down and hit the broader market.

Source: Bloomberg
Target widely misses estimates
The US behemoth retailer Target widely missed analyst estimates as a surge in costs squeezed margins in the first quarter (Q1).
When the company cut its profit forecast it triggered the sharpest one-day decline in its share price since the Black Monday 1987 crash.
Target’s supply chain constraints, rapidly rising fuel, and freight costs in Q1 amid a shift in consumer shopping habits which led to a sharp slowdown in apparel and home goods sales, led the company to mark down bloated inventories and lower its forward guidance.
The retailer stated that it would have to spend $1 billion more on freight in 2022 than it expected to at the start of the year as widespread Covid lockdowns in China created congestion at Asian sea ports, and rising petrol prices have driven up the cost of trucking.
Added to that, Target ordered too many bulky home goods which US consumers bought less of, and which are especially costly to ship and store because of their size and weight, forcing the company to rent additional warehouse space in the tightest warehouse market on record to store its excess inventory before selling it off at highly discounted prices to free up storage space.
All of the above led to Target’s net income dropping by 52% in the first quarter of 2022 compared to the same period in 2021 and a near 25% drop in its share price on Wednesday.
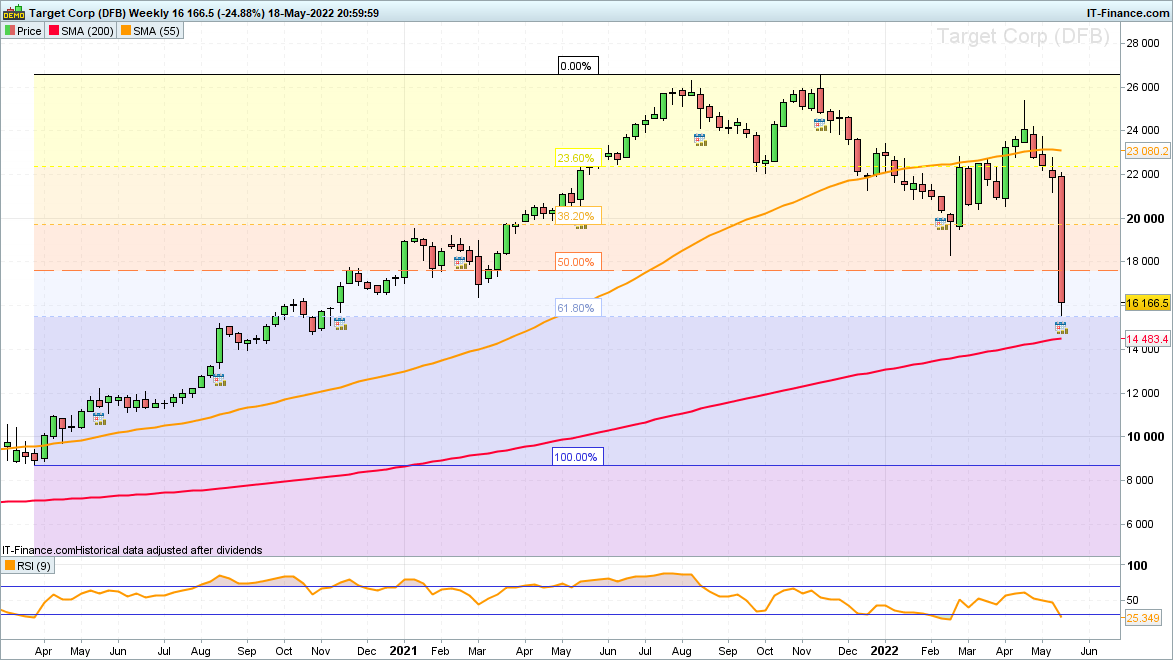
Where to next for Target’s share price?
Year-to-date the Target share price has declined by 30%, the majority of which yesterday, with it falling to the 61.8% Fibonacci retracement of the 2020-2022 bull market at $155.22 before consolidating in the short-term.
Source: ProRealTime
Over the next few days this year’s decline is expected to continue with the August 2020 high at $152 representing the first downside target, followed by the October 2020 low and the 200-week simple moving average (SMA) at $146.90 to $144.83. In this area the share price may find support.
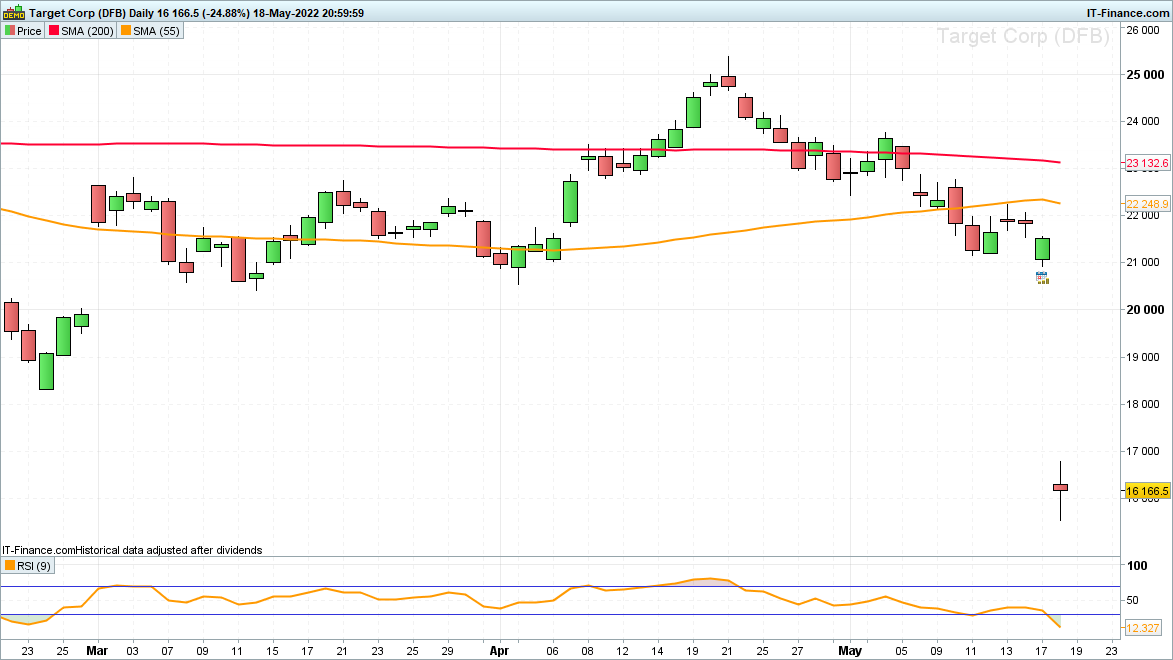
On the daily chart a huge gap has been formed between Tuesday’s low at $209.27 and yesterday’s high at $167.77 which is not expected to get filled for several months at the very least.
Source: ProRealTime
In case of the share price stabilising in the short-term, the 50% retracement of the advance from the March 2020 pandemic low and the November 2020 high at $176.40 to $177.43 may act as initial resistance.
If not, the next higher February low at $183.07 is likely to be more solid resistance and is expected to cap, if reached at all.
Axel Rudolph | Market Analyst, London
19 May 2022


.jpeg.98f0cfe51803b4af23bc6b06b29ba6ff.jpeg)


0 Comments
Recommended Comments
There are no comments to display.
Create an account or sign in to comment
You need to be a member in order to leave a comment
Create an account
Sign up for a new account in our community. It's easy!
Register a new accountSign in
Already have an account? Sign in here.
Sign In Now