Netflix’s share price: what to expect from Q2 results

Entry posted by ArvinIG in Analyst article
355 views
Find out what to expect from Netflix’s earnings results, how they will affect Netflix share price, and how to trade Netflix’s earnings.
Source: Bloomberg
When is Netflix’s results date?
Tuesday, July 19th, after the market close, is when traders and investors can get their hands on the streaming giant’s second-quarter earnings results.
Netflix share price: forecasts from Q2 results
Given it’s the first of the FAANG (Facebook, Apple, Amazon, Netflix, and Google) to release its figures, it tends to be a closely watched event with implications not just for other streamers that got caught in its lower spiral following its first-quarter earnings release, but for other growth and tech-related companies.
Few can forget last quarter's readings when Netflix suffered a shock loss in subscribers for the first time in over a decade. Subscription levels were down 200K which meant Netflix missed out on revenue while bested on earnings last time around, and unlike Disney and some of the other streamers that have a more diversified product offering, it’s usually all down to subscribers for Netflix.
The expectation for the second quarter has been for another loss in subscribers by as much as 2 million, despite new seasons of popular titles that tend to entice both fresh and previous users to its platform. Analysts’ forecasts are for earnings per share (EPS) reading of $2.96 for the first quarter that’s lower than what we saw for the same quarter last year. That estimate has been little changed over the past two months and as for revenue, Netflix is hoping for over $8 billion.
The numbers will be factored in for a fresh P/E (price-to-earnings) reading but based on current figures, Netflix put its valuation at far better levels compared to its historic average. Due to the plummet in price, strategic considerations will carry plenty of weight as investors and traders digest where it’ll be able to extract more growth and revenue.
That includes how Netflix can tap into 'well over half of the world’s broadband homes' that have yet to pay for it and there are also the potential updates on gaming given the time spent by Generation Z and Millennials on other items like user-created videos, gaming, and music. This is as more regions globally (China aside) have adopted ‘living with the virus’ as opposed to lockdowns that forced them to spend more time glued to a screen.
That, combined with intense competition at a time when households across the globe are suffering from rising costs, has meant multiple streaming sources in a single home have gone from the norm during the pandemic to more of an exception. Any updates on its pricing model (especially as it remains the pricier option), the extent to which it will include an ad version, how they’ll go about account sharing to boost users, as well as any possible synergies following reports last month of a possible buyout or merger ideally directed at cutting costs will no doubt noted.
Netflix is expected to be more measured in terms of chasing further growth in what is the latest theme even if it’s no small streamer limited to a smaller war chest, as any gains in subscribers from these levels could be more artificial than natural depending on how they shift their model. Netflix cited 'sluggish economic growth, increasing inflation, geopolitical events' last time around, and it’s fair to say all three are on a worse footing today compared to a few months back.
Overall, it’s a majority buy rating with few daring to go into the ‘underperform’ and ‘sell’ categories, with a decent amount going for ‘strong buy’. It gets interesting with the price target, as although the average amongst them dropped from over $500 back in April when prices were around $350, the target has since dropped to below $300, and once more is still well above the current market price of below $180
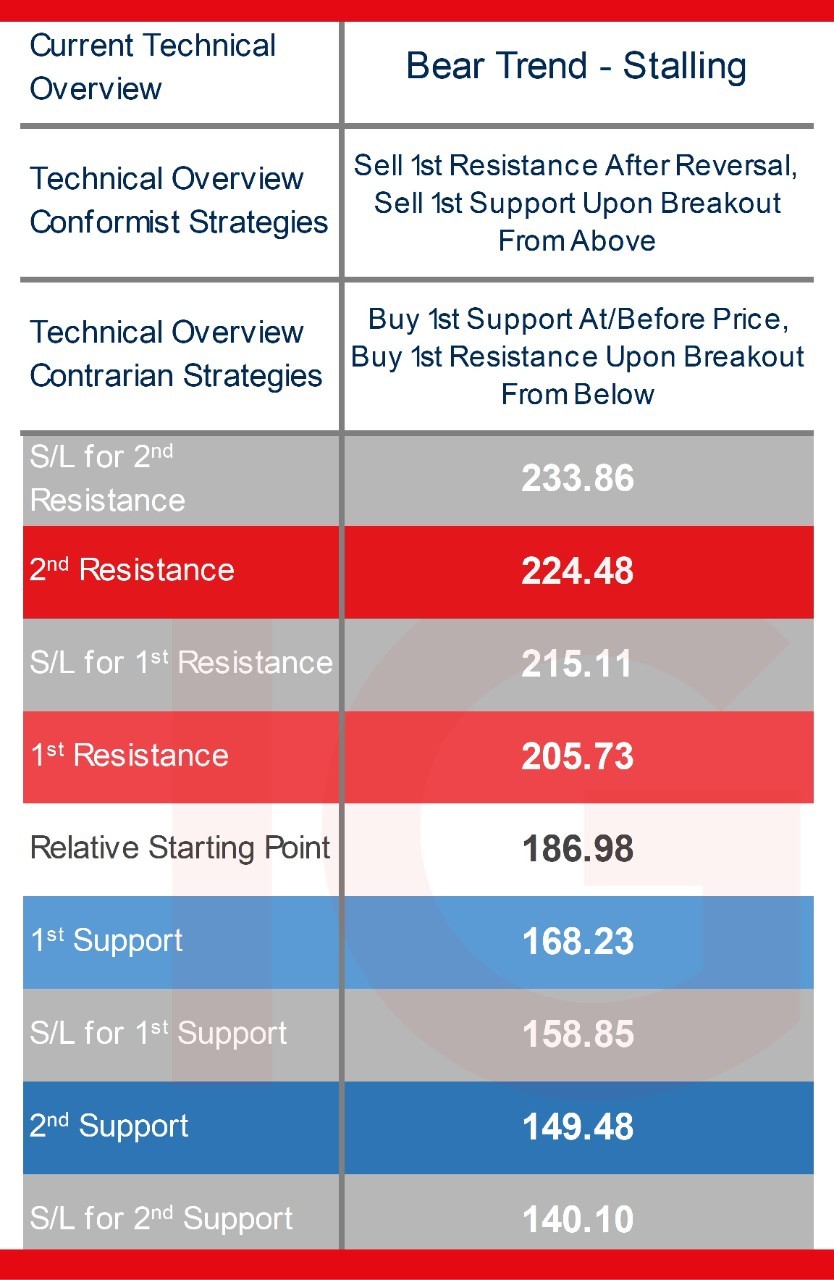
Trading Netflix’s Q2 results: weekly technical overview and trading strategies
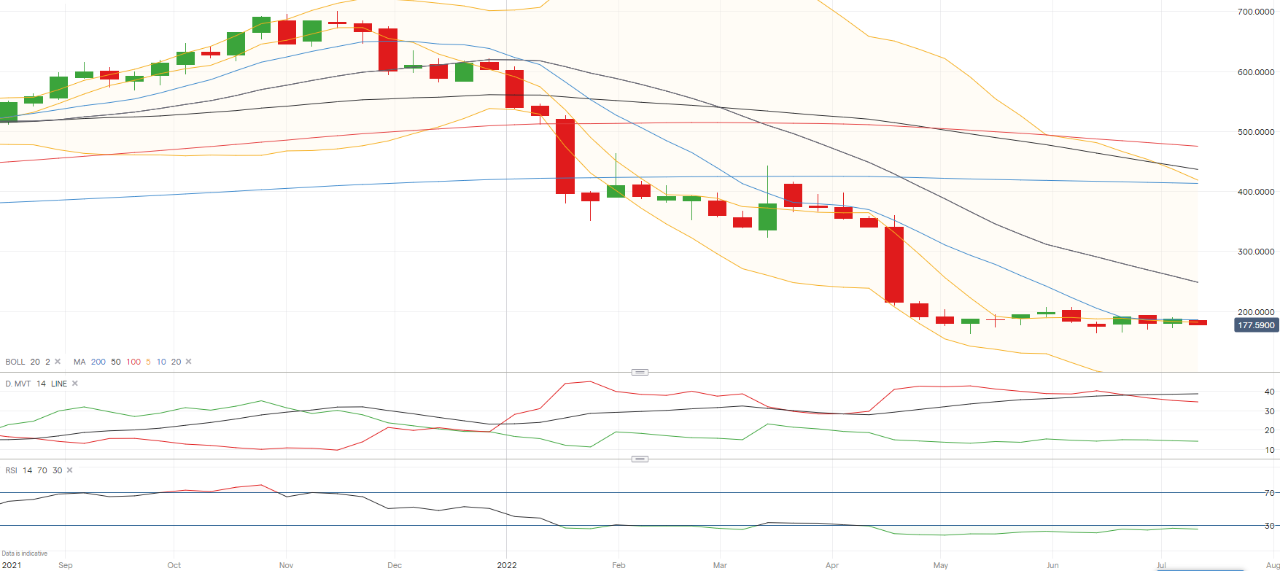
Although earnings are about the fundamental aspect of the company, a glance at the technicals and its difficulty to extract anything but negatives, especially when viewing it from a longer-term time frame. Prices are beneath all its main long-term weekly moving averages, with an RSI (Relative Strength Index) still in oversold territory. DMI (Directional Movement Index) shows a decent enough margin of the DI- over the DI+, and an ADX (Average Directional Movement Index) well in trending territory.
The oscillations since May have meant zooming into the daily time frame paints a more consolidatory picture, with price roughly in the middle of the band, shorter-term moving averages huddled close to each other and price, an ADX reading out of trending territory, and an unclear margin for the DI- over the DI+ usually classifying its DMI as neutral.
In all, when it comes to the weekly time frame, and the technical overview is a stalling bear trend in terms of classification, the ‘stalling’ is due to oscillations over the past ten weeks or so that have failed to truly offer a play for both conformist and contrarian strategies.
That could change when doused with a major fundamental event like next Tuesday’s, especially as traders, market-makers, and investors will remember the double-digit percentage drops in January and April and will be eyeing a move well past levels formulated on more recent price action, making it more breakout vs. reversal.
Source: IG
Netflix weekly chart with key technical indicators
Source: IG
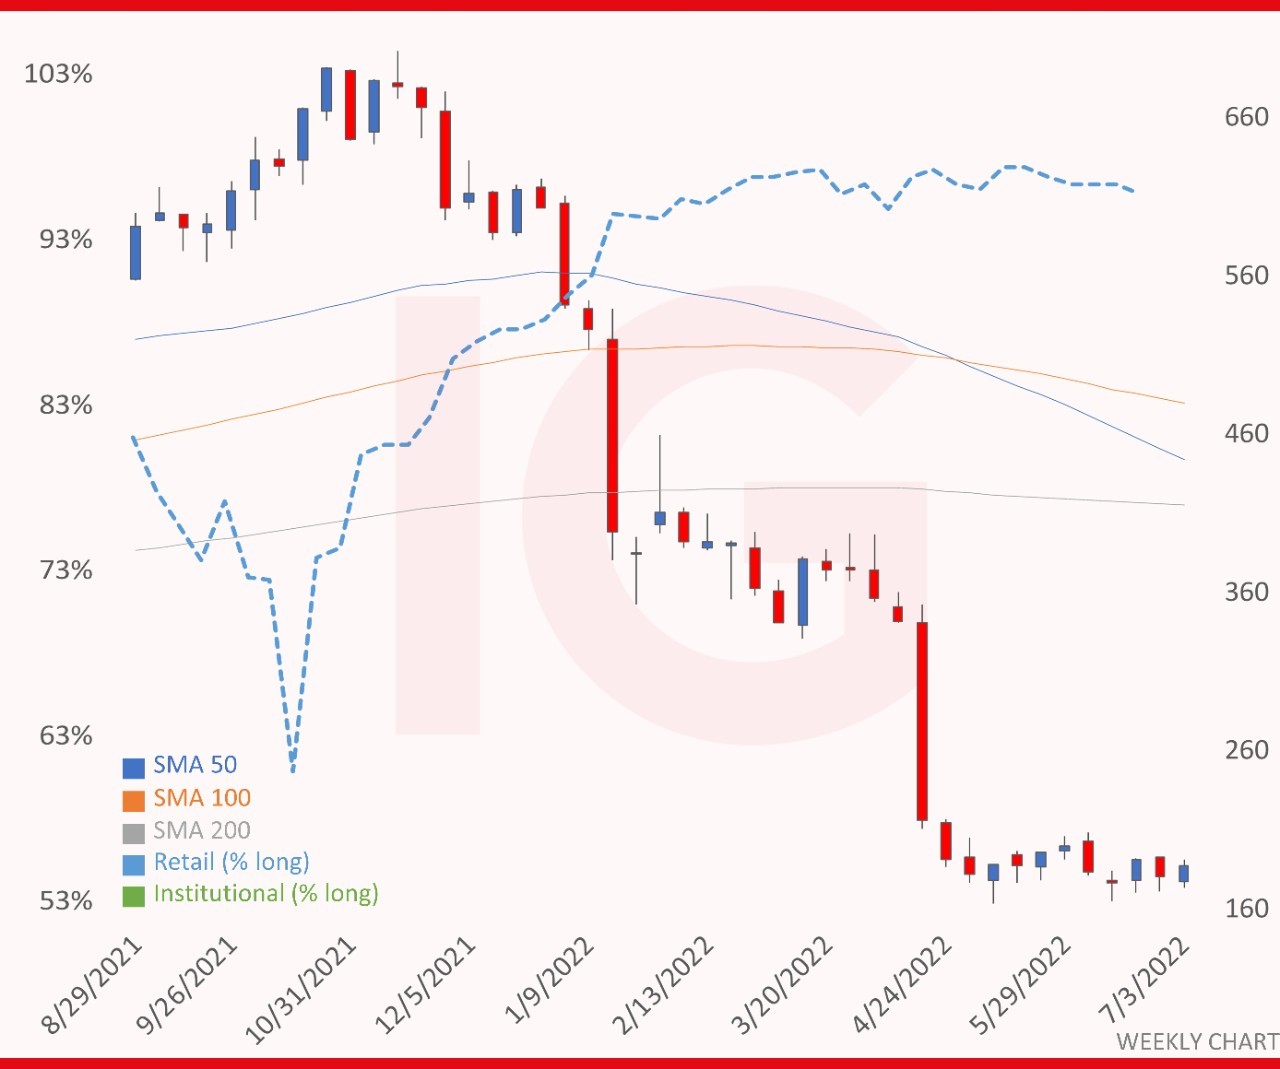
Netflix weekly chart with IG Client sentiment*
Source: IG
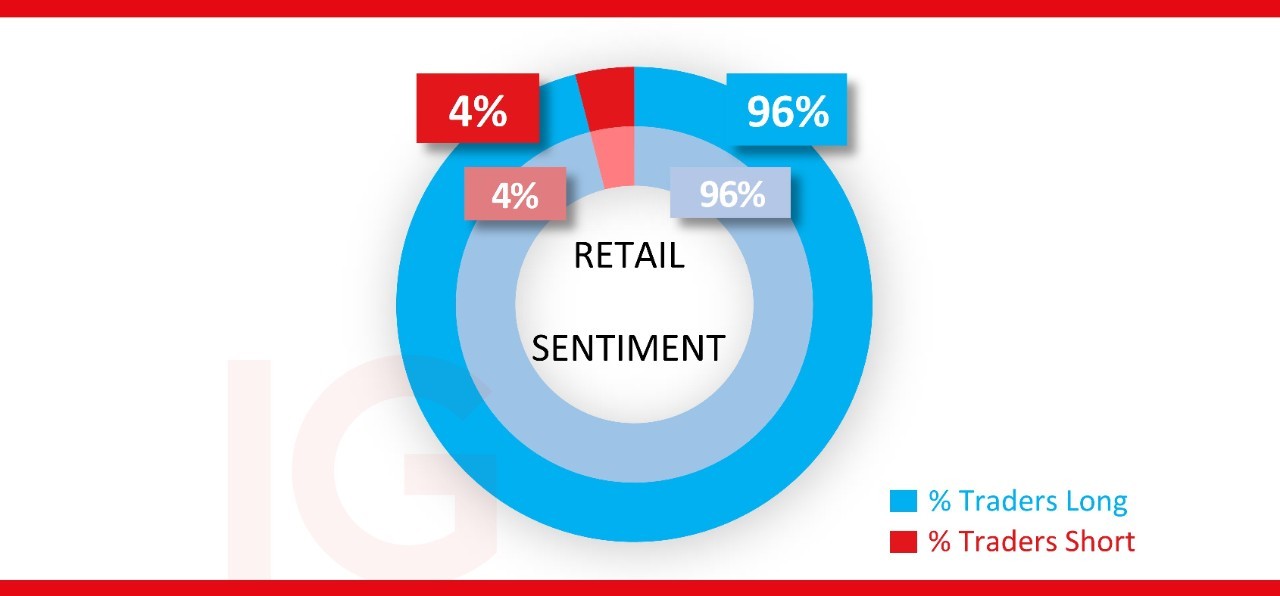
IG Client sentiment* and short interest for Netflix shares
It’s been heavy to extreme buy bias amongst retail traders for months now (blue dotted line in the chart above as % long i.e., 93% means 93% majority buy). And it has remained in extreme buy territory throughout this period, with the latest reading at 96% as of this morning.
As for sentiment on the exchange, shorts have been emboldened by the recent plummet in its price, with over 11.8m shares shorted representing 2.78% of the total number of shares floating larger than the 2.21% when our first-quarter earnings preview was released back in April.
Source: IG
*The percentage of IG client accounts with positions in this market that are currently long or short. Calculated to the nearest 1%, as of the start of the week for the outer circle, and the start of last week for the inner circle.
Monte Safieddine | Market analyst, Dubai
13 July 2022


.jpeg.98f0cfe51803b4af23bc6b06b29ba6ff.jpeg)


0 Comments
Recommended Comments
There are no comments to display.
Create an account or sign in to comment
You need to be a member in order to leave a comment
Create an account
Sign up for a new account in our community. It's easy!
Register a new accountSign in
Already have an account? Sign in here.
Sign In Now