Hang Seng and Taiwan Index: markets suffer as US-China tension rise

Entry posted by MongiIG in Market News
576 views
The dispute between China and Taiwan has long been standing and the escalated tension ahead of Pelosi’s visit saw the Hang Seng and Taiwan index tumble.
 Source: Bloomberg
As the geopolitical dispute between China and Taiwan escalated, the tension provided a worrying backdrop that saw risk markets slide across the Asia-Pacific region.
Hang Seng
Hong Kong's Hang Seng Index opened in the red for the new week and lost more than 2.5% on Tuesday alone.
Two events are being viewed as negative catalysts, dragging the market down. As August begins, Hong Kong reported on Monday a worse-than-expected Q2 GDP. Hong Kong's economy contracted by 1.4% compared to the expectation of only a 0.3 decline. As the global financial hub struggled to recover after its worst virus outbreak, the market continued to slide into further decline on Tuesday as US House Speaker Nancy Pelosi visits Taiwan.
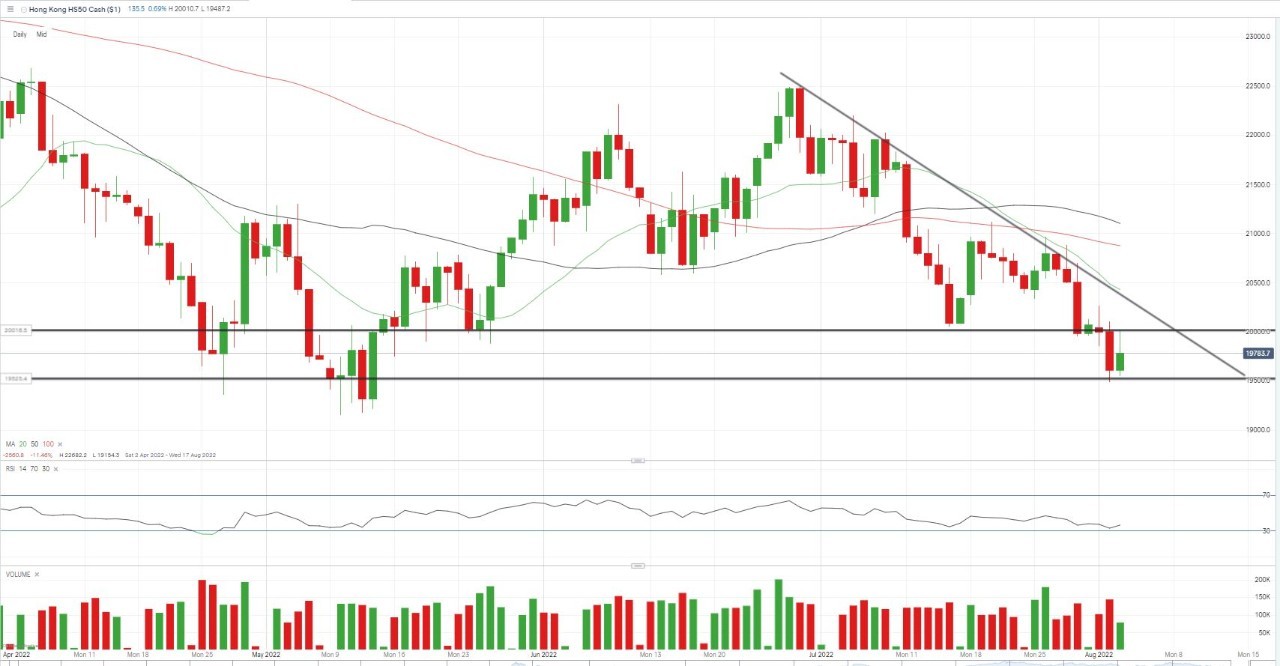
According to the daily chart, it looks like the index has unquestionably scrolled back from the July high. Despite Wednesday's recovery, the downturn momentum for the past two weeks remained valid and solid, suggesting a further move toward the May low could be at play if the price can't hold on above the current support at 19525.4.
The July low and the psychological level around 20000 are likely to act as resistance.
Hang Seng daily chart
 Source: IG
Taiwan Index
Nancy Pelosi became the highest-ranking American politician to visit Taiwan in 25 years, prompting China to announce economic retaliation and an unprecedented range of actions against the self-ruled island.
As a result, the TAIEX plunged more than 200 points on Tuesday as worries over cross-strait tensions escalated and uncertainty soared. The Taiwan index was one of the best performers in 2021, rising more than 20%. However, the market has been under great pressure this year and has erased all gains from the past seven months.
The tension with China has been the elephant in the room for Taiwan over the decades.
In 1996, the leader of Taiwan, Lee Teng-hui accepted an invitation from US Cornell University to deliver a speech on 'Taiwan's Democratization Experience'. This event triggered the 'Third Taiwan Strait Crisis' which lasted from July 1995 to March 1996. During that time, the Taiwan Index fell 36%.
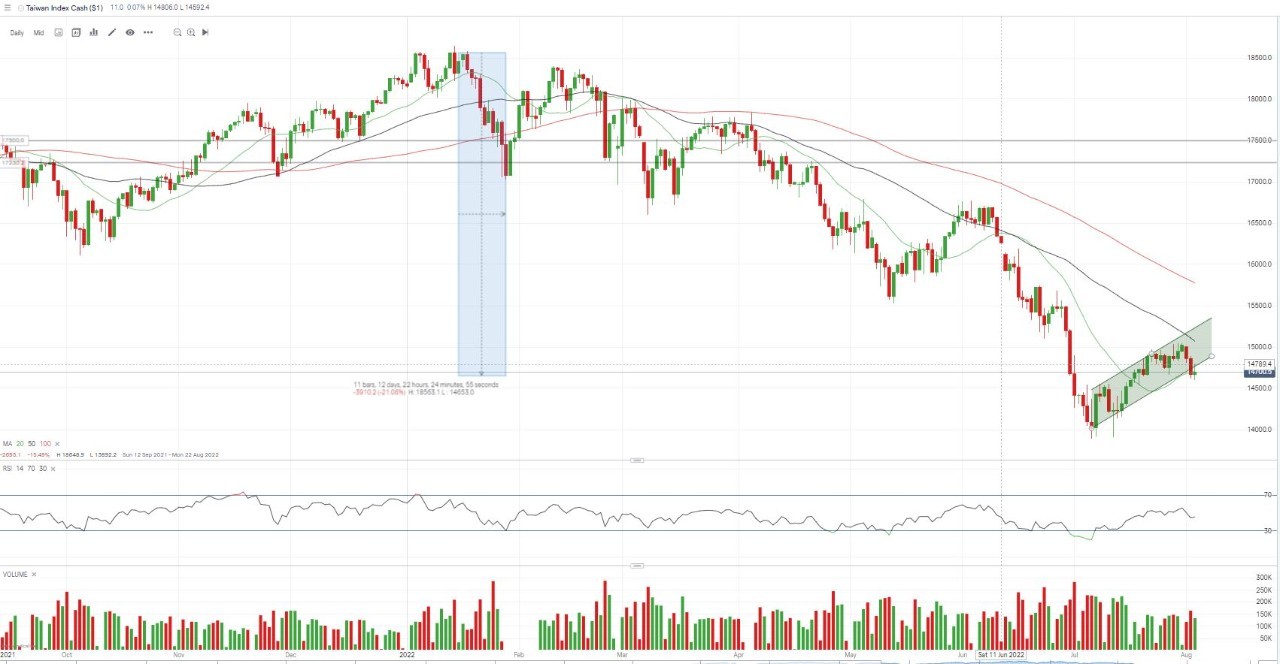
Looking at today's movement, the decline this week has accelerated the downtrend for the index to fall out of the ascending trajectory from early July. Next support can be found at 14260. Failure there would open the floor to the bottom of the year at 14000. Major resistance comes from the boundary of the previous moving tunnel at 14800.
Taiwan Index daily chart
 Source: IG


.jpeg.98f0cfe51803b4af23bc6b06b29ba6ff.jpeg)

0 Comments
Recommended Comments
There are no comments to display.
Create an account or sign in to comment
You need to be a member in order to leave a comment
Create an account
Sign up for a new account in our community. It's easy!
Register a new accountSign in
Already have an account? Sign in here.
Sign In Now