Improved risk sentiments drove fourth straight week of gains: Nasdaq 100, China A50, EUR/USD

Entry posted by ArvinIG in Analyst Article
784 views
The US equity markets delivered its fourth straight week of gains to end last week, with the rebound over the past month effectively recovering close to half of their bear market sell-off.

Source: Bloomberg
Market Recap
The US equity markets delivered its fourth straight week of gains to end last week, with the rebound over the past month effectively recovering close to half of their bear market sell-off. The easing-inflation narrative riding on the downside surprise in recent US inflation data remains the trigger in unwinding the extensive short positions that were built up over the course of the bear market. Market breath suggests near-term overextended levels, with the percentage of S&P 500 stocks above its 50-day moving average (MA) pushing way past one standard deviation above its five-year historical mean. This may drive some de-risking to take place as we edge closer to the Jackson Hole Symposium next week. Although there was a retracement in the previous three instances where market breadth was at this level, the retracements on those occasions were to mark a new higher low for another subsequent up-move higher.
To end last week, the sole economic data to note was the August reading for the University of Michigan (UoM) consumer sentiment index, with its outperformance (55.1 versus 52.5 consensus) providing a more optimistic take on economic conditions and another catalyst for risk sentiments to ride on. The median expectation of inflation a year from now came in at 5%, its lowest since February this year. Economic conditions will run the risk of further moderation as the Federal Reserve (Fed) is likely to continue on its path of rate hikes, with market forecast for US inflation to remain elevated at 7.5% in quarter four (Q4). But until signs of cracks appear, market participants are shrugging it off and basking in the improved risk environment for now.
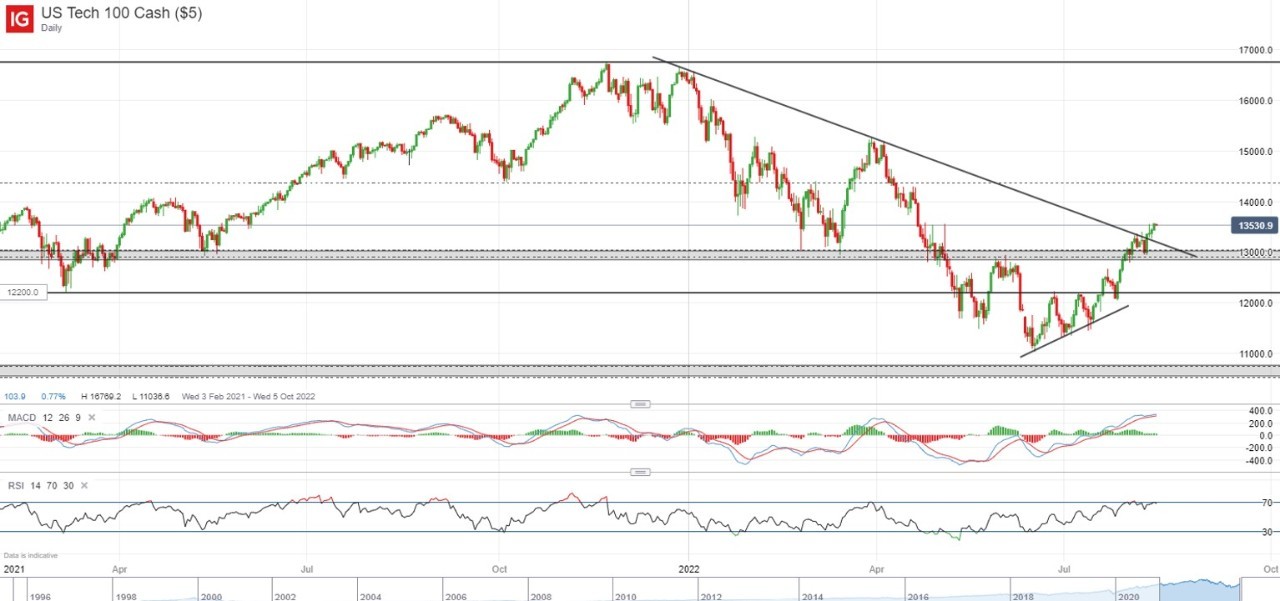
The US Tech 100 index continues to find support off its 12,900-13,000 region last week, which marked a confluence of key Fibonacci levels. A downward trendline since the start of the year has been overcome, with the short-lived retracement from the trendline resistance suggesting that equity bulls remain firmly in control. Next key resistance ahead for the index could be at the 14,000 level.
Source: IG
Asia Open
Asian stocks look set for a positive open, with Nikkei +0.62%, ASX +0.55% and NZX +1.03% at the time of writing. The South Korean market, KOSPI, is closed for holiday today. Tensions between US and China are on watch, with another visit of Taiwan by a delegation US lawmakers led by Senator Ed Markey. The USD/CNH saw fairly muted moves, suggesting that market participants may be shrugging it off as a non-event for now.
On the economic data front, Japan’s quarter two (Q2) gross domestic product (GDP) expanded 2.2% annualised, less than the 2.5% forecast. Nevertheless, it suggests that pent-up demand from Covid-19 reopening could continue to underpin growth ahead. Private consumption, which accounts for more than half of Japan’s GDP, rose 1.1%. While virus resurgences in quarter three (Q3) could dampen social activities, one may find relief that restrictions are not coming back in place, which should allow pent-up consumer demand to continue taking control into the summer holiday season.
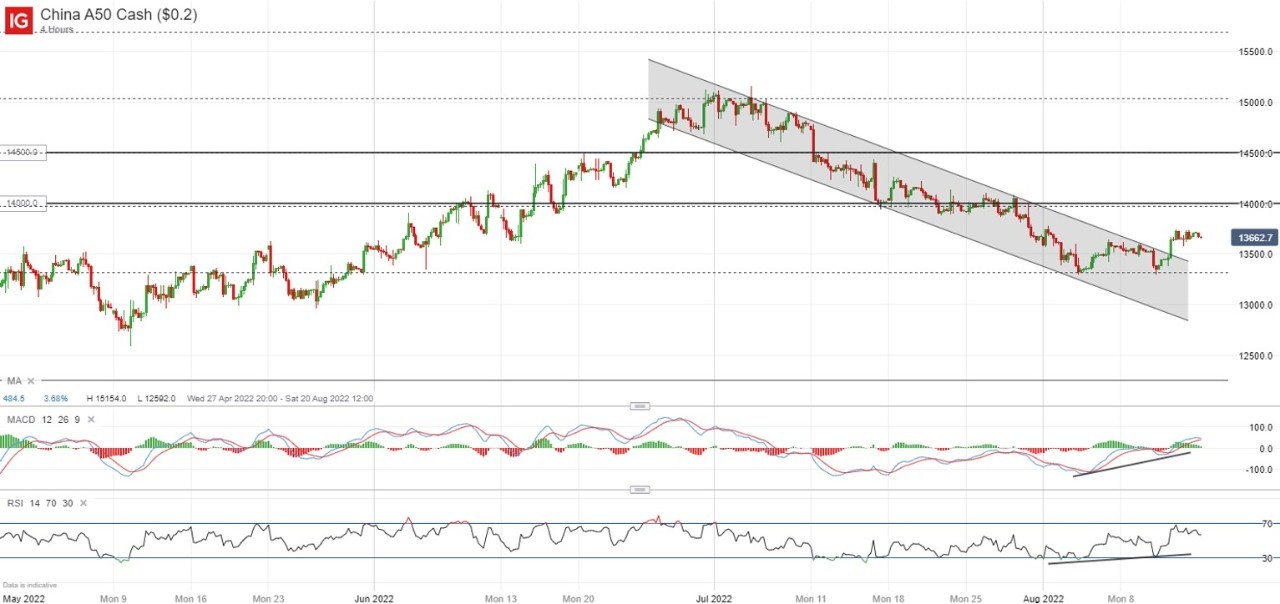
Over in China, new bank lending came in way less than expected in July while broad credit growth slowed, as Covid-19 restriction concerns and a deepening property crisis remain as obstacles in driving a more cautious borrowing environment. With seemingly no clear resolution in these headwinds anytime soon, credit growth could remain muted in the near term. The day ahead will provide further clues about China’s economic conditions with its release of July industrial production, retail sales and fixed asset investment. Current expectations are for all three indicators to trend higher year-on-year (YoY) from their June readings, but intermittent virus restrictions may pose downside risks to the figures. China stock indices have not been picking up over the past month, despite the bullish momentum in Wall Street. The S&P 500 is up close to 11% over the past month, while the CSI 300 and China A50 is down 1.4% and 3.8% respectively. On the four-hour chart, the China A50 index has broken above a descending channel pattern, along with a bullish divergence on its moving average convergence divergence (MACD). That said, market participants will want to see a more resilient picture for economic conditions in order to provide a more sustaining upside. Next level to watch may be at the 14,000 resistance.
Source: IG
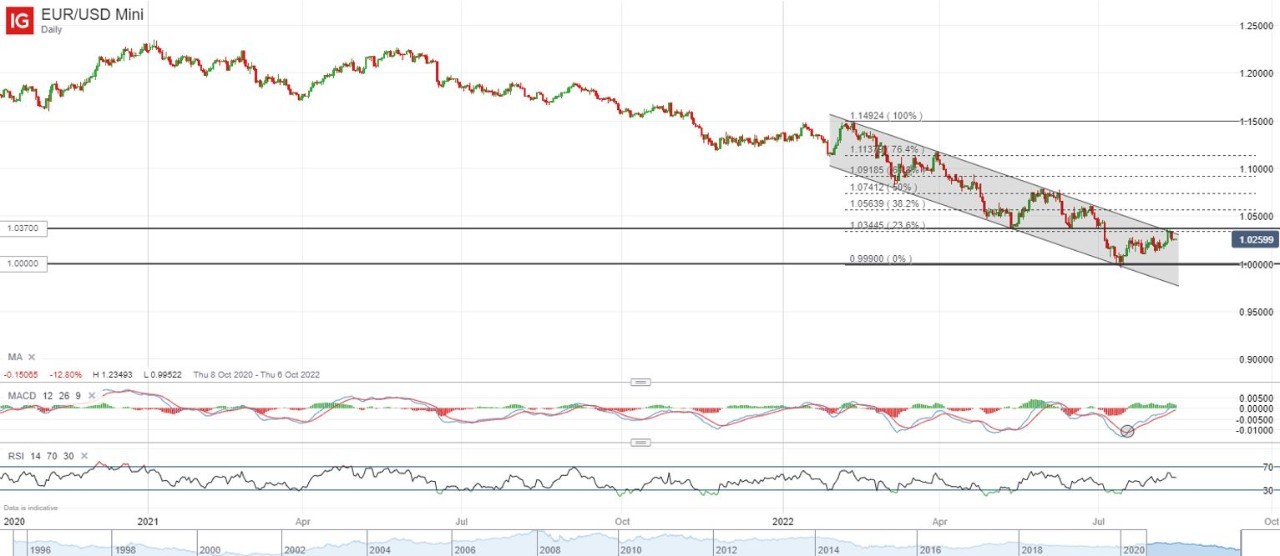
On the watchlist: EUR/USD hitting key upper channel trendline resistance
Recent US dollar weakness on the peak-inflation narrative has provided an uplift for various risk-sensitive dollar-crosses such as the EUR/USD but after coming in at its five-week high last week, an upper channel trendline resistance is currently in the way. Disruptions on the Rhine River shipping route due to low water levels are seeking to challenge the transport of fuel and other industrial goods for Western Europe, adding to the struggle in securing energy supplies triggered by the Ukraine-Russia tensions. The 1.037 level remains a key resistance to overcome near-term. Any failure to cross the level in the coming days may leave the descending channel intact and suggests a downward bias overall.
Source: IG
Friday: DJIA +1.27%; S&P 500 +1.73%; Nasdaq +2.09%, DAX +0.74%, FTSE +0.47%
Yeap Jun Rong | Market Strategist, Singapore
17 August 2022


.jpeg.98f0cfe51803b4af23bc6b06b29ba6ff.jpeg)


0 Comments
Recommended Comments
There are no comments to display.
Create an account or sign in to comment
You need to be a member in order to leave a comment
Create an account
Sign up for a new account in our community. It's easy!
Register a new accountSign in
Already have an account? Sign in here.
Sign In Now