American Airlines’ share price: Q1 2023 earnings preview

Entry posted by MongiIG in Market News
1,304 views
Despite robust air travel demand, American Airlines’ share price is still down 32% over the past one year. Can its Q1 earnings provide a positive surprise?
 Source: Bloomberg
When does American Airlines report earnings?
American Airlines is set to release its quarter one (Q1) financial results on 27 April 2023, before the market opens.
American Airlines’ earnings – what to expect
Recent update of its Q1 profit outlook came with disappointment, as the airline expects post-adjusted earnings per share (EPS) to come in between one and five cents. While this is higher than the previous forecast of near break-even, that guidance has underperformed the six cents expected by markets.
Refinitiv estimates suggest that revenue may continue to deliver with a 37.2% year-on-year growth, just a slight tick lower than the 39.9% growth in Q4 2022.
Travel demand and airline fares still resilient, but can it last?
A look at the US Transportation Security Administration (TSA) checkpoint numbers suggests that travel demand has remained robust in Q1 2023, particularly with an eye-catching recovery in February-March pushing back against speculations that travel demand has peaked. Some resilience seems to be reflected here, as though the restrictive rate environment has yet to feed into consumers’ desire to travel.
To top it off, after eight months of decline, US airline fares are also back on the move with a sturdy reversal in February 2023. The confluence of higher travel volume and higher airline fares could still serve as positive contributors to AAL’s upcoming 1Q results.
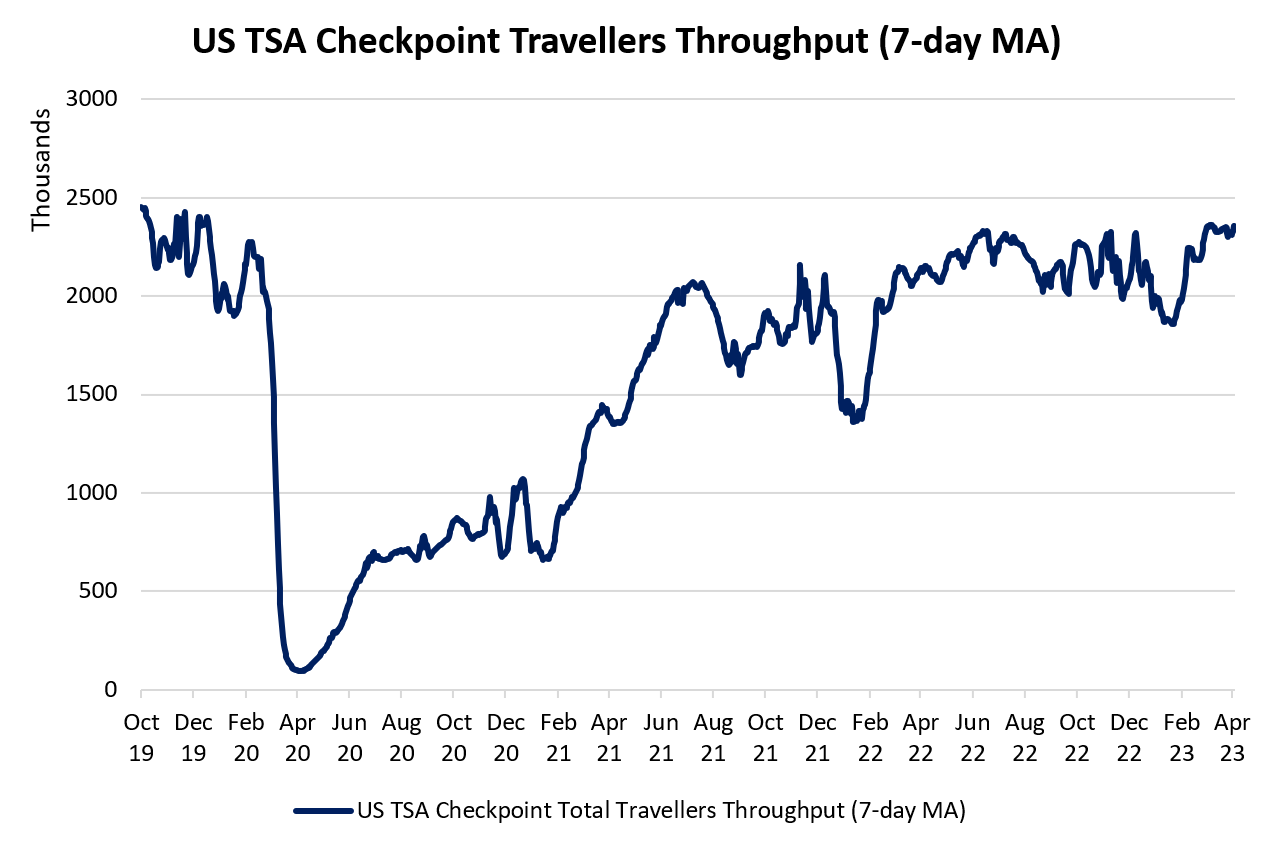 Source: Transportation Security Administration (TSA)
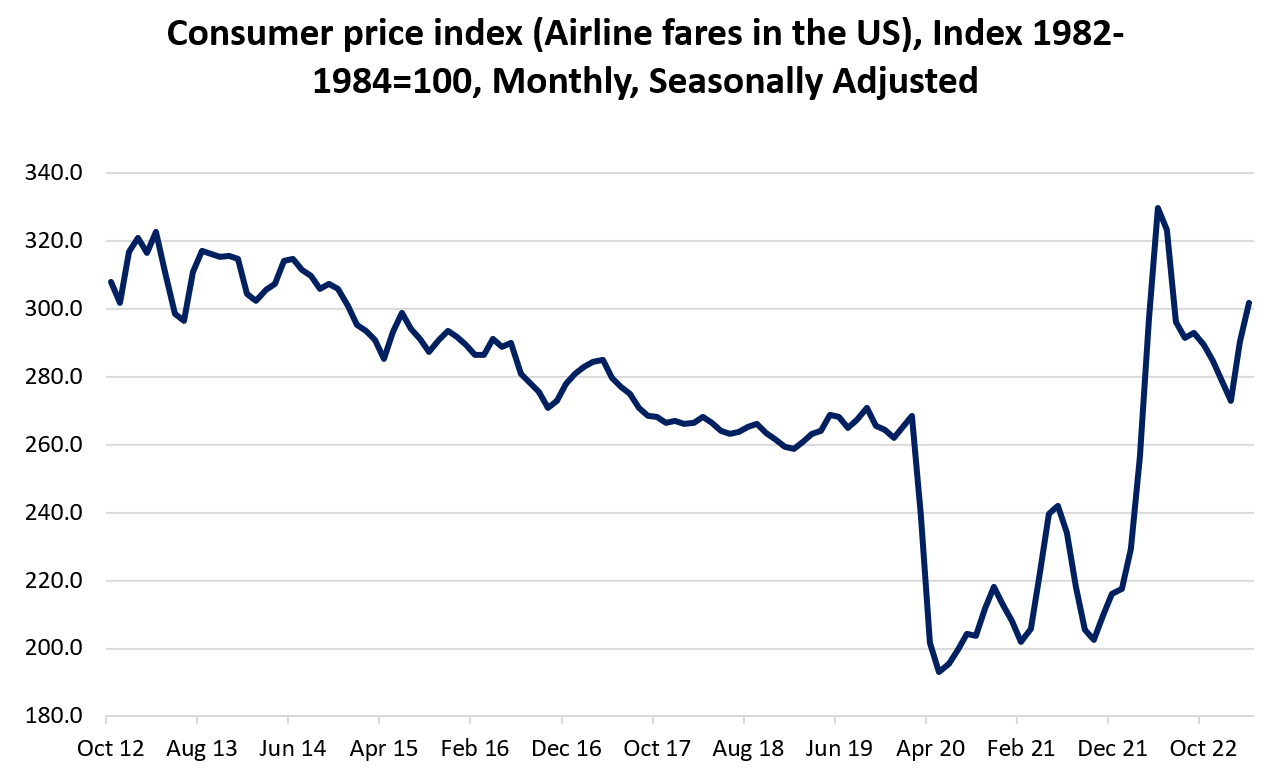 Source: U.S. Bureau of Labor Statistics
With 1Q 2023 guidance laid out, more focus could be on 2Q 2023 outlook
That said, the sustainability of consumer demand over the coming quarters will be the key focus, as discretionary travel spending is still at the mercy of weaker economic conditions. With the 1Q 2023 guidance laid out (and share price reacted accordingly with a 9.2% sell-off), market watchers will be looking for any positive surprises in terms of the 2Q outlook, especially when it marked the beginning of the summer travel season.
Based on Refinitiv estimates, the next two quarters are expected to see AAL’s quarterly revenue top out, so any pushback on that front will provide the much-needed reassurances for some relief.
Elevated costs remain the key challenges for earnings
From the company’s earlier guidance, persistently high fuel and labour costs continue to instil downside risks for earnings, offsetting some of the positive effects from resilient travel demand. Still-low unemployment rate and elevated job opening numbers continue to keep labour costs on a slow grind higher, while a surprise move to cut oil production by the Organization of the Petroleum Exporting Countries Plus (OPEC+) has a renewed lift for oil prices in March.
These will be earnings headwinds which the management will have to address and for now, it seems that elevated cost pressures will remain for longer while travel demand faces the risks of fizzling out ahead, which kept some investors shunning.
Technical analysis – Several resistance needs to be overcome to establish renewed uptrend
AAL’s share price seems to be trading within a longer-term descending triangle pattern, as intermittent attempts to rally thus far eventually failed to sustain. Several resistance will have to be overcome, in order to provide greater conviction of a renewed upward trend. This includes its key 200-day moving average (MA), along with the downward trendline resistance.
For now, a potential bullish divergence in moving average convergence/divergence (MACD) may point to some abating selling pressure, but any upside could still be a correction phase for a new leg lower. The US$12.00 level will be a key support to watch, having kept prices afloat on at least three occasions over the past year. A breakdown of the level could potentially pave the way to retest the US$10.60 level next.
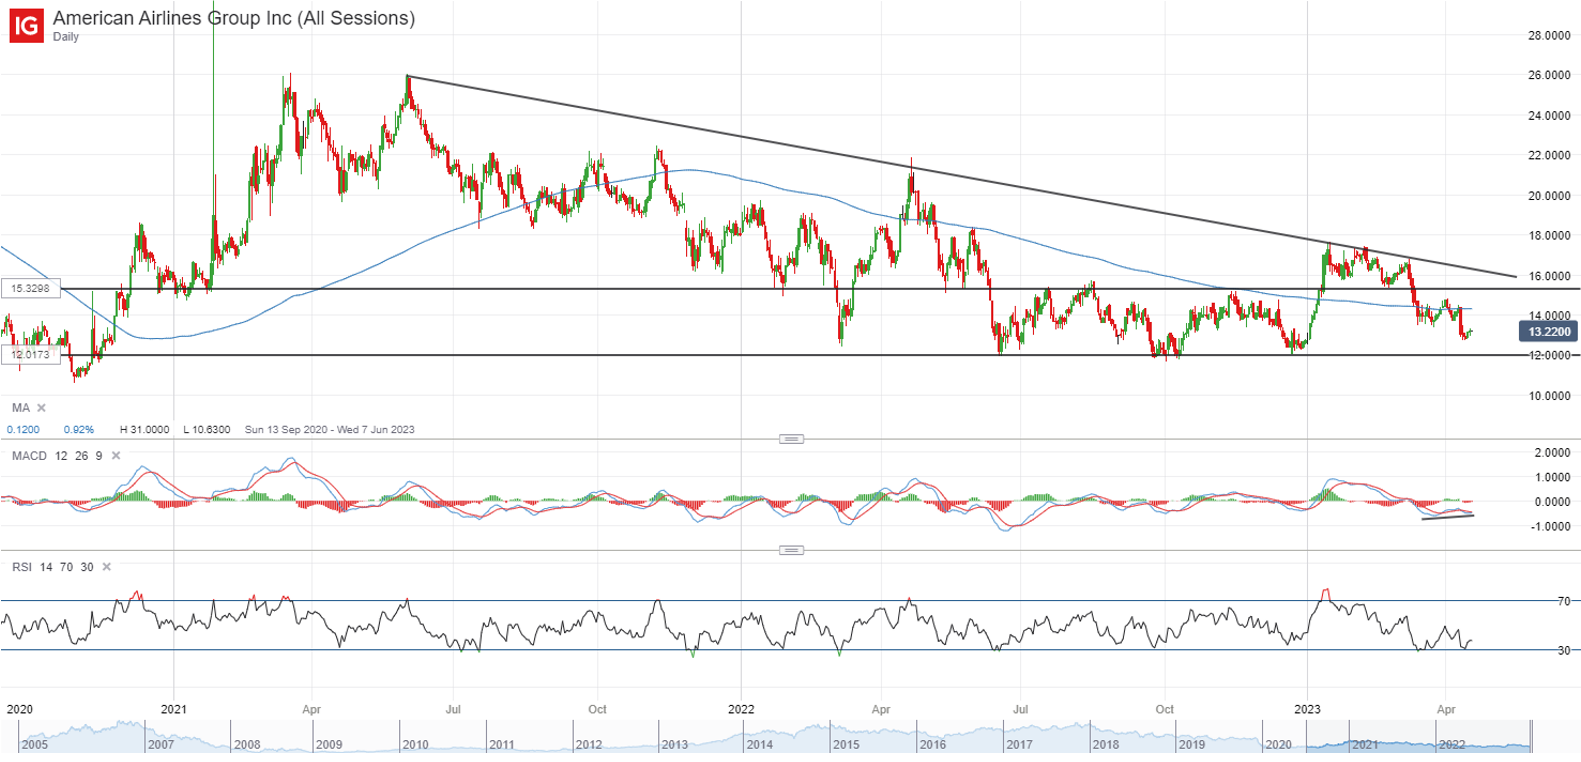 Source: IG charts


.jpeg.98f0cfe51803b4af23bc6b06b29ba6ff.jpeg)

0 Comments
Recommended Comments
There are no comments to display.
Create an account or sign in to comment
You need to be a member in order to leave a comment
Create an account
Sign up for a new account in our community. It's easy!
Register a new accountSign in
Already have an account? Sign in here.
Sign In Now