Subdued start to the week amid light calendar in the region: US dollar, Straits Times Index, Natural gas

Entry posted by MongiIG in Market News
291 views
Last Friday brought another downbeat session in Wall Street, with the S&P 500 adding to recent losses to close 1.4% lower for the week.
 Source: Bloomberg
Market Recap
Last Friday brought another downbeat session in Wall Street, with the S&P 500 adding to recent losses to close 1.4% lower for the week. Nevertheless, the index is still up 4% for the month. On the economic calendar, areas of weaknesses in the global economy continue to be presented with a series of lower-than-expected flash Purchasing Managers' Index (PMI) readings from major economies. Notably in the US, flash manufacturing PMI remains in contractionary territory (46.3 versus previous 48.4) while the services sector saw a moderation in growth (54.1 versus previous 54.9) for the first time in six months.
Ahead, market participants may be keeping an eye on any further developments around the mercenaries’ uprising in Russia but having chosen to stand down, the mercenaries have already given up their initial advantage of the surprise element in a rebellion, which reduces the chances of further escalation. The potential risks to watch may be on any renewed opposition from the Russian public to Putin’s leadership, especially with the Ukraine war being the agenda for the movement which has not been well-received by the public previously.
The week ahead will bring focus to China’s PMI readings as well, with market participants hoping to seek for any pockets of resilience in the China’s recovery story. The US core PCE price index will also be in focus. Three months of no-progress may explain the +0.3% upward revision in the Fed’s 2023 core PCE projections (3.9% versus 3.6% in March) at the latest FOMC meeting, therefore a softer inflation read will be looked upon to provide room for the Fed to deliver a prolonged pause in July.
The US dollar has been attempting to stay above its Ichimoku cloud on the daily chart but a move back above the 103.12 level may be warranted to provide greater conviction for the bulls. For now, its Relative Strength Index (RSI) still hangs below the 50 level while a flat-lining MACD points to a near-term consolidation. The recent CFTC data revealed that the dollar's aggregate positioning against G10 currencies has seen a renewed build-up in net-short positioning last week, following four weeks of unwinding. On the downside, the 100.50 level, which marks multiple bottoms year-to-date, may be on watch.
 Source: IG charts
Asia Open
Asian stocks look set for a mixed open, with Nikkei -0.16%, ASX -0.37% and KOSPI +0.19% at the time of writing. Chinese equities remain under pressure lately, with the Hang Seng Index unwinding all of its past two weeks’ gains upon a retest of the upper edge of an Ichimoku cloud resistance on the weekly chart, which may reveal its significance as a key level for sellers.
The economic calendar is relatively quiet in the region, with Thailand’s trade data and Singapore’s industrial production. Having seen the 8th straight month of contraction in Singapore’s exports, production may track the overall weakness with expectations for a deeper year-on-year contraction to -7.4% from previous -6.9%.
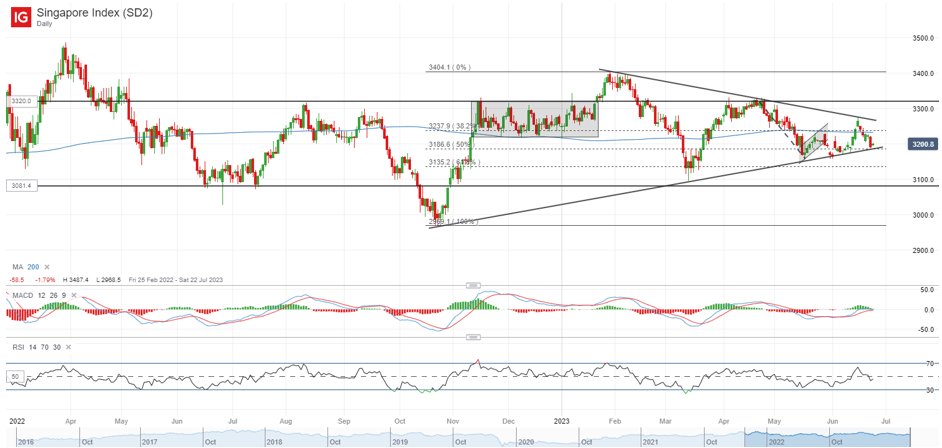
The Straits Times Index continues to trade within a symmetrical triangle pattern, with the index heading back to retest the lower trendline for the fourth occasion since the start of the year. Any breakdown of the lower triangle trendline could leave the March 2023 bottom on watch at the 3,100 level.
 Source: IG charts
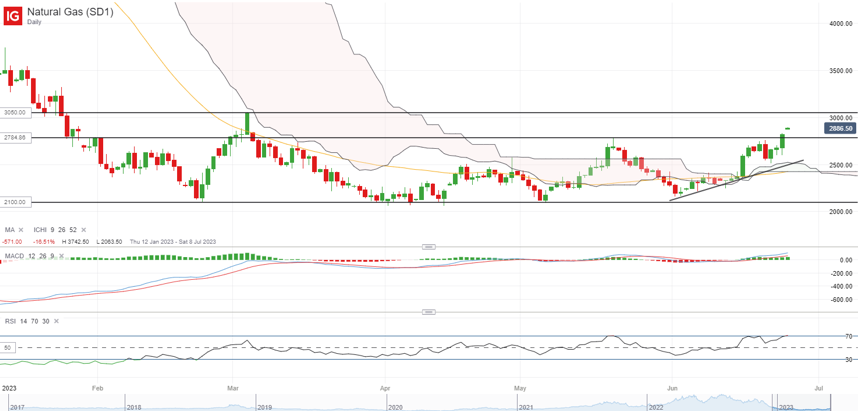
On the watchlist: More signs of life in natural gas prices with push to three-month high
After plunging as much as 78% since August 2022, natural gas prices have been largely forming a base over the past months, which suggests that selling pressure may be exhausted for now. Hotter-than-usual global temperatures increasing electric use and lower-than-planned supply in Norway’s gas output have been on the radar, with natural gas prices heading to its three-month high to end last week.
On the technical front, the RSI maintains above its key 50 level, with the recent formation of higher highs and higher lows supporting a near-term upward bias. The 3.05 level may be on watch next, with any move above this level suggesting a break of its ranging pattern and provides further validation of buyers taking control after a months-long period of indecision. On the downside, a series of support lines will be on watch, which includes its Ichimoku cloud support and its 50-day MA.
 Source: IG charts
Friday: DJIA -0.65%; S&P 500 -0.77%; Nasdaq -1.01%, DAX -0.99%, FTSE -0.54%


0 Comments
Recommended Comments
There are no comments to display.
Create an account or sign in to comment
You need to be a member in order to leave a comment
Create an account
Sign up for a new account in our community. It's easy!
Register a new accountSign in
Already have an account? Sign in here.
Sign In Now