

MongiIG
-
Posts
9,899 -
Joined
-
Last visited
-
Days Won
41
Content Type
Profiles
Forums
Blogs
Events
Community Tutorials
Store
Posts posted by MongiIG
-
-
Above videos on alert platform setup and on App alert setup.
All the best - MongiIG
-
Above video on alert platform setup.
Above video on App alert setup.
All the best - MongiIG
-
5 minutes ago, MongiIG said:
Delve inside your mind
How does psychology impact trading? Discover the factors that can influence financial decisions – personality, emotions and moods, biases and social pressures – and hear from experts and traders about the challenges psychology can create.

Emotions and moods
Emotions are chemical changes in the nervous system that cause an instant reaction to an event, while moods are a by-product of our emotions that can last for a lot longer. The emotional state of a trader can have a significant influence over the way they react to certain circumstances and triggers. Explore the psychology of fear, greed, hope, frustration and boredom, and the impact they can have on a trader's performance.

Fear
What does 'fear' mean in trading?
Fear in trading is the distress caused by the threat of loss, real or imagined. Fear can help to keep impulsivity in check but it can also cloud decision making, causing a trader to close out a position too early, or miss out on a profit by being too afraid to open a trade.
Research by Lee and Andrade has found that when fear was induced in a group of traders – by showing them clips from horror movies – only 55% of participants wanted to hold on to their positions. This contrasted with a control group in which fear was not induced, where 75% of the traders still held onto their positions.1
IG's own study showed that less experienced traders were more affected by fear and uncertainty when compared to professional traders. One explanation for this is that professional traders might have experienced more losses than traders who are just starting out, and so could be more comfortable with the risk of loss to secure a profit.
Equally, more experienced traders might have more discipline, meaning they recognise the benefits of closing a losing trade, rather than letting it run. The below graph demonstrates that the average loss is substantially higher than the average gain, which is perhaps due to the tendency of traders to let their losses run out of fear.
Average profit and loss in points

How can traders limit the effects of fear?
One way to limit the effects of fear is by approaching every trade with a plan, and by placing stops to reduce any losses and limits to lock in profits. If you have carried out sufficient technical and fundamental analysis before you open a position, and if your stop or limit is placed at the correct level, you should be confident in the fact that you have done everything in your power to prevent unnecessary losses.
Technical analysis is a great way for you to identify the best levels at which to place a stop or a limit. One form of technical analysis which enables you to do this is a Fibonacci retracement, which you can use to highlight levels of support and resistance.
Things to keep in mind...

-
Delve inside your mind
How does psychology impact trading? Discover the factors that can influence financial decisions – personality, emotions and moods, biases and social pressures – and hear from experts and traders about the challenges psychology can create.
Emotions and moods
Emotions are chemical changes in the nervous system that cause an instant reaction to an event, while moods are a by-product of our emotions that can last for a lot longer. The emotional state of a trader can have a significant influence over the way they react to certain circumstances and triggers. Explore the psychology of fear, greed, hope, frustration and boredom, and the impact they can have on a trader's performance.
-
 1
1
-
-
1 hour ago, JPH333 said:
Hi
If I open a live account, what legal entity am I facing and where is my money/margin held?
Thanks
J
Hi @JPH333
Thanks for the question. Please see the link below on legal entity, it is up to you to choose which IG entity best meets your individual needs.
https://www.ig.com/uk/about-us/international-offering
All the best - MongiIG
-
Post-earnings trade setups: Salesforce and Gap
With Q2 earnings season slowing down, Salesforce and Gap provide us with potential trading opportunities.
 Source: Bloomberg
This article looks at some of the big movers off the back of recent earnings announcements to try and find stocks that seem to provide a good trading opportunity.
Typically, earnings announcements and trading statements will drive a shift or enhancement of market sentiment.
While many see earnings as a significant risk when holding a stock, placing trades in the wake of such events allows for greater confidence that all market knowledge has been factored into current prices.
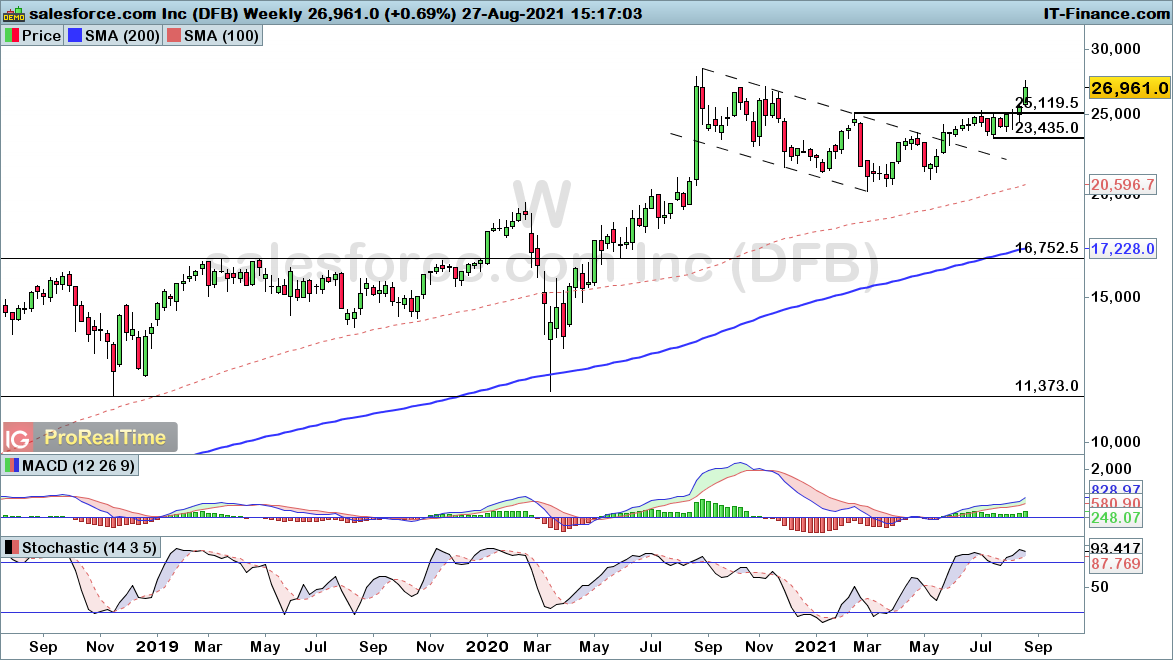
Salesforce
Tech giant, Salesforce enjoyed a strong second quarter (Q2) with the company providing a major EPS beat ($1.48 per share versus 92 cents expected).
Meanwhile, revenues grew 23% compared with Q2 2020. This looks to provide the basis for a continuation of the breakout seen last week.
The push through trendline and $251.19 resistance brings expectations of further upside, with a bullish view in play unless price breaks below $234.35.
 Source: ProRealTime
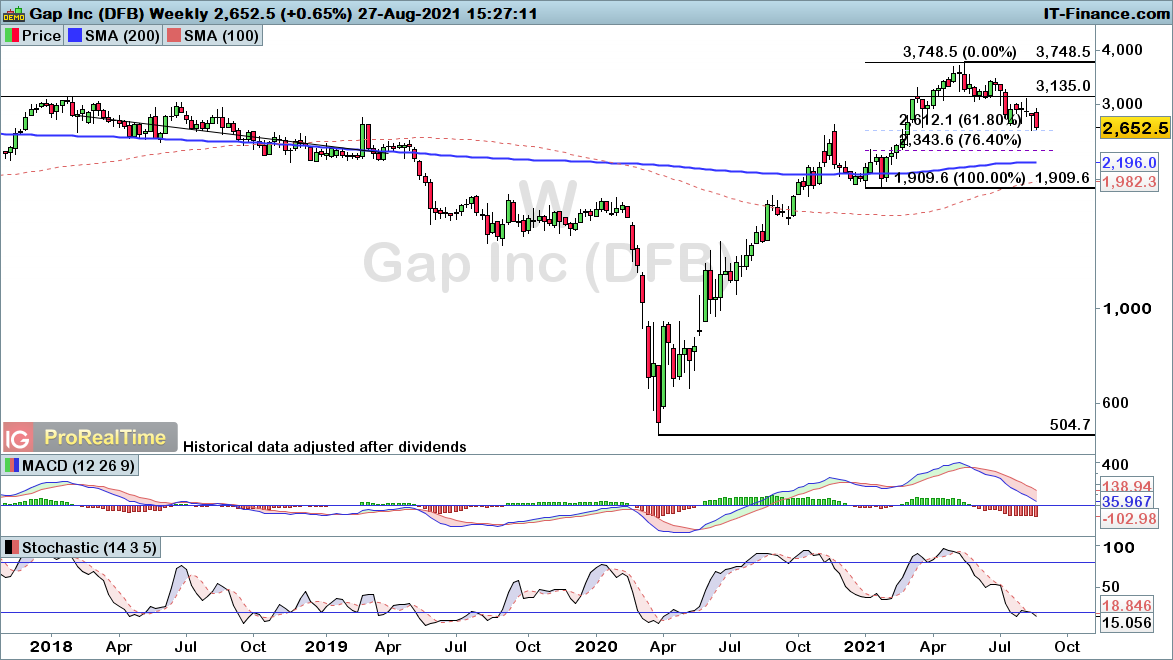
Gap
Gap posted Q2 revenues and earnings that beat market estimates, although the success of the stock meant the share price saw little upside in response.
The weekly chart highlights the wider uptrend in play since the pandemic lows. While we are seeing further downside come into play this week, there is a strong chance we are looking at a retracement before we head higher once more.
With price currently respecting the 61.8% Fibonacci support level, bullish positions are favoured until price breaks below the 2021 lows of $19.09.
 Source: ProRealTime
-
 1
1
-
-
-
Oil on track for best week since September
Oil is on track for its best week since September after suffering its worst week in nine months last week. Prices are moving higher again today amid concerns about tropical storm Ida. IGTV’s Victoria Scholar looks at the chart.
https://www.ig.com/uk/market-insight-articles/oil-on-track-for-best-week-since-september-210827

-
What to trade the week starting 30th August: US jobs report; Superdry earnings
IG’s Chris Beauchamp discusses what to expect from next week’s US jobs data, with private ADP figures on Wednesday and Friday's non-farm payrolls report. Chris also looks at a potential Superdry trade ahead of its earnings report.

-
Risk event of the week starting 30th August: DAX
With a slew of German data points due across next week, Daily FX’s Daniela Sabin Hathorn looks at a potential trading opportunity on the DAX.
 This is here for you to catch up but if you have any ideas on markets or events you want us to relay to the TV team we’re more than happy to.
 -
EUR/USD, GBP/USD and AUD/USD recovering lost ground
EUR/USD, GBP/USD and AUD/USD regain lost ground, but how long will the rebound last?
 Source: Bloomberg
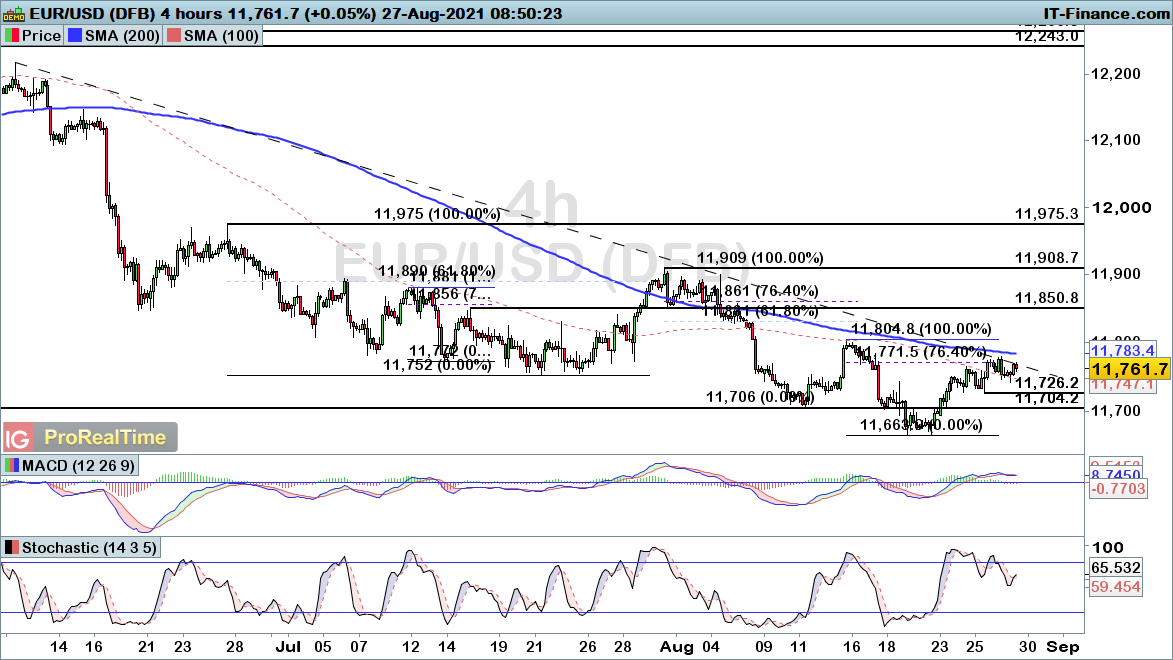
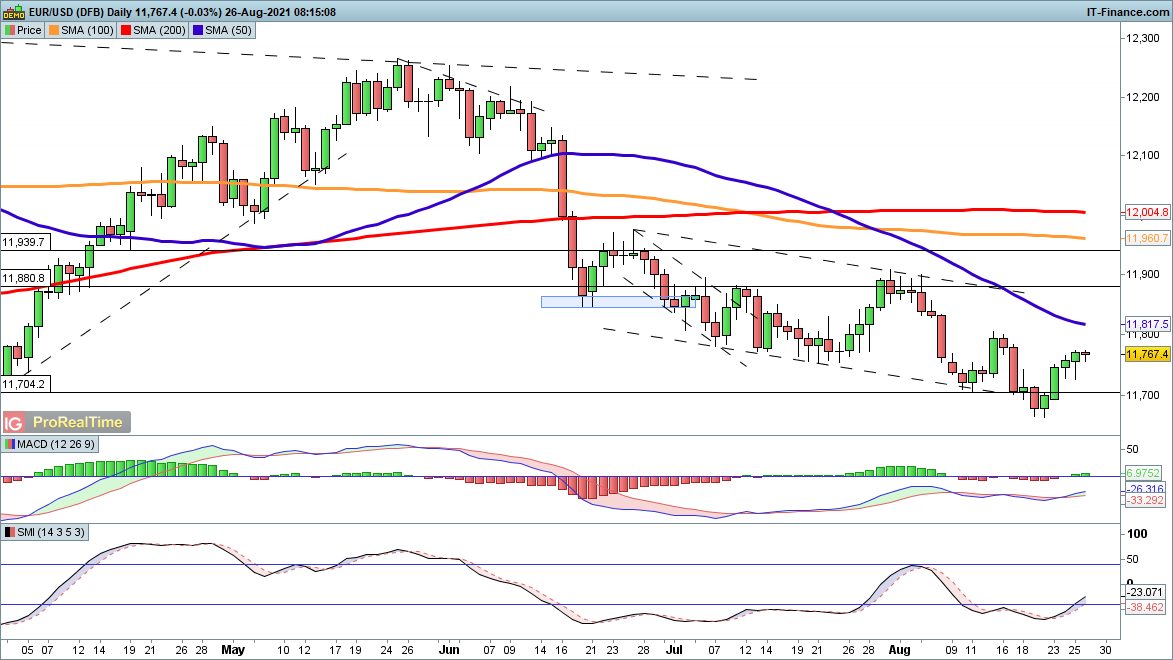
EUR/USD on the rise, yet risk remains of another move lower
EUR/USD has been on the rise over the course of the week, with the price tentatively pushing through the 76.4% Fibonacci resistance level at $1.1771.
With trendline resistance also coming into play here, there is still a good chance we could see the bears return. A break back below $1.1726 would bring greater confidence that the price is going to start turning lower from here. Alternatively, a rise through $1.1804 would point towards a wider upward move for the pair.
 Source: ProRealTime
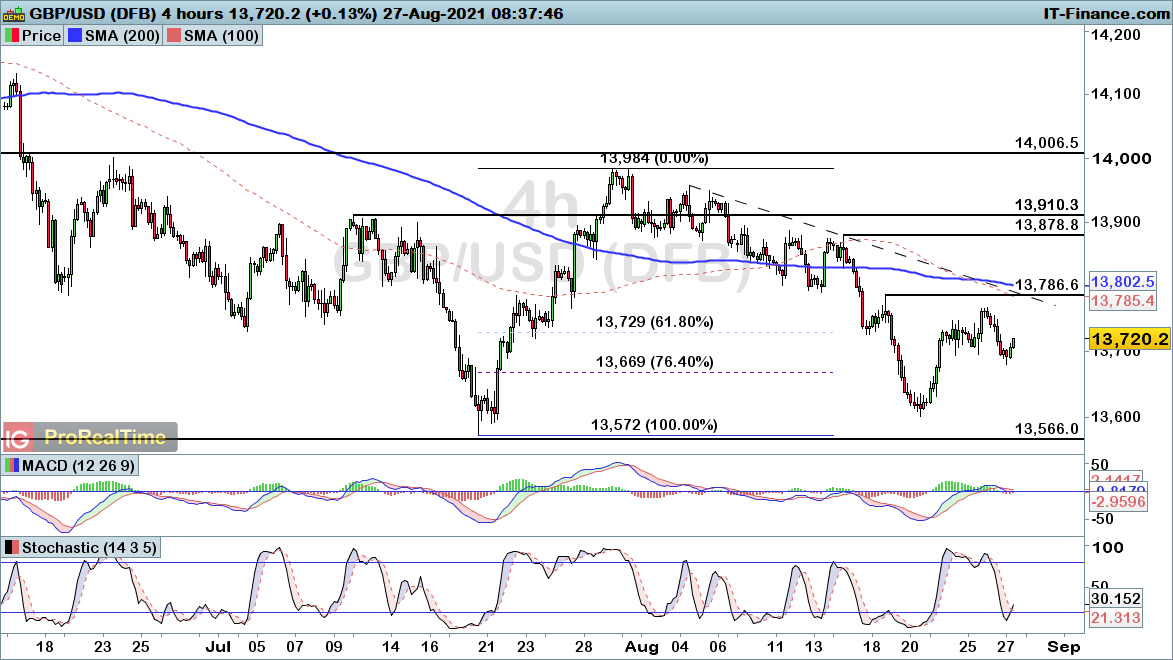
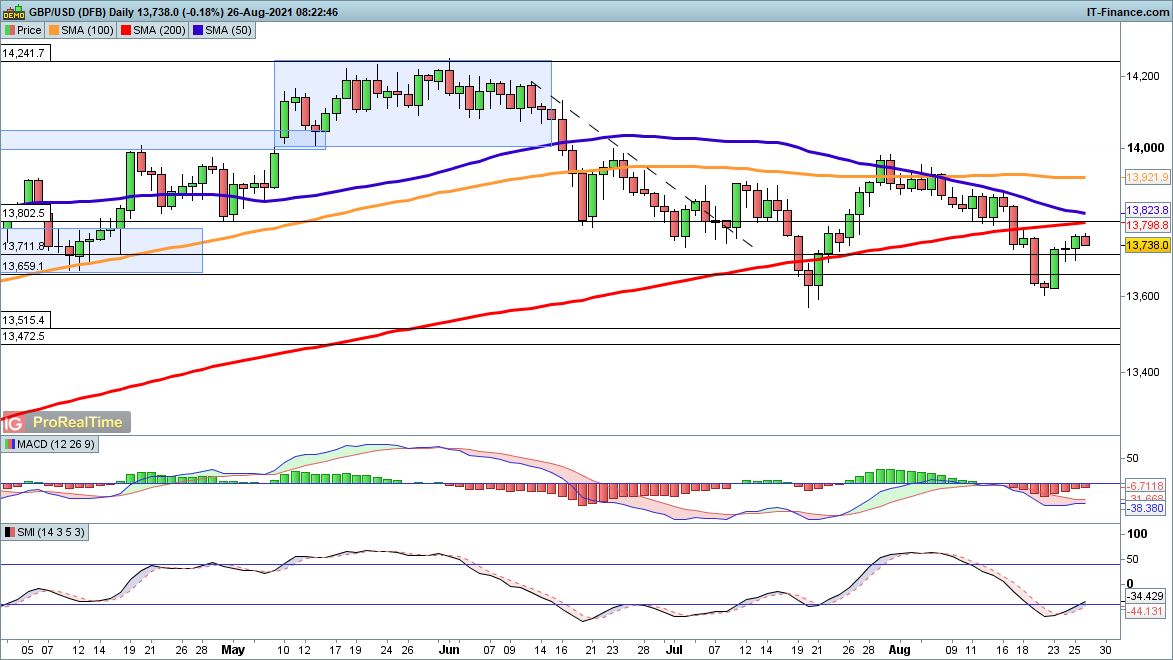
GBP/USD attempting to build on recent rebound
GBP/USD has been on the front foot over the course of the week, with the price rising back towards the confluence of $1.3786 and trendline resistance.
That recent rise comes after a deep retracement of the late-July rise from $1.3572, and we would need to see that level broken to solidify a bearish continuation signal. Until then, there is still a chance we see further ground regained, with the price starting to rise back towards this confluence of resistance around $1.3786.
 Source: ProRealTime
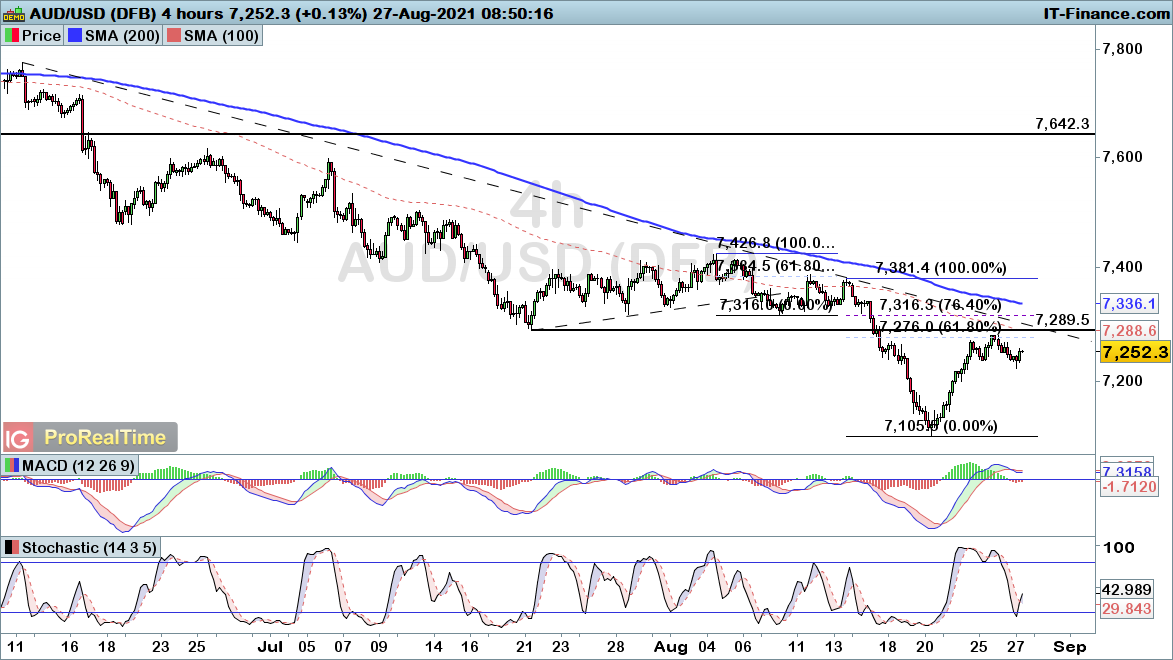
AUD/USD rallies towards confluence of resistance
AUD/USD has similarly been regaining ground this week, with the price rising back into the 61.8% Fibonacci resistance level at $0.727.
With a wider bearish trend in place, there is a strong chance we see another move lower before long. The confluence of Fibonacci and trendline resistance thus provides us with a zone of resistance that should spur a new move lower for the pair. Ultimately, we would need to see $0.7381 broken to bring about a more confident bullish view for AUD/USD.
 Source: ProRealTime
-
Gold rebounds as oil looks for further gains
Oil prices have continued their recovery, while gold is still able to hold its ground.
 Source: Bloomberg
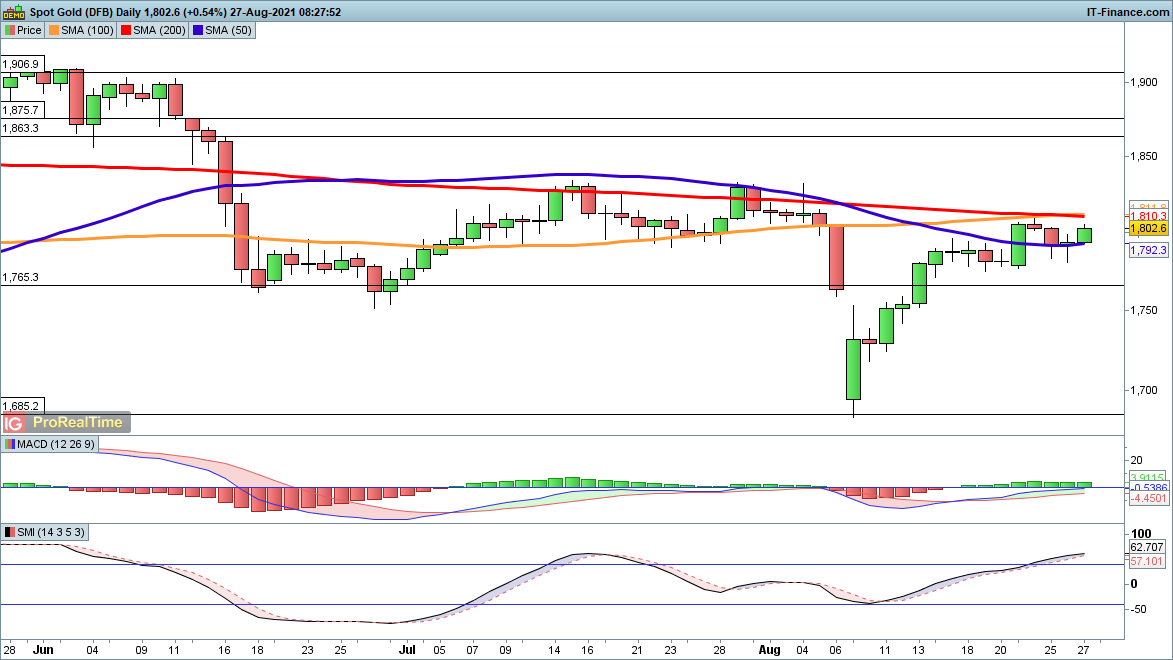
Gold
After dipping to $1780 yesterday the price has recovered, and now further gains target $1810 and then $1830.
Despite expectations to the contrary, the price has held up after its strong August bounce, avoiding any turn lower for the time being and preventing a more bearish view developing.
 Source: ProRealTime
WTI
The recovery continues here, as the price clears the 100-day simple moving average (SMA) of $68.10 and pushes on towards $70, where it stalled in early August.
Above here it targets $74, and then on to $76, with steady gains still looking likely. Bearish price action has been unable to take hold, leaving buyers firmly in charge.
 Source: ProRealTime
-
S&P 500 edges up but FTSE 100 more mixed
While US markets have held their ground ahead of Jerome Powell’s Jackson Hole speech, European markets have come under some pressure.
 Source: Bloomberg
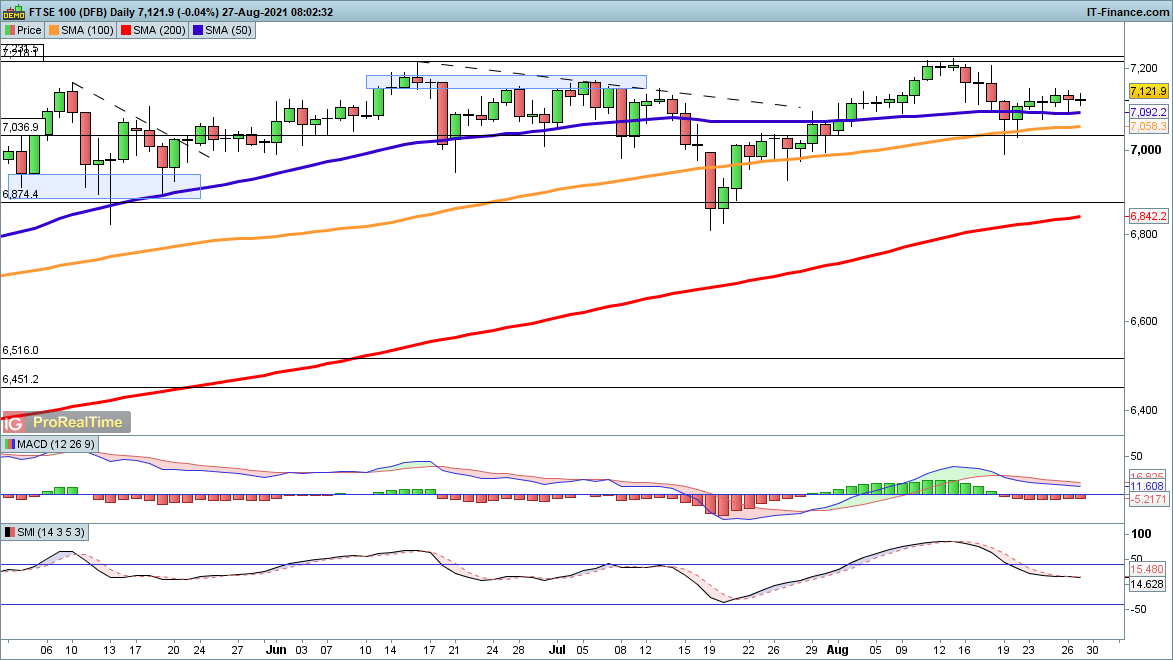
FTSE 100
Gains for the FTSE 100 have stalled all week, with the index unable to find the fresh momentum to push on past 7150.
We have yet to see a significant break to the downside, but a move below 7037 would signal a more bearish environment in the short-term.
 Source: ProRealTime
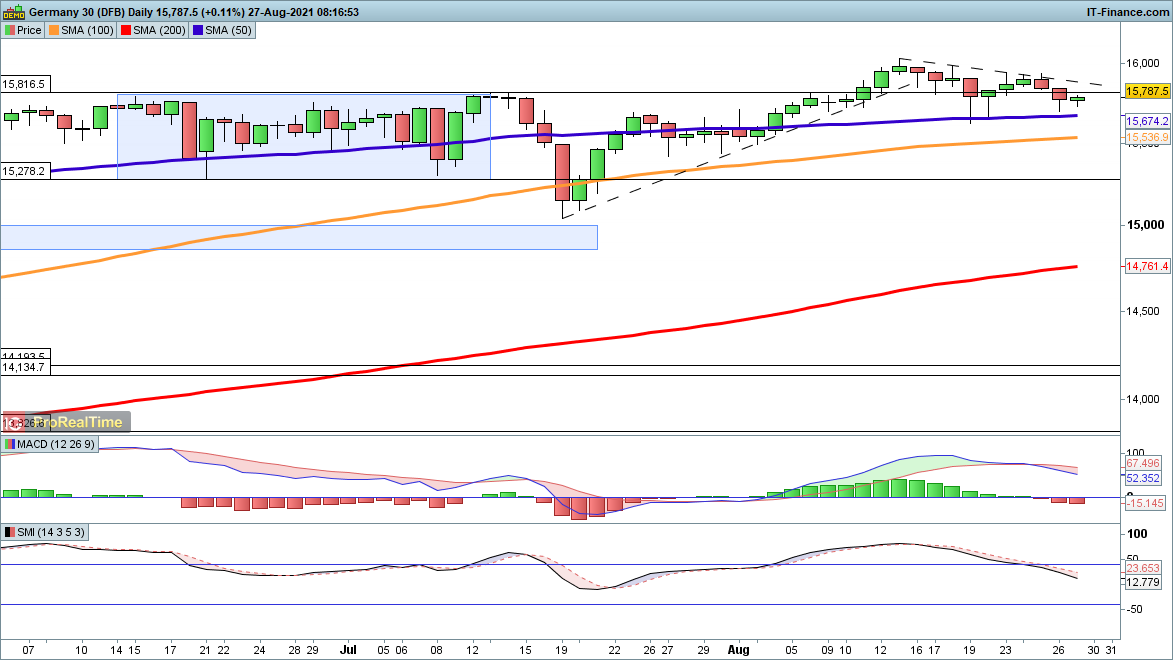
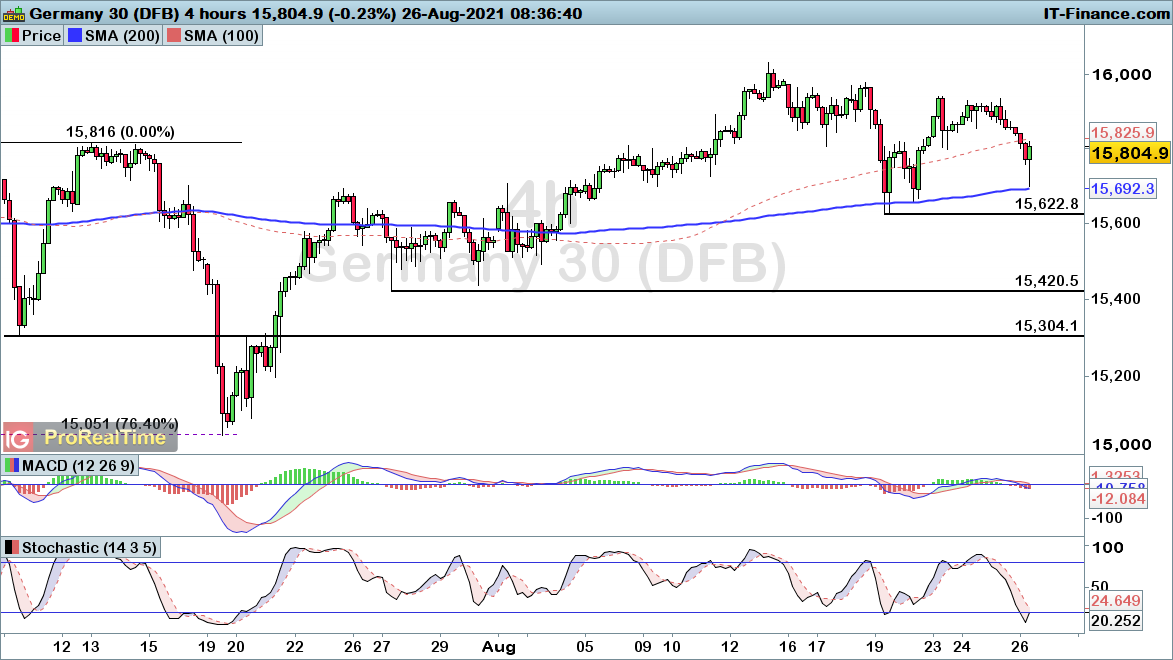
DAX
Most of last week's move higher has been reversed, with the price now nearing the 50-day simple moving average (SMA) at 15,673 once again.
Short-term resistance from the August peak held back progress this week. A break above 15,886 would be needed to provide a more bullish short-term view.
 Source: ProRealTime
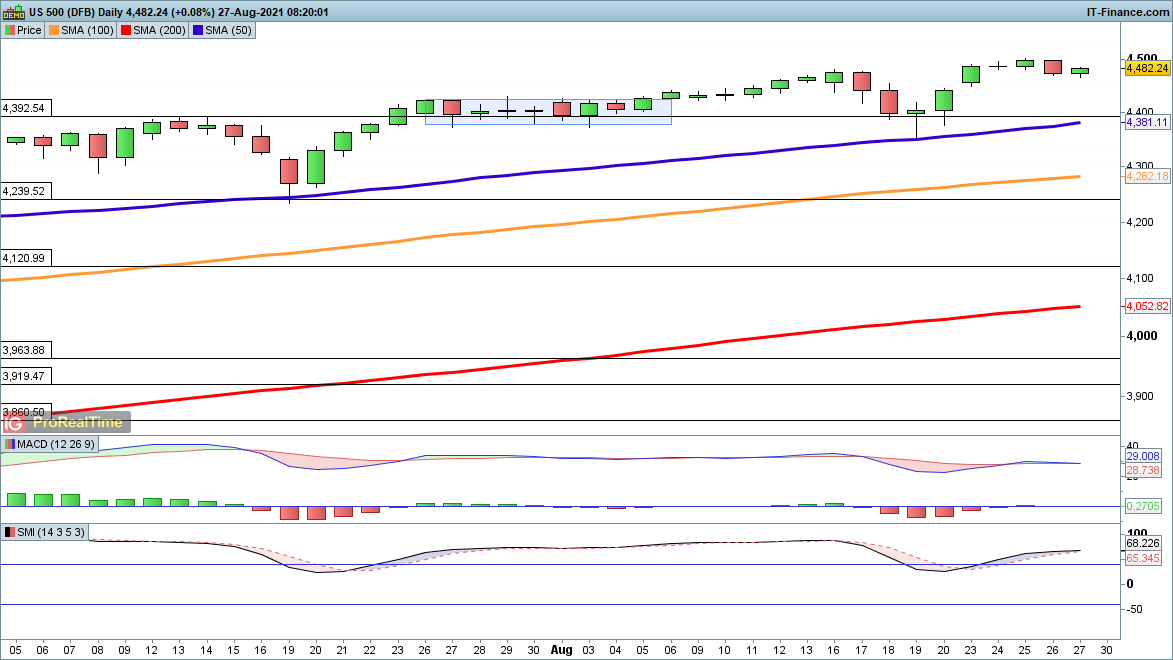
S&P 500
The S&P 500 edged lower yesterday after touching 4500 on Wednesday, but a small recovery overnight has lifted the price off the lows.
A renewed move higher targets 4500 and then into new record high territory. Post-Powell speech (3pm) volatility could see the price head back towards 4392 support.
 Source: ProRealTime
-
Early Morning Call: USD flat; US earnings update and WTI above $68
All eyes on Jackson Hole while Treasury's options expiries could provide volatility around Jay Powell’s address. Gap jumped after hours on earnings while Peloton sank and HP disappointed. And, oil set for best week since 2020.

This is here for you to catch up but if you have any ideas on markets or events you want us to relay to the TV team we’re more than happy to.
-
For more up to date news on how markets will open, the latest earnings and economic news, watch IGTV live in the platform at 07:30am UK.

Today’s coverage: All eyes on Jackson Hole, Treasury options expiries could provide some volatility around Powell’s address, Fed hawks hoping for a taper signal
Indices: SPX, Nasdaq snap 5-day winning streak ahead of Powell’s address at JH,
Econ data: Australia’s retail sales missed f’casts, China’s industrial profits slowed yoy
Equities: Gap jumped after hours on earnings, Peleton sank after hours on disappointing earnings and outlook, HP earnings disappointed
Commods: Oil on track for best week since March 2020
-
Market data to trade on Friday: Powell’s address at Jackson Hole
Investor focus is on Fed Chair, Jay Powell’s address at Jackson Hole on Friday, which is likely to provide some trading opportunities around US assets. Elsewhere, it’s the Baker Hughes oil rig count and Australia’s retail sales.

-
Charting the Markets: 26 August
FTSE and DAX head lower, while the Dow remains ahead as it moves towards record highs. Small gains in early trading for the EUR/USD and USD/JPY, while GBP/USD struggles to make headway. Gold eases back, while Brent turns lower.
https://www.ig.com/uk/market-insight-articles/charting-the-markets--26-august-210826
 This is here for you to catch up but if you have any ideas on markets or events you want us to relay to the TV team we’re more than happy to.
 -
Gold and Brent crude ease back after recent gains
Gold eases back within recovery phase, while Brent crude turns lower from Fibonacci resistance.
 Source: Bloomberg
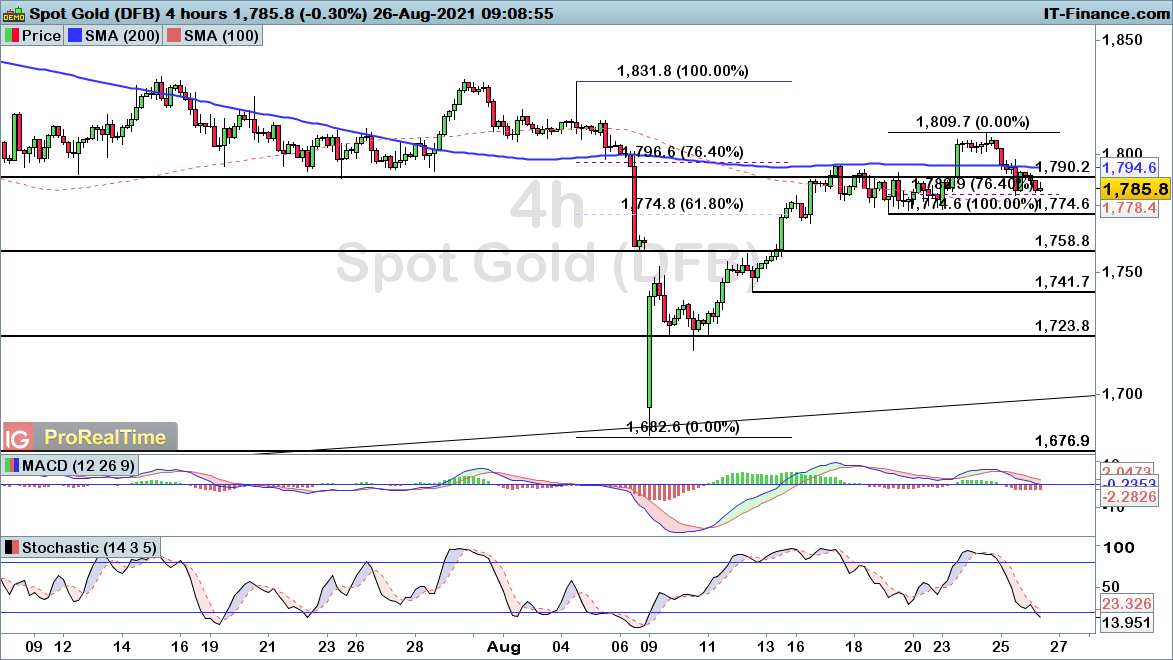
Gold falls back into Fibonacci support within recent recovery
Gold has been on the front foot over the course of the past fortnight, with price pushing through a number of resistance levels in the process.
However, the wider trend of lower highs remains intact unless we see a break up through $1831. The decline seen since Tuesday’s peak of $1809 has taken us back into the 76.4% Fibonacci support level. While that $1783 level was respected yesterday, we are approaching it once again.
With that in mind, there is a good chance that we see price turn upwards once again from here, with a break below $1774 required to bring a more bearish picture into play.
 Source: ProRealTime
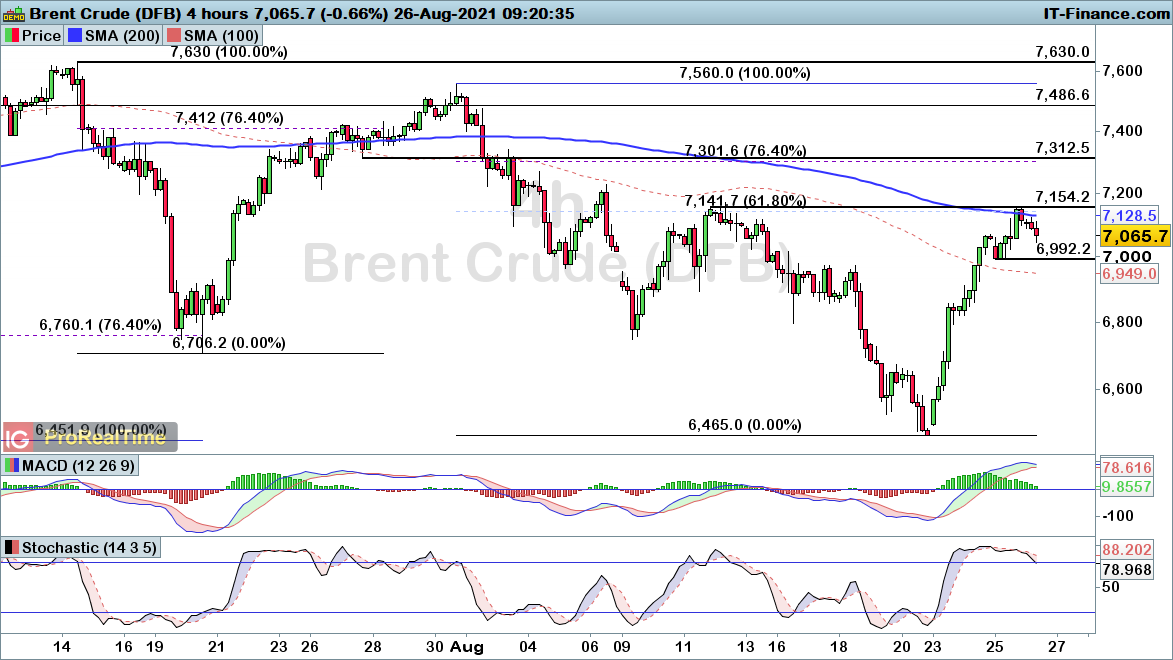
Brent crude starts to fade from key confluence of resistance
Brent crude has been on the rise over the course of the week thus far, yet we are starting to see the selling pressure come back into play again this morning.
That comes after a rise into the confluence of the wider 61.8% Fibonacci retracement level and recent swing-high of $71.54. That weakness would gain traction with a decline through the $69.92 low established yesterday. Until then, the intraday uptrend remains intact.
 Source: ProRealTime
-
Dow heads towards record highs, as FTSE 100 and DAX see early weakness
FTSE and DAX head lower as key support comes into view. Meanwhile, the Dow remains on the front-foot as it heads towards record highs.
 Source: Bloomberg
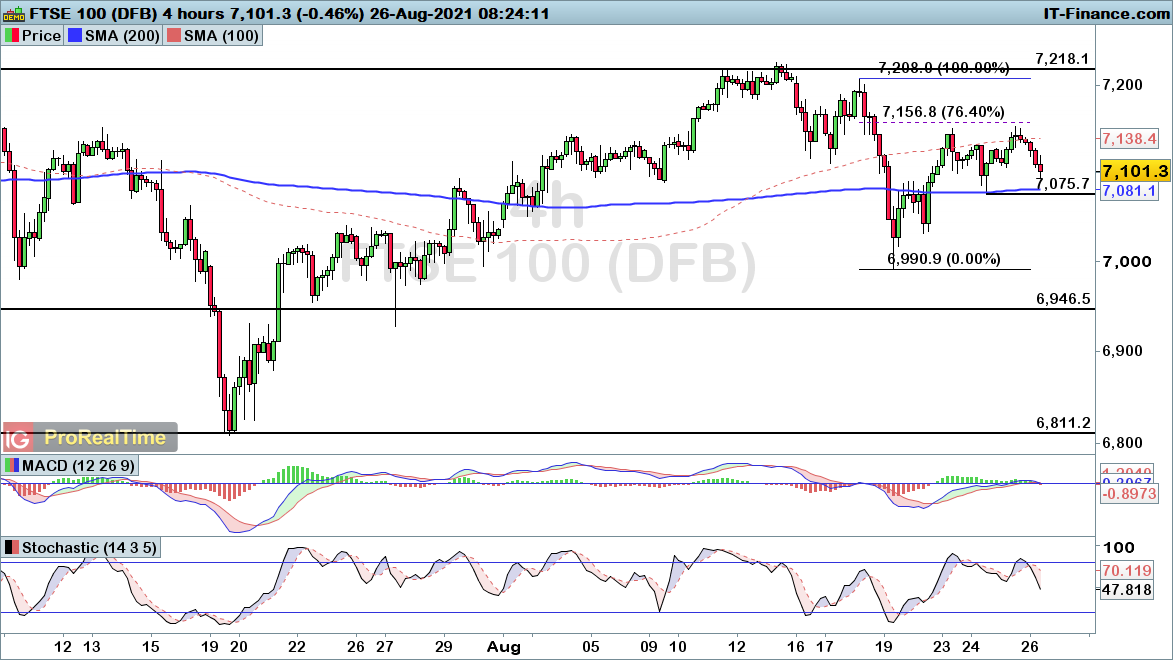
FTSE 100 rolling over from Fibonacci resistance
The FTSE 100 has started to roll over once again this morning, with the index respecting the 76.4% Fibonacci resistance level at 7157.
This could become a more worrying sign for bulls if we see price fall back below the 7075 low established on Tuesday. As such, the ongoing sentiment will be dictated by the ability to break or remain above 7075.
 Source: ProRealTime
DAX rolling over towards key support
The DAX has similarly started to weaken in early trade, with the index falling back into the 200-simple moving average (SMA) thus far.
A move below the 15622 level is the key signal that would bring about a more protracted bearish move. Nonetheless, while there is a risk of further weakness, the bulls remain in charge until we see support break.
 Source: ProRealTime
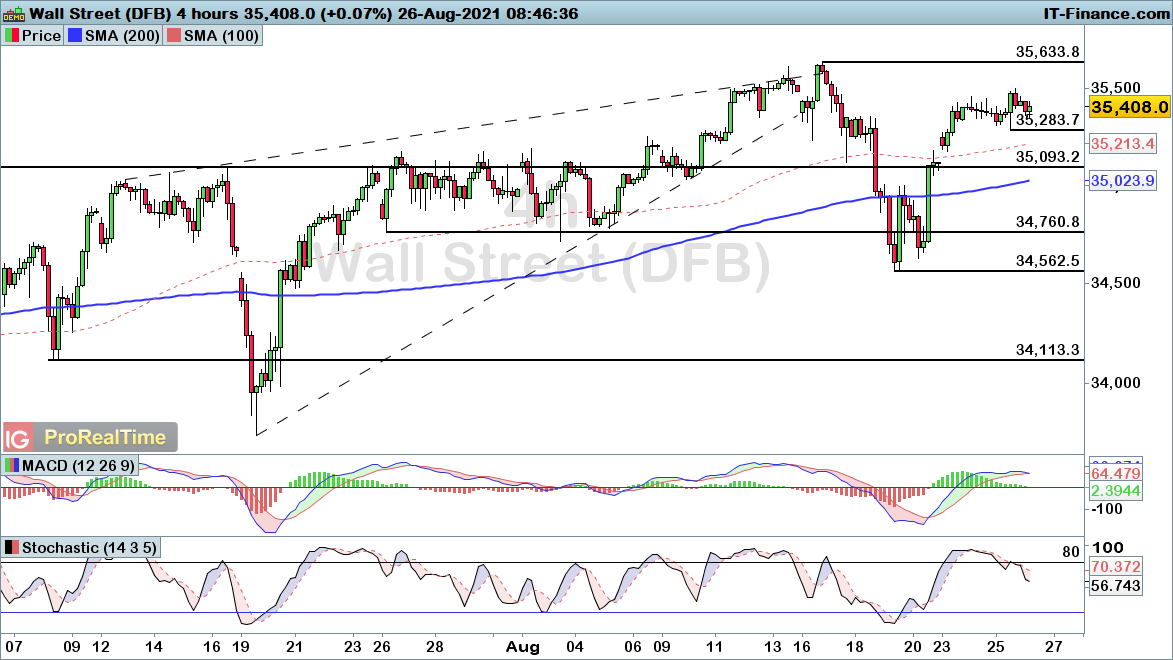
Dow Jones on the rise towards new highs
The Dow has managed to avoid the bearish price action seen in Europe this morning, with the index largely consolidating after a week of strong gains.
The recent wedge breakdown does raise the risk of another turn lower, yet we have seen all Fibonacci resistance levels taken out to bring a more confident bullish view into play.
With record highs up ahead, there is a good chance we see the index break higher before long. A break below the 35283 level would bring a more bearish short-term view.
 Source: ProRealTime
-
18 hours ago, HeOfMuchDisgrunt said:
@MongiIG Thanks - I understand that you are saying IG will not be legally restricted or prevented from offering these products, but what I'd like to know is whether IG anticipates Basel III affecting any of these markets, eg in terms of liquidity, availability of products in the underlying markets, etc. Are there any products that IG is currently considering withdrawing by its own choice as a result of Basel III?
Currently we don't anticipate withdrawing any products as a result. Obviously should this change we would let clients know. With regards to underlying market, this could impact liquidity as banks are required to hold more physical (allocated) gold thus pressuring supply (as they buy and hold) and demand (as they are required to hold more especially as collateral against unallocated gold).Hope this answers your question.All the best - MongiIG -
EUR/USD, GBP/USD and USD/JPY edge higher
Small gains have been seen in early trading for EUR/USD and USD/JPY, while GBP/USD struggles to make headway.
 Source: Bloomberg
EUR/USD targets $1.18
Dollar weakness continues to carry EUR/USD higher, rebounding over the previous four sessions.
However, the overall negative trend remains firmly in place, given the run of lower highs of late. A move back above the 50-day simple moving average (SMA) at $1.1817 would ease some of the bearish view, and shift the outlook to a more neutral one for the time being.
 Source: ProRealTime
GBP/USD rally slows
The rebound with GBP/USD has stalled after several days of gains, suggesting a potential continuation of the run of losses seen since the end of July.
A move back above $1.38 would start to provide a more positive view, but sellers will be looking for a new move back to, and then below, $1.36.
 Source: ProRealTime
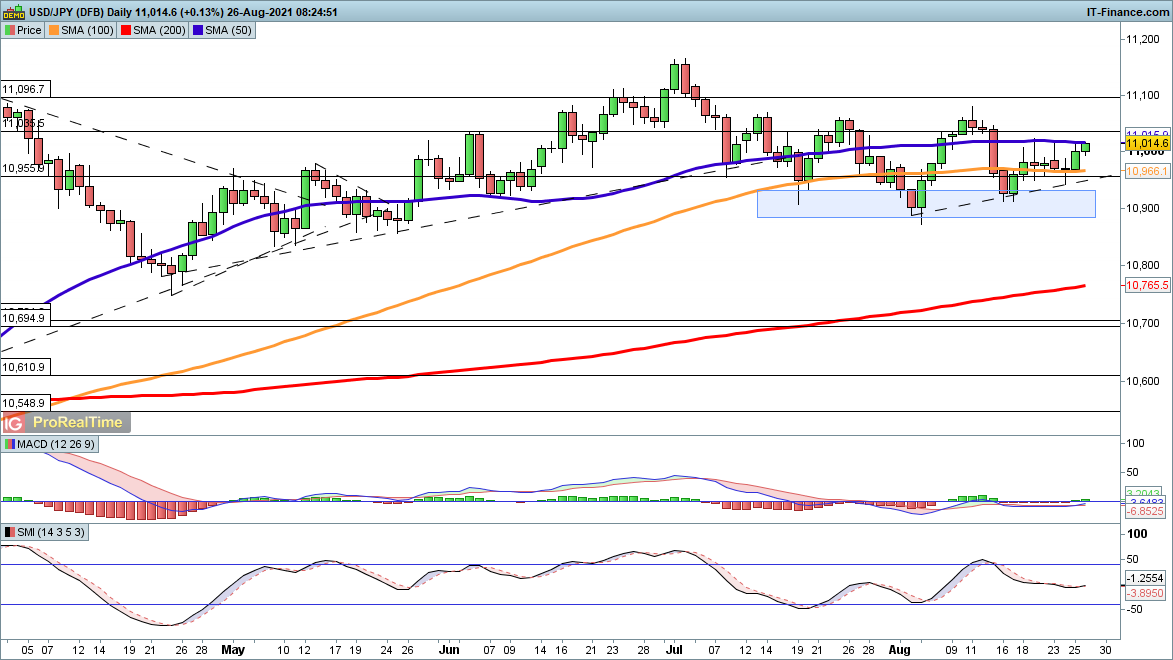
USD/JPY edges higher for a fresh session
The recovery of USD/JPY puts the pair on course to test ¥110.50 once more, if the price can hold above ¥110.00, which has acted as resistance over the past week.
Since the beginning of the month the price has carved out higher lows, helping to provide a more bullish view in the short term.
 Source: ProRealTime
-
Early Morning Call: European indices expected lower; oil at 2-wk high and earnings update
European indices set to open lower after SPX and Nasdaq log fifth consecutive day of gains. Oil snaps three-day winning streak, with prices now at two-week highs. And, Gap, HP, Dell and Peloton report earnings today.
This is here for you to catch up but if you have any ideas on markets or events you want us to relay to the TV team we’re more than happy to.
-
15 hours ago, Gar said:
@charlotteIG please can you add SPDR S&P U.S. Communication Services Select Sector UCITS ETF. GXLC LN. SEDOL BD31GG8
Thanks.
Hi @Gar
We have created a specific thread for Stock request with the eligibility requirements:
Please kindly make your request there giving the information needed to make the request.
Thanks
All the best - MongiIG
-
USD/CAD seems to have turned a corner after a pandemic-fuelled decline, but the ability to maintain this rebound also depends on energy prices.
 Source: Bloomberg
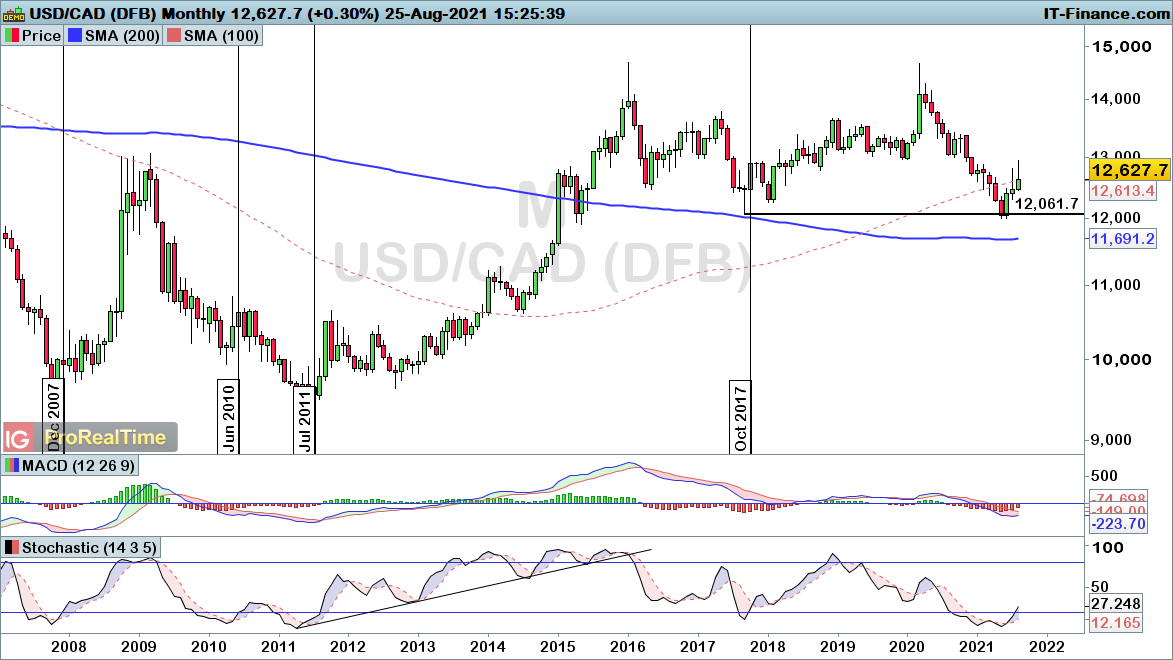
USD/CAD on the rise from long-term support
USD/CAD has been hit hard over the 14 months to June, with price dropping into the 2017 low of 1.2061.
While we did see a brief foray into fresh six-year lows in June, we have since seen the pair regain ground to signal a potential trend change.
The stochastic oscillator plays a role in that view, with the push through 20 marking an exit from oversold territory that has only happened four times since the 2007 global financial crisis. Of those four occasions, three have marked notable long-term buying opportunities.
 Source: ProRealTime
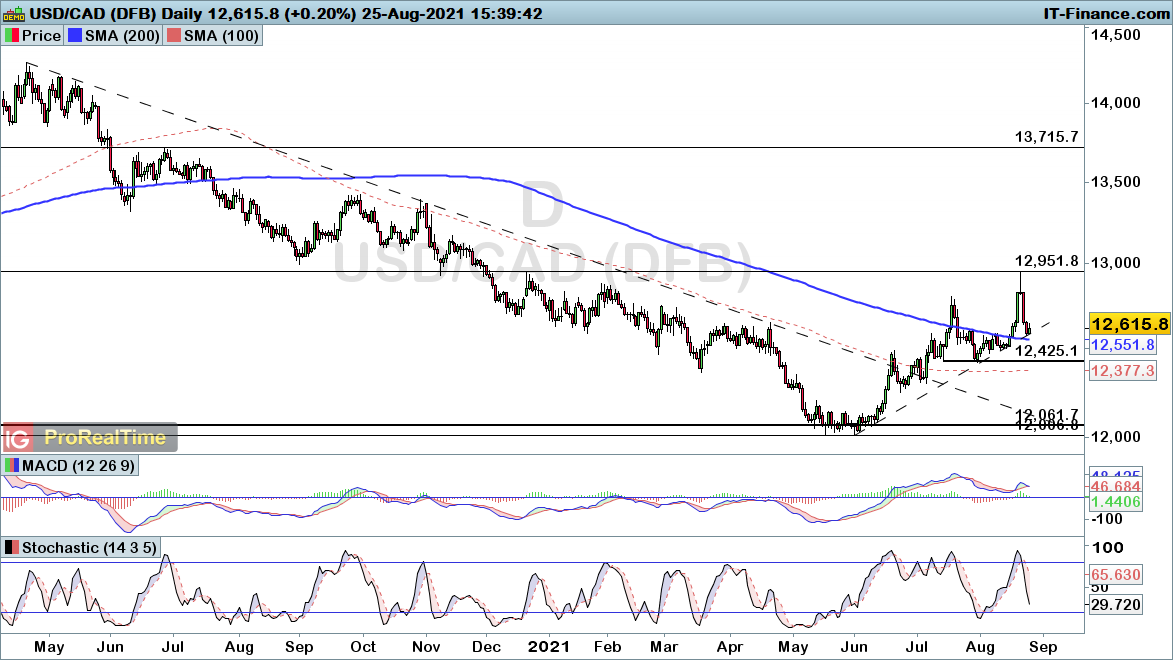
On the daily timeframe, we can see that the pair has broken through trendline resistance, bringing an end to the bearish trend which dominated much of the pandemic.
Clearly the gains seen for crude have hit the buffers, bringing the possibility that CAD upside will be relatively limited as a result. This forms the basis for a potential USD/CAD rise as the Federal Reserve moves towards a new tightening phase.
While the pair has weakened over the past two days, this has brought us back into trendline and the 200-simple moving average (SMA) support zone. As such, bullish positions are favoured, with a decline through 1.2425 required to negate this bullish view.
 Source: ProRealTime
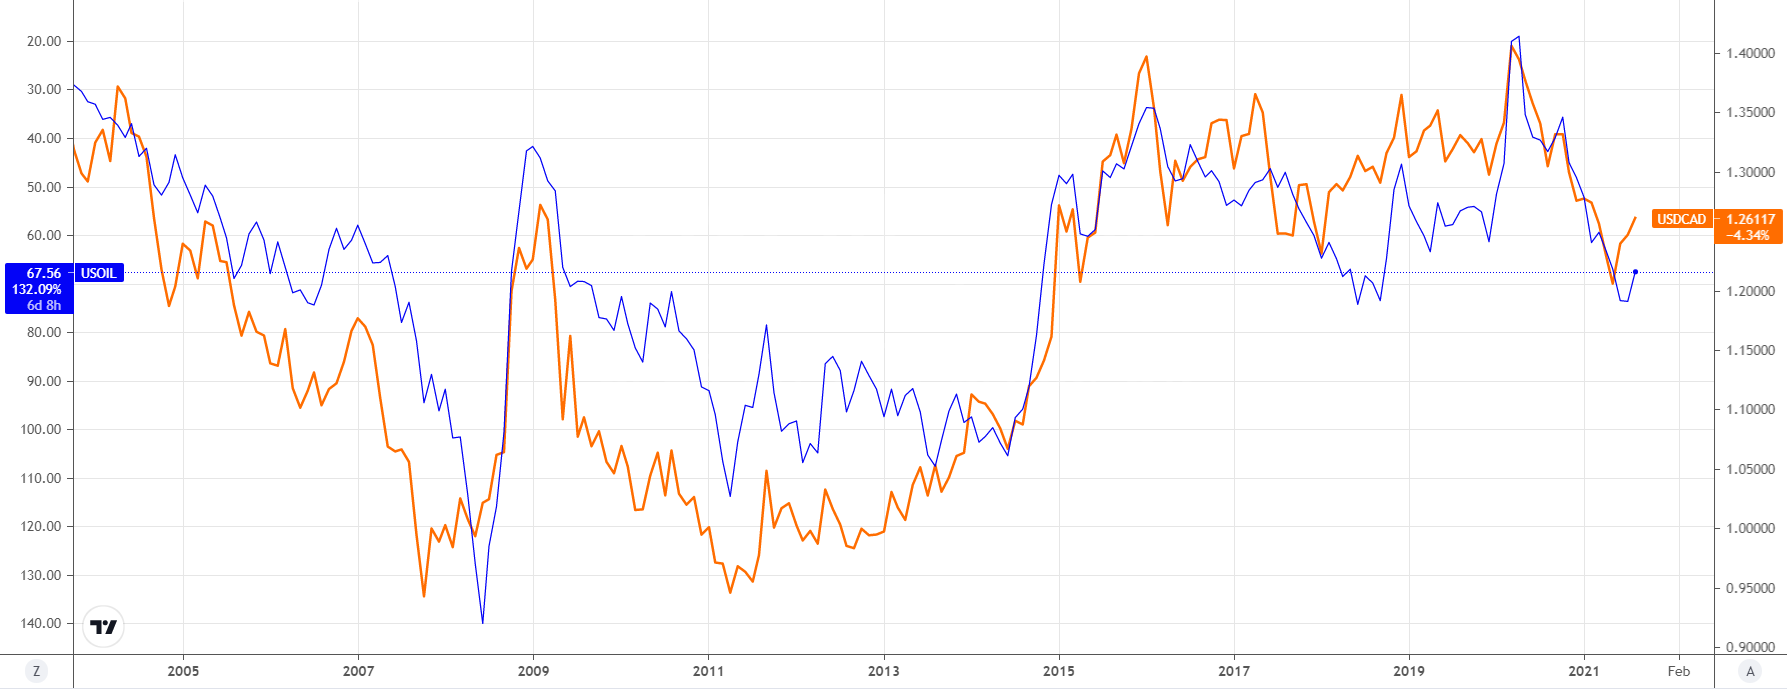
USD/CAD a play on oil
By inverting the price of WTI oil, we can see that USD/CAD is going to be driven heavily by energy prices.
Thus, this recent recovery in USD/CAD provides a reflection of potential short-term downside for crude. With that in mind, make sure to keep an eye out for reopening/Delta sentiment as a driver of crude and USD/CAD prices.
 Source: TradingView


IGTV on Demand
in General Trading Strategy Discussion
Posted
For more up to date news on how markets will open, the latest earnings and economic news, watch IGTV live in the platform at 07:30am UK.
Today’s coverage:
Indices: More record highs for NDAQ and SPX, Asia mostly up with NKY near 3wk high. China and HK down on disappointing PMI data. Europe to open mixed
FX: EURUSD at 3wk high as Fed tapering talk turns dovish
Equities: Zoom down 11% after Q3 forecasts disappoint. PayPal up 4% on its move towards stock trading. Earnings today OML and BNZL
Commods: Hurricane Ida keeps oil at recent highs on supply concerns. Gold 1815 nearing 1mth high
https://community.ig.com/igtv/