

MongiIG
-
Posts
9,899 -
Joined
-
Last visited
-
Days Won
41
Content Type
Profiles
Forums
Blogs
Events
Community Tutorials
Store
Posts posted by MongiIG
-
-
For more up to date news on how markets will open, the latest earnings and economic news, watch IGTV live in the platform at 07:30am UK.

Today’s coverage:
Indices: European indices set to open lower after SPX, Nasdaq log 5th straight day of gains
FX: S. Korea becomes first developed economy to raise rates since covid
Equities: Greggs becomes latest food business hit by supply chain issues, Morrisons could be set to be added to FTSE 100, Gap, HP, Dell, Peleton earnings today, Salesforce jumps after-hours on earnings
Commods: Oil snaps 3-day winning streak, at 2-weeks highs, iron ore’s 3rd straight day of gains
-
Market data to trade on Thursday: US Q2 GDP; HP, Gap, Peloton earnings
IGTV’s Victoria Scholar looks at the chart of the GBP/USD ahead of a second estimate of second quarter US GDP. Meanwhile, HP, Gap and Peloton earnings are in focus.

-
Charting the Markets: 25 August
European trade is mostly muted so far in today’s session ahead of Jackson Hole later this week. The Nasdaq and S&P 500 closed at record highs last night and it was a mixed session in Asia.
The US dollar is treading water ahead of the Jackson Hole symposium. Brent crude is trading lower so far today after oil staged another sharp rally on Tuesday, up for the second day in a row, with that rally offsetting last week's sharp drop.
https://www.ig.com/uk/market-insight-articles/charting-the-markets--25-august-210825
 This is here for you to catch up but if you have any ideas on markets or events you want us to relay to the TV team we’re more than happy to.
 -
Gold slips below $1800 as oil prices look for further gains
While gold has fallen back from the highs of the week, oil prices are aiming for more gains after a strong start to the week.
 Source: Bloomberg
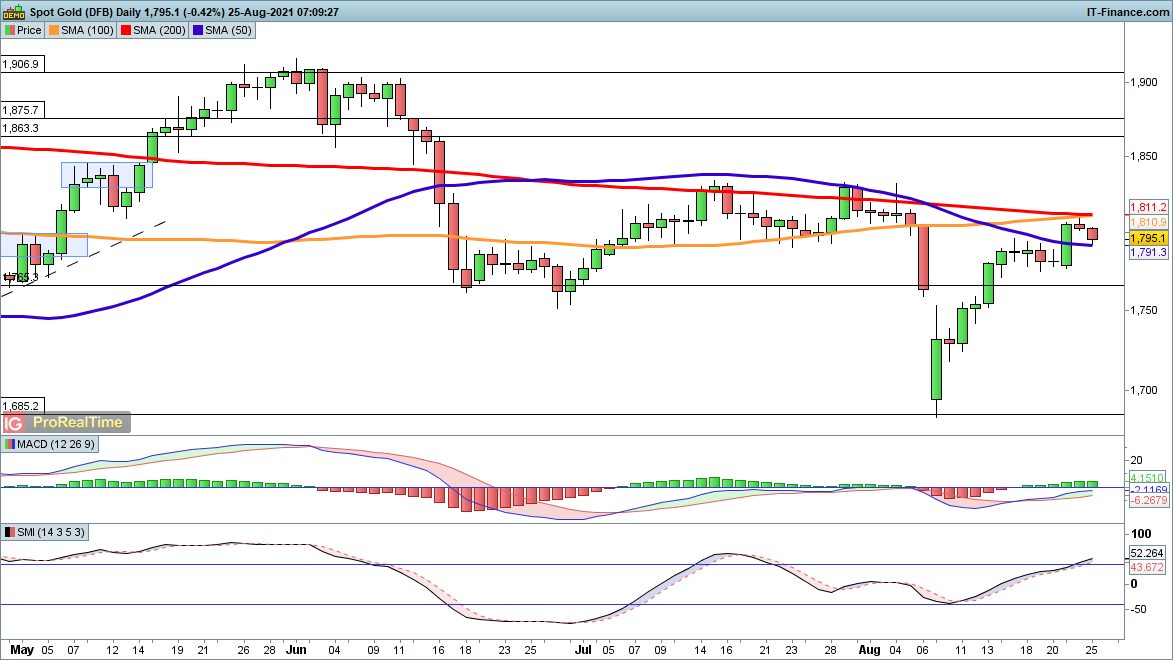
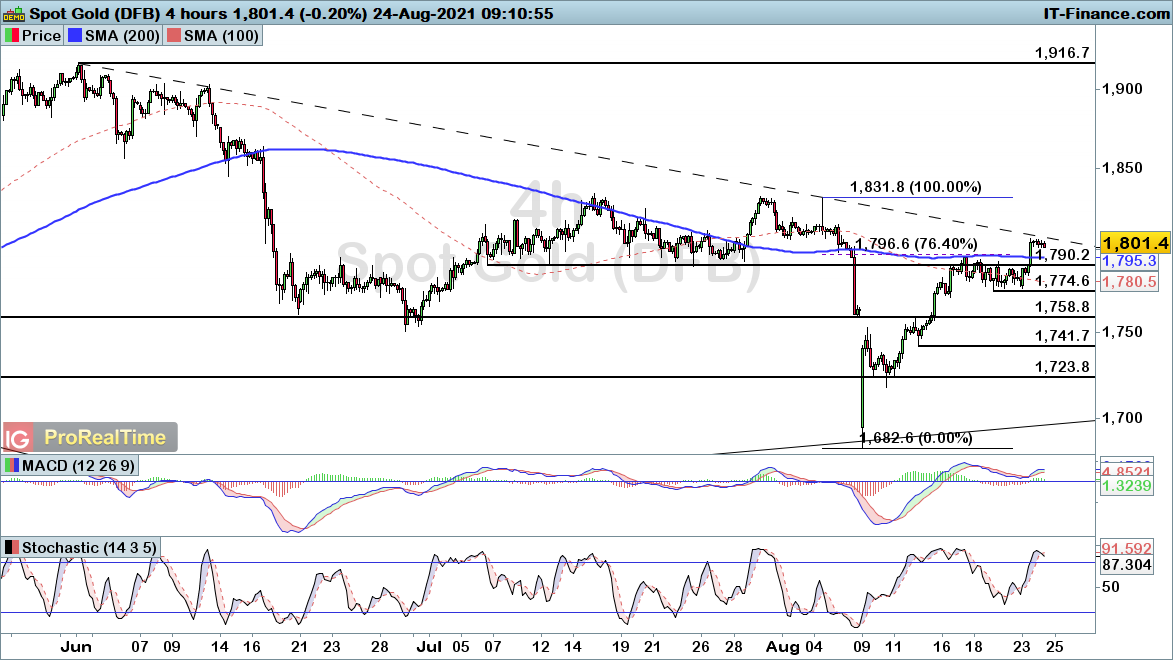
Gold
An attempt to maintain gold's rally above $1800 has fizzled out for the time being, and we have seen further small losses this morning.
A move below $1780 would reinforce the view that this is a lower high, and could spell the beginning of a fresh retracement.
Bulls will want to see a move back above $1810, although this may yet be a consolidation move before further gains.
 Source: ProRealTime
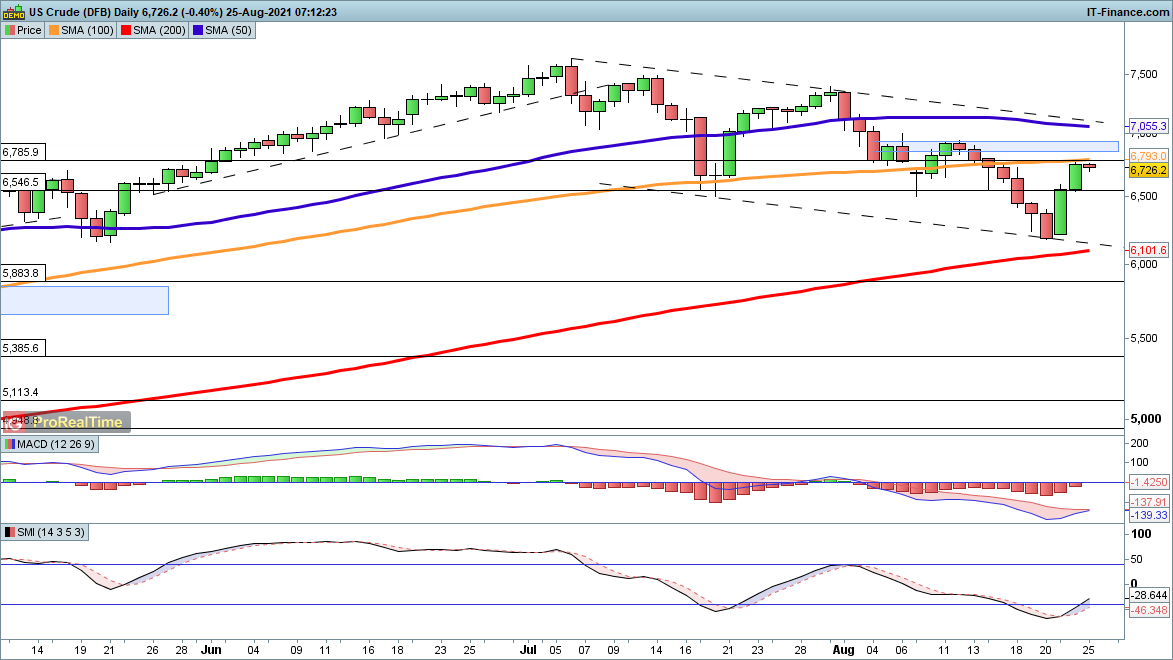
WTI
Oil's sharp gains over the past two days have helped to restore some measure of bullishness, although there is still more to be done.
Early August highs at $69.38 are the first target to watch, followed by the late July peak at $73.50.
 Source: ProRealTime
-
Indices' gains stall after strong start to the week
The gains of Monday and Tuesday have turned into a more static market environment, with caution developing as the Jackson Hole meeting nears.
 Source: Bloomberg
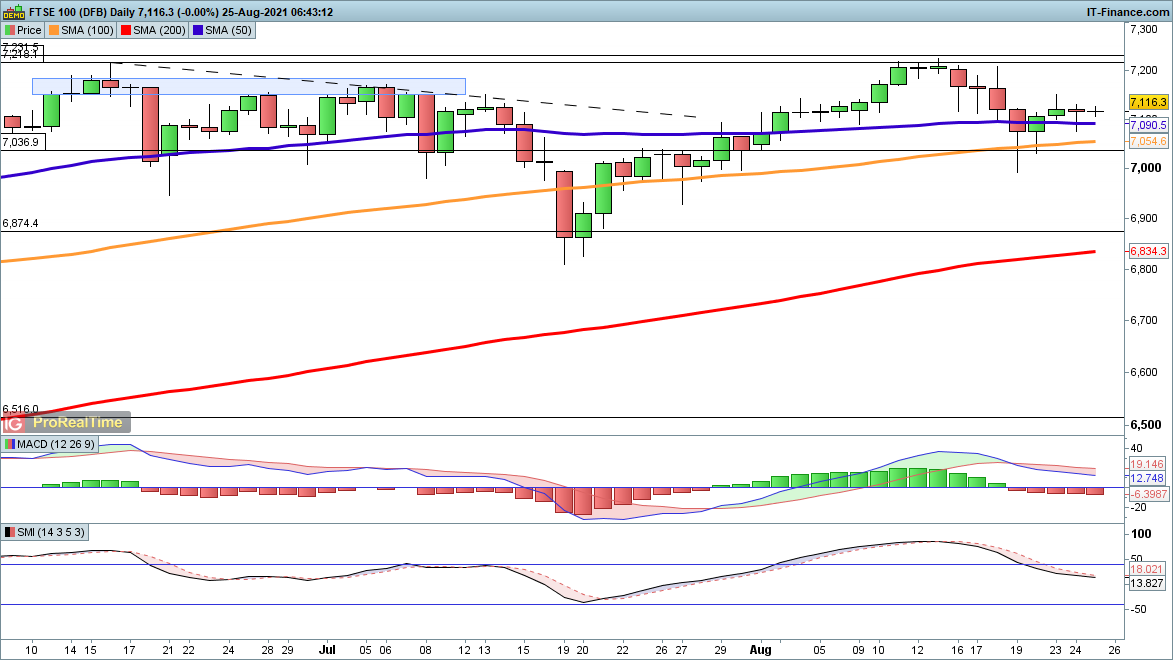
FTSE 100
Gains for the FTSE 100 have stalled over the past three days; the price hovering around 7110 for the time being.
The strong thrust seen in other markets has been weaker here, with further to go until the price can reclaim the August highs above 7200.
So far the downside is contained, suggesting this is consolidation rather than anything else. A move below 7036 would negate that view.
 Source: ProRealTime
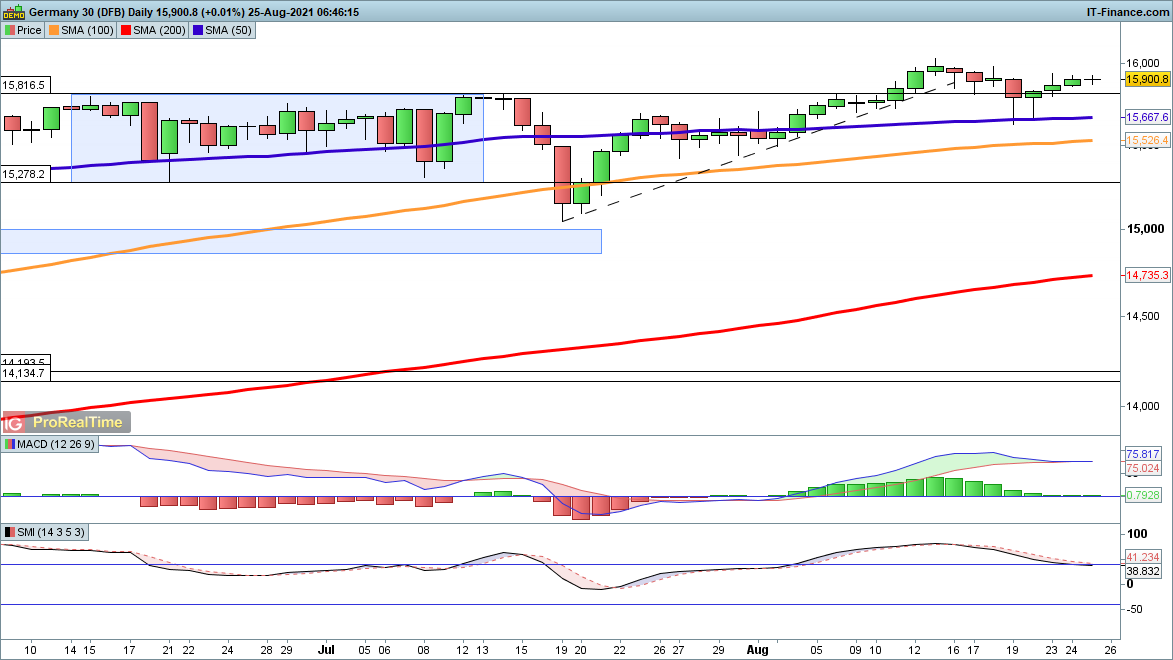
DAX
A gentle move higher here has seen the price make further inroads towards 16,000, although a fresh close above this level has yet to take place.
The bounce from the 50-day simple moving average (SMA) of 15,667 remains intact, and for the time being there is very little strength in the bearish thesis.
 Source: ProRealTime
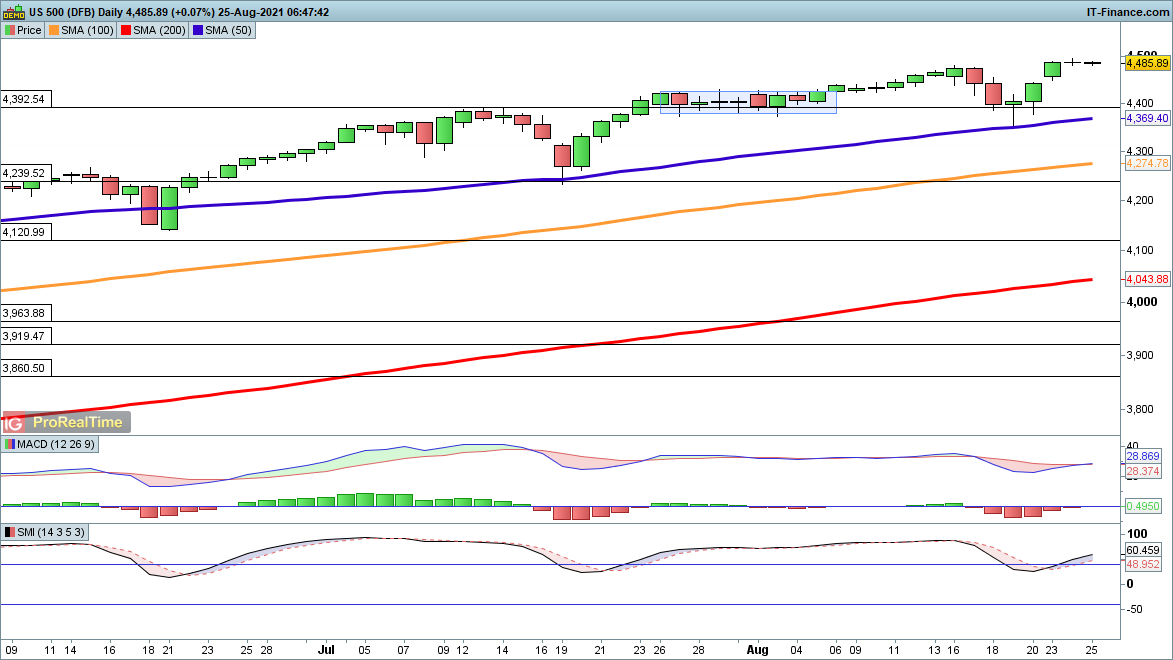
S&P 500
This index has headed back to record highs very quickly, as might be expected from its solid performance this year.
A fresh move towards 4500 seems likely, while bearish price action has yet to develop on the daily chart.
As with the Dax, the bounce from the 50-day SMA (4369) is intact.
 Source: ProRealTime
-
Early Morning Call: More record highs for indices; USD steady ahead of Jackson Hole and Brent back up
Nasdaq, S&P hit record highs as Wells Fargo says S&P 500 to rise another 8% by year-end. DXY treading water ahead of Jackson Hole while GS says November now more likely for the start of tapering. And, Brent is back above $70.
 This is here for you to catch up but if you have any ideas on markets or events you want us to relay to the TV team we’re more than happy to.
 -
-
For more up to date news on how markets will open, the latest earnings and economic news, watch IGTV live in the platform at 07:30am UK.
Today’s coverage:
Indices: Nasdaq, S&P hit record high, Wells Fargo says S&P 500 to rise another 8% by year-end
FX: DXY treading water ahead of Jackson Hole, GS says November now more likely for the start of tapering
Equities: Ryanair’s CEO says its on track to hit upgraded guidance on passenger numbers, GameStop closes up 27%, AMC up 20%, Biden to meet US tech bosses in Washington to discuss cybersecurity today
Commods: Iron ore lower after yesterday’s jump, Brent back above $70 with this week’s 2-day jump reversing last week’s losses, gold back below $1800
-
Market data to trade on Wednesday: German IFO business climate; Snowflake, Salesforce Q2 earnings
IGTV’s Victoria Scholar looks at the chart of the EUR/USD ahead of the latest German IFO business climate figures. Meanwhile, Snowflake and Salesforce get set to report second-quarter results.

-
Super Trend and Volume Weighted Average Price Indicators are now available to use on the web platform and mobile app.
All the best - MongiIG
-
Super Trend and Volume Weighted Average Price Indicators are now available to use on the web platform and mobile app.
All the best - MongiIG
-
On 10/12/2020 at 16:39, jaz19802020 said:
Hi
I see that many IG retail users have requested VWAP, just curious why cannot a simple request be implemented in spreadbet and CFD?
Thanks
Hi @jaz19802020
Super Trend and Volume Weighted Average Price Indicators are now available to use on the web platform and mobile app.
All the best - MongiIG
-
Super Trend and Volume Weighted Average Price Indicators are now available to use on the web platform and mobile app.
All the best - MongiIG
-
Super Trend and Volume Weighted Average Price Indicators are now available to use on the web platform and mobile app.
All the best - MongiIG
-
On 10/04/2021 at 06:29, Farooq said:
Hey folks,
I've managed to get and read data from IG Demo API . Can anyone please point me on how I can calculate VWAP... as seen on tradingview.? I'm using python and I have the price values stored in a DataFrame. Time interval is 30 mins.
Any help is really appreciated.
Thanks
Hi @Farooq
Super Trend and Volume Weighted Average Price Indicators are now available to use on the web platform and mobile app.
All the best - MongiIG
-
On 02/04/2021 at 00:57, Guest TraderRandom said:
I can see there have been many previous request for it but no update for the requests
https://community.ig.com/forums/topic/9124-vwap-indicator-where-is-it/
https://community.ig.com/forums/topic/11562-please-add-vwap-indicator-to-your-online-platotform/
https://community.ig.com/forums/topic/9112-why-is-vwap-not-included-in-the-trading-platform/
Super Trend and Volume Weighted Average Price Indicators are now available to use on the web platform and mobile app.
All the best - MongiIG
-
Super Trend and Volume Weighted Average Price Indicators are now available to use on the web platform and mobile app.
All the best - MongiIG
-
Super Trend and Volume Weighted Average Price Indicators are now available to use on the web platform and mobile app.
All the best - MongiIG
-
Super Trend and Volume Weighted Average Price Indicators are now available to use on the web platform and mobile app.
All the best - MongiIG
-
Charting the Markets: 24 August
FTSE, DAX, and Dow are on the rise, regaining lost ground. The euro and sterling are rallying against the US dollar, which is struggling to make headway against the yen. Gold continues to regain ground, while Brent spikes higher.
https://www.ig.com/uk/market-insight-articles/charting-the-markets--24-august-210824
 This is here for you to catch up but if you have any ideas on markets or events you want us to relay to the TV team we’re more than happy to.
 -
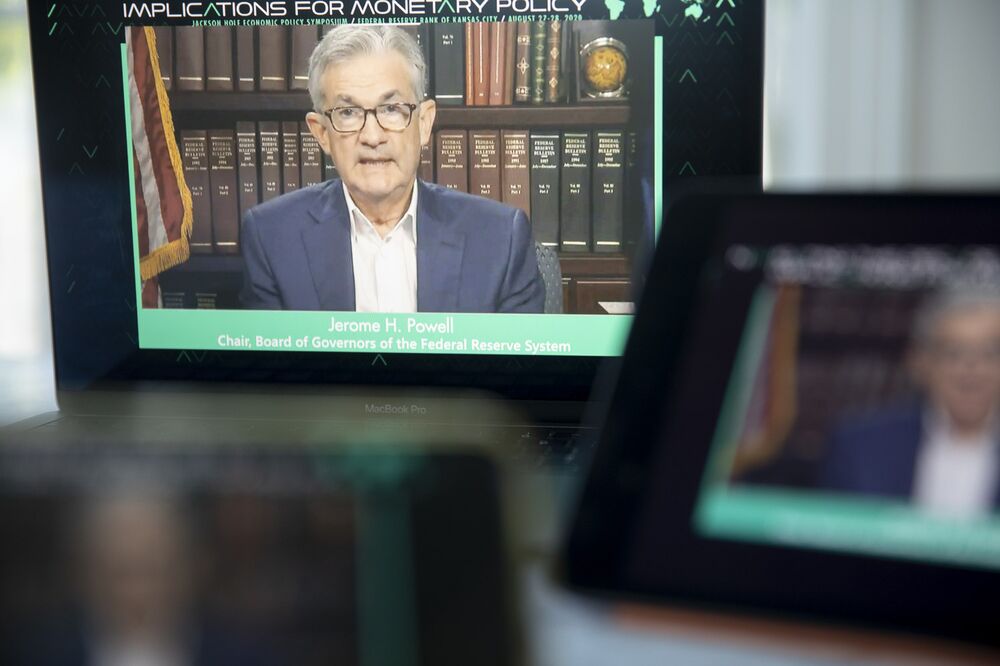
What to watch at Jackson Hole
The Jackson Hole Symposium kicks off virtually this week with hawkish bets on the Fed dialled back in recent days. IGTV’s Victoria Scholar looks at what to expect from the event and at the chart of the dollar.
https://www.ig.com/uk/market-insight-articles/what-to-watch-at-jackson-hole-210824
-
Gold and Brent crude regaining lost ground, with key resistance up ahead
Gold continues to regain ground, while Brent crude spikes higher after a recent decline into key support.
 Source: Bloomberg
Gold rises through Fibonacci resistance to engage descending trendline
Gold managed to break up through the 76.4% Fibonacci resistance level yesterday, with the consolidation and lack of downside momentum around that level signalling the potential for a bullish break.
Nonetheless, the bulls aren’t out of the woods quite yet, with a descending trendline coming into play here. As such, a rise through trendline and $1831 resistance will be key to providing a more long-lasting bullish outlook.
Meanwhile, should this trendline resistance hold, a break below $1774 would bring a fresh bearish outlook for the index.
 Source: ProRealTime
Brent crude surging after decline into key support
Brent crude has regained ground at the beginning of this new week, with the recent selloff taking us back into the crucial 6452 support level. A break below that level would have brought a wider bearish picture into play.
However, for now we are seeing the bulls come back into play. The risk for bulls is that we do remain within a trend of lower highs, with the 76.4% Fibonacci resistance level at $70.03 thus playing a key role if we continue to rise.
Ultimately, we need to see price break through the $71.70 resistance level to bring an end to this bearish short-term trend.
 Source: ProRealTime
-
EUR/USD and GBP/USD rally but USD/JPY runs into resistance
The euro and sterling are rallying against the US dollar, while the greenback itself is struggling to make headway against the yen.

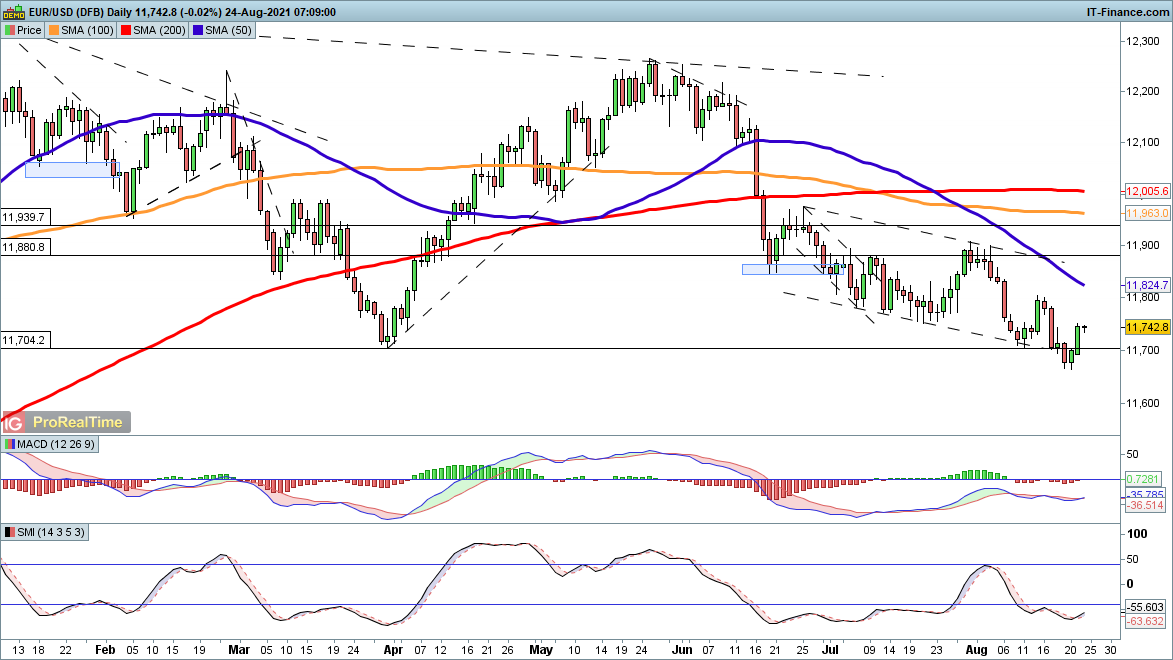
EUR/USD bounces, but view still bearish
The strong bounce with EUR/USD of the past few days is unlikely to change the overall view here unless it can move back above $1.19 in the coming weeks. Even further gains leave the sellers in charge overall, even with the recovery back above $1.17 support.
Ultimately, the bullish view is not likely to receive much medium-term support on current the price action, with a fresh move to the downside expected in due course.
 Source: ProRealTime
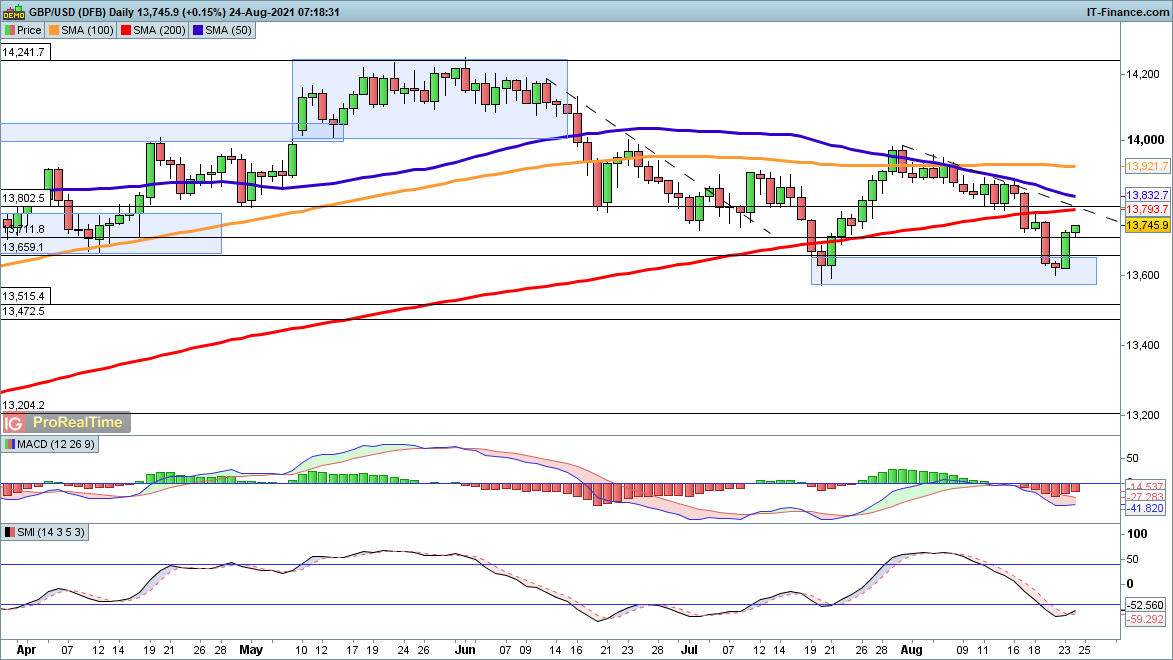
GBP/USD sees renewed strength
GBP/USD has staged a reasonable bounce over the past two sessions, rallying back above $1.36 and holding this level as support.
Trendline resistance from the late-July high comes into play around $1.376, and if the price falters there, then a turn lower would target $1.36 once more. Further, gains above $1.37 head towards $1.40.
 Source: ProRealTime
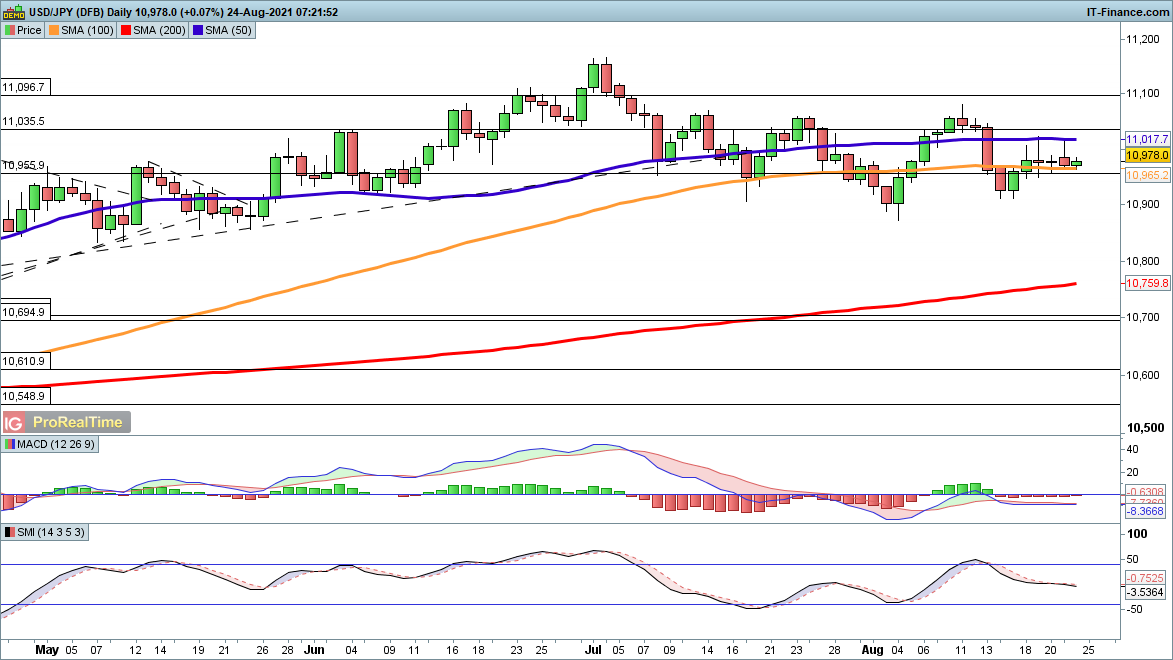
USD/JPY’s attempt to rally defeated
Dollar weakness has come into play with USD/JPY, as yet another attempt to move above ¥110.00 fizzles out
However, the price has yet to give a clear sign that it has rolled over, with a move below ¥109.50 likely to provoke a more definitive bearish view. Buyers need to push the price back above ¥110.20 to point towards a more bullish outlook.
 Source: ProRealTime
-
FTSE 100, DAX and Dow recovery continues, but hurdles remain
FTSE, DAX, and Dow are on the rise, with the indices regaining lost ground. However, key hurdles remain as markets attempt to negate last week’s breakdown.
 Source: Bloomberg
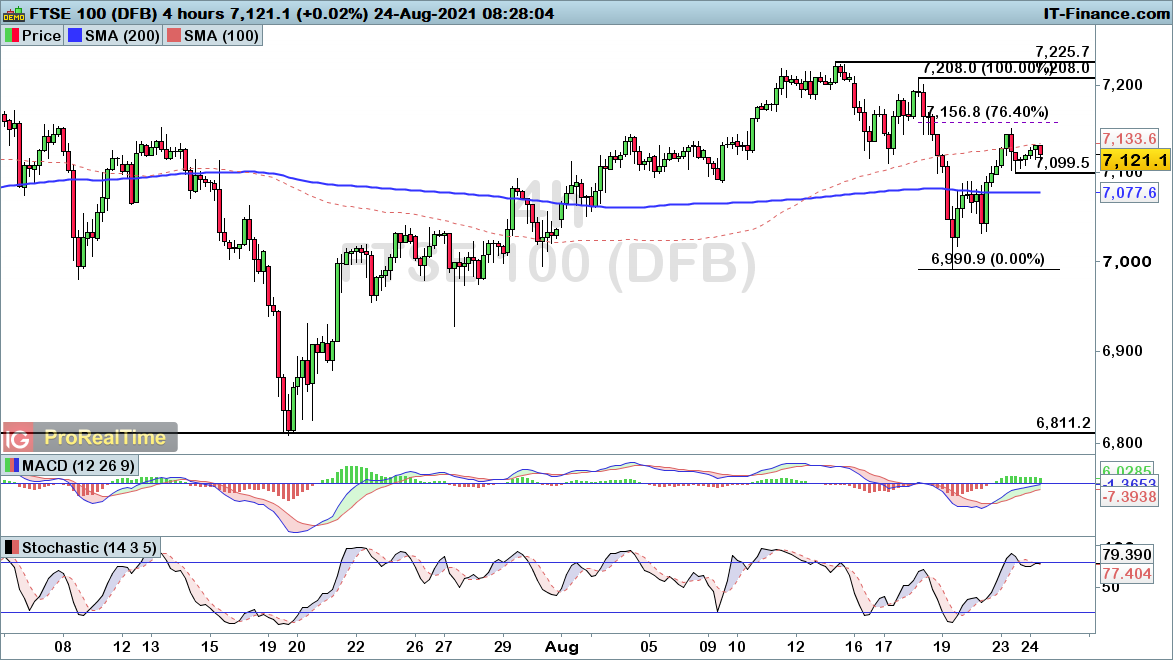
FTSE 100 rally starts to lose traction
The FTSE 100 has been attempting to regain ground since Thursday’s lows, with the index pushing towards the 76.4% Fibonacci resistance level yesterday.
Unfortunately, we are seeing some of the momentum fade around that key level, with a rise through 7208 required to provide a more long-lasting buy signal for the index.
Until then, there remains a chance that we will turn lower to continue the recent bearish phase. A move below 7099 brings greater confidence of another short-term decline.
 Source: ProRealTime
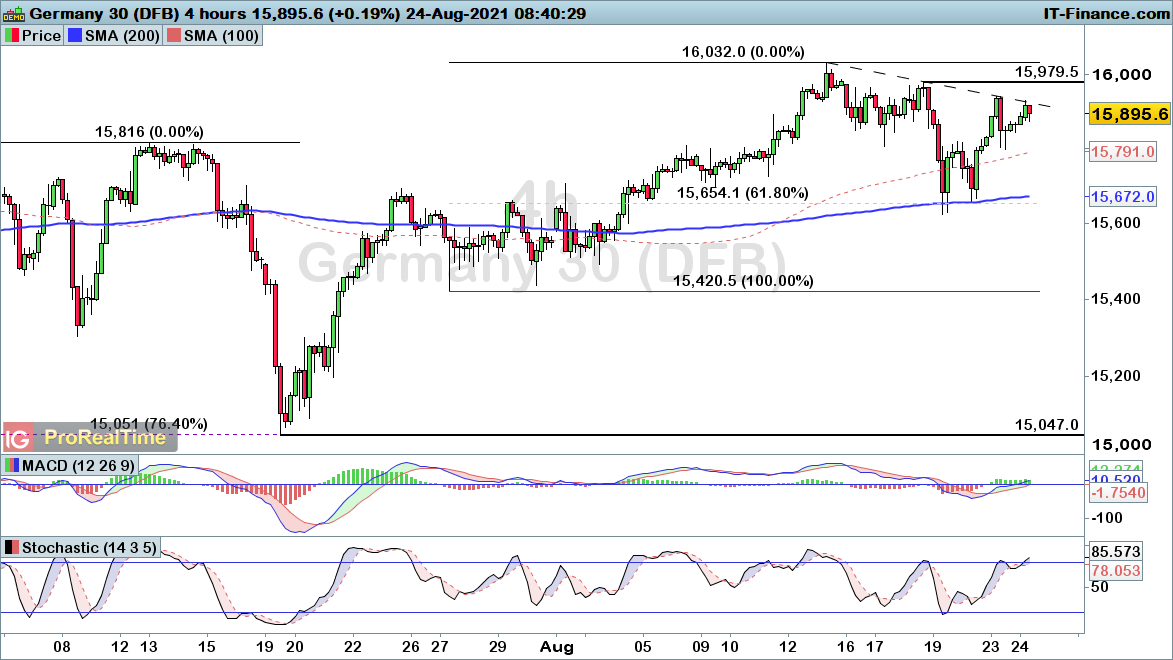
DAX rallies into trendline resistance
The DAX has been on the rise since finding support on the confluence of 61.8% Fibonacci and 200-simple moving average (SMA) last week.
That rally has taken us back into trendline resistance, with a break up through the 15979 resistance level required to bring about a fresh bullish breakout signal for the index.
The wider bullish trend does point towards an upside break before long, yet the risk of another downside retracement remains until we see price break up through that 15979 level.
 Source: ProRealTime
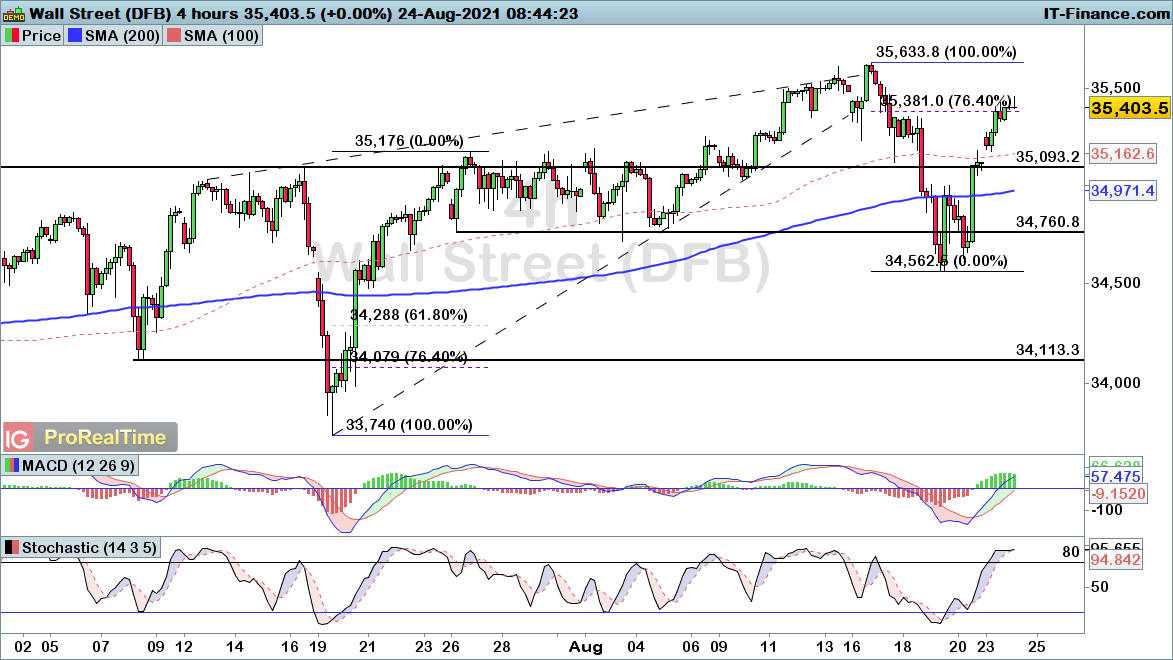
Dow Jones rises back towards record highs
The Dow has recovered much of the downside seen last week, with the index pushing back towards the previous record high of 35634.
Price has pushed marginally above the 76.4% Fibonacci resistance level, highlighting the possibility of another positive day ahead. A more protracted move above that final Fibonacci level would bring about greater confidence in a move into new highs, with any recent bearish sentiment fading in the process.
Thus, the ability to push above this current Fibonacci level should give us an idea of whether this recent rise can be sustained following the rising wedge breakdown.
 Source: ProRealTime


IG Academy Webinar Sessions Calendar
in General Trading Strategy Discussion
Posted
Book your place here.