Australian dollar may rise after FOMC minutes sink the US dollar and boost S&P 500

Entry posted by ArvinIG in Analyst article
1,065 views
Australian dollar gains, US dollar falls on FOMC minutes; S&P 500 welcomes potential Fed turning point in Fall 2022 and AUD/USD may rise next, though watch the Hanging Man.
Source: Bloomberg
Wednesday’s market recap – FOMC minutes sinks US dollar, Australian dollar gains
The haven-linked US dollar gave up a good chunk of its gains over the past 24 hours in the aftermath of the FOMC meeting minutes. In fact, it was a rosy session on Wall Street, where the Dow Jones, S&P 500 and Nasdaq 100 gained 0.61%, 0.92% and 1.45% respectively. This allowed sentiment-linked currencies, such as the Australian dollar, to find strength in the last moments of Wednesday’s session.
It seems that the key takeaway from the minutes of the Fed’s May 3rd – 4th meeting was not what was said, but rather what was left out. The document offered no immediate signals that policymakers could become more hawkish outside of current expectations. In fact, there were clues that the central bank could even pause its current hike cycle in the fall.
According to the document, the Fed is 'well-positioned later this year to assess the effects of policy firming and the extent of which economic developments warranted policy adjustments'. In recent weeks, markets have been materially pulling back 2023 tightening prospects. Odds of a 50-basis point increase are also fading for September.
On the intra-day chart below, the US dollar can be seen weakening after the FOMC minutes crossed the wires. This is as the S&P 500 pushed higher. The improvement in risk appetite helped propel AUD/USD higher, though it still left it lower by the end of the session.
FOMC Minutes Market Reaction
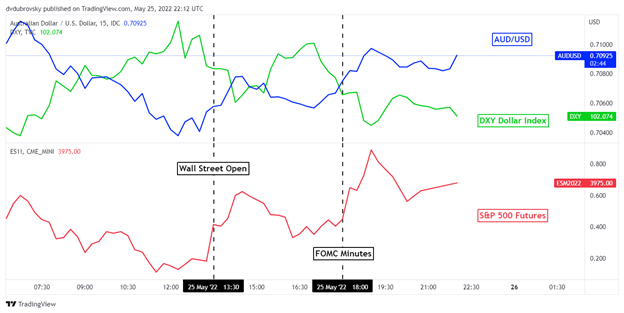
Source: TradingView
Thursday’s Asia-Pacific trading session – Australian Capex, AUD/USD
The improvement in risk appetite on Wall Street is leaving the door open for some follow-through for Thursday’s Asia-Pacific trading session. As such, regional indices such as the ASX 200 and Nikkei 225 could receive a boost. This could bode well for the sentiment-linked Australian and New Zealand dollar, while placing the anti-risk US dollar and Japanese yen in a vulnerable spot. AUD/USD has first quarter Australian Private Capital Expenditures to look forward to. A stronger result could boost RBA tightening bets, offering AUD/USD upside momentum.
Australian dollar technical analysis
AUD/USD has been struggling to hold a breakout above the falling trendline from March on the daily chart below. Prices have left behind a Hanging Man candlestick pattern. This is a sign of indecision that can appear after a period of gain. Downside follow-through could spell trouble, though that has also been somewhat lacking. Resuming gains exposes the 0.7165 inflection point. Otherwise, a turn lower places the focus on the 0.6968 – 0.7000 inflection zone.
AUD/USD daily chart
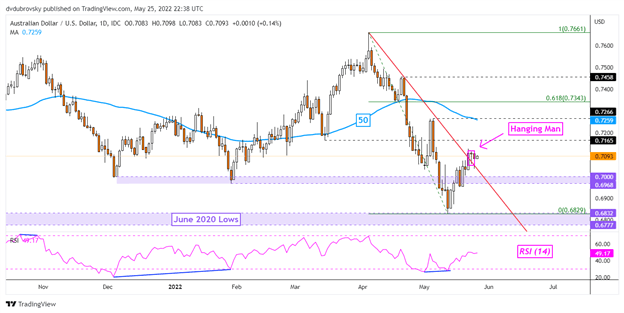
Source: TradingView
This information has been prepared by DailyFX, the partner site of IG offering leading forex news and analysis. In addition to the disclaimer below, the material on this page does not contain a record of our trading prices, or an offer of, or solicitation for, a transaction in any financial instrument. IG accepts no responsibility for any use that may be made of these comments and for any consequences that result. No representation or warranty is given as to the accuracy or completeness of this information. Consequently any person acting on it does so entirely at their own risk. Any research provided does not have regard to the specific investment objectives, financial situation and needs of any specific person who may receive it. It has not been prepared in accordance with legal requirements designed to promote the independence of investment research and as such is considered to be a marketing communication. Although we are not specifically constrained from dealing ahead of our recommendations we do not seek to take advantage of them before they are provided to our clients.
Daniel Dubrovsky | Currency Analyst, DailyFX, San Francisco
26 May 2022


.jpeg.98f0cfe51803b4af23bc6b06b29ba6ff.jpeg)

0 Comments
Recommended Comments
There are no comments to display.
Create an account or sign in to comment
You need to be a member in order to leave a comment
Create an account
Sign up for a new account in our community. It's easy!
Register a new accountSign in
Already have an account? Sign in here.
Sign In Now